
The bags we received. However, we didn’t have enough time to sort out the fourth bag.
We started our research on the trash from a certain Atlanta household by labeling the bags we received in order: Bag 1 was full of recycled bottles and containers such as salad boxes, cans, and drink bottles; bag 2 mostly contained food debris such as chicken bones, coffee grains, and rotten vegetables; bag 3 held recycled cardboards and paper. We labeled the items from these bags as Group Number – Bag Number – Item Number. For instance, the first item in the first bag was G1 – B1 – I1, and so on so forth.
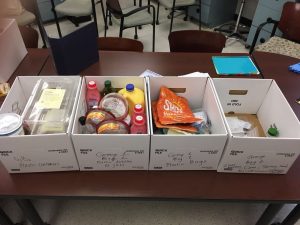
The categorization of trash. The artifacts were put in different bags after we recorded their features.
Aside from categorizing the artifacts numerically, we also classified them into different types of containers and products. As is shown in the picture above, the trash was separated into multiple categories such as “Plastic Container,” “Plastic Bags,” “Plastic Bottles & Jars” and “Miscellaneous”. When sorting the artifacts, we recorded the height, weight and length of each of the objects, described its features and wrote down things that we thought would be helpful for our research (I recognized certain tea ingredients that are commonly used in China, which possibly served as evidence for imported good, and thus globalization).
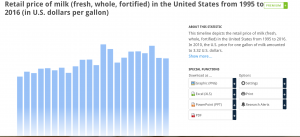
Secondary Evidence. Statistics showing the average retail price of milk in recent years.
The telltale artifacts and products provided us with information about the household such as its kinship structure, consumer habits, educational level and socioeconomic status. When analyzing its socioeconomic status, I referred to the datas on Statista, an online resource for statistics which showed me the average price of the food products in the U.S. By comparing the average price with the price of the products consumed by the household, I discovered that the household spent approximately $3 – $4 more on the foods they bought. This suggests that their overall affordability on eating is above average.
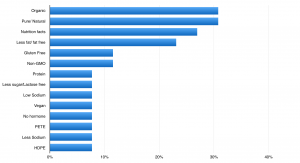
Bar chart showing how frequent the household consumes certain types of products.
I also made a bar chart showing the frequency of the types of foods they consumed. These foods (Organic food, Natural food) have higher price than conventional goods because they are taken better care of. This result tells me that the family has a relatively high living standard, and combining this fact with signs of participation in leisurely activities (evident from the cardboards and paper with brands of luxury goods printed), I concluded that the household roughly belongs to the upper-middle class.
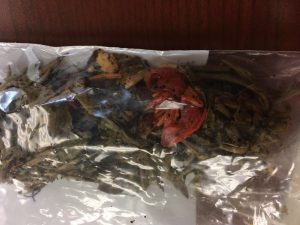
Tea ingredients. Presumably wolf berry which is commonly used in Chinese tea culture.
Trends of globalization and specialization among countries were also something I was very interested in. I found many wine bottles showing their origin from French and Italy. I also found a fair amount of tea bags, and by observing the ingredients, I discovered that they were imported from China. These results somehow indicates the specialization and exporting conditions of the countries of which the names were seen on the artifacts. The garbages we observed not only depicted a comprehensive picture of the household, but also a picture of the society.