Below we summarize the main research projects that have been conducted by this group
- Project 1: Comparison of the bias of influenza Vaccine Effectiveness (VE) Estimates from four observational study designs
- Project 2: A Stochastic agent-based simulation model for comparing the bias and precision of influenza VE estimates from observational studies
- Project 3: The Bias of Estimates of Influenza VE from Test–negative Studies
- Project 4. Bias of influenza vaccine effectiveness estimates from test-negative studies conducted during a pandemic
- Project 5. The Bias of Estimates of Influenza VE from Test–negative Studies under the ‘All-or-none’ vaccine model
- Project 6: The test-negative design for studies of the effectiveness of influenza vaccine in inpatient settings
- Project 7: Comparing interim influenza VE estimates to estimates obtained at the end of the influenza season
- Project 8: Maximum likelihood estimation of influenza VE against transmission from the household and from the community
- Project 9: Estimating the number of influenza cases averted in the USA due to direct and indirect protection from influenza vaccination
- Project 10: A Comparison of the Test-negative and Traditional Case-control Study Designs with Respect to the Bias of Estimates of Rotavirus Vaccine Effectiveness
Project 1: Comparison of the bias of influenza Vaccine Effectiveness (VE) Estimates from four observational study designs
We developed and used a probability model to evaluate the bias of influenza VE estimates obtained from (1) active surveillance cohort (ASC), (2) passive surveillance cohort (PSC), (3) test-negative (TN), and (4) traditional case-control (TCC) studies. The study population in each of these studies consists of individuals who receive most of their medical care at a single clinic or network of clinics and consent to being included in the study. In an ASC study, a person is tested by study personnel for influenza whenever they develop and report symptoms of acute respiratory illness (ARI) regardless of whether they seek medical care for their symptoms. In PSC, TN, and TCC studies, when an individual develops an ARI, s/he may seek medical care at a clinic for treatment of the ARI and may be tested for influenza infection. Definitions of cases and non-cases/controls for each study design are shown below.
| Study design | Cases | Controls/Non-cases |
| ASC | Individuals in the cohort who report an ARI and test positive for influenza | All other members of the cohort |
| PSC | Individuals in the cohort who seek medical care for an ARI and test positive for influenza | All other members of the cohort |
| TN | Members of the study population who seek medical care for an ARI and test positive for influenza | Members of the study population who seek medical care for an ARI and test negative for influenza |
| TCC | Members of the study population who seek medical care for an ARI and test positive for influenza | Randomly selected individuals from the study population who did not develop an ARI throughout the study |
Probability Model
We developed a dynamic probability model consisting of five steps. Below we define the model steps and the associated variables. All variables are defined for each member of the study population. Within this model we allow some variables to vary over time. We consider each time unit to be one week. In the figure below, we present a directed acyclic graph (DAG) to illustrate the possible sources of confounding and bias present in studies designed to evaluate influenza VE.
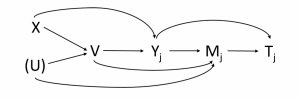
j is an index for the week (j=1, 2, … J).
| Variable | Definition | Values |
| X | Health Status | 0 – frail person 1 – healthy person |
| U | Health Awareness (unobserved) | 0 – low health awareness 1 – high health awareness |
| V | Vaccination Status | 0 – unvaccinated 1 – vaccinated |
| Yj | Influenza/non-influenza ARI status in week j | 0 – no ARI 1 – non-influenza ARI 2 – influenza ARI |
| Mj | Seeking medical care for ARI in week j | 0 – no 1 – yes |
| Tj | Result of test for influenza infection in week j | 0 – negative 1 – positive |
The model consists of the following steps:
Step 1: Covariates. We assume that people within the population can be classified with a health status of either “healthy” or “frail” and a health awareness of either “high” or “low”. We define an observable binary variable X for a person’s health status, and a binary variable U for a person’s health awareness.
Step 2: Vaccination. We consider the scenario where everyone is either vaccinated at least 14 days prior to the study or remains unvaccinated throughout the study. We define a binary variable V for vaccination status, where V=1 if a person is vaccinated. The probability of vaccination may depend on X and U.
Step 3: Influenza and non-influenza ARI. During the influenza season, a person may become infected with an influenza virus and develop influenza ARI (FARI). Regardless of influenza infection, a person may develop one or more non-influenza ARIs (NFARI). We assume that an individual can only become infected with influenza once during the study period and that a person can have no more than one NFARI per week, but there is no limit on the total number of NFARIs. We define a variable Yj for the illness/infection status in week j as follows: Yj=0 for no ARI, Yj=1 for NFARI, and Yj=2 for FARI. If a person has both NFARI and FARI in the same week, we consider them as FARI (i.e., Yj=2). The distribution of Yj may depend on a person’s vaccination (V) and health (X) status.
Step 4: Seeking medical care for ARI. A person with an ARI may seek medical care. We define a binary variable Mj for whether a person sought medical care for an ARI in week j. The probability of seeking medical care depends on Yj, as only those individuals who have an ARI may seek medical care, and it may be different for FARI and NFARI patients. This probability may also depend on V and U. We assume that the conditional probability of M given Y is fixed over time and that P(Mj=1|Yj=0) = 0.
Step 5: Testing for influenza infection. A person with ARI may be tested for influenza infection. We define a binary variable Tj as the test result for a person with ARI in week j, where Tj=1 for an influenza positive test result. We assume the probability of testing positive for influenza given a person’s influenza infection status does not depend on any other factors.
Sources of Bias
The table below lists the various sources of bias that may occur under our model and assumptions. We use labels to refer to these sources of bias later. Each source of bias can be attributed to deviation of a specific probability ratio (PR) from 1.
| Label | Source of Bias |
| A | Vaccination affects the probability of NFARI |
| B1 | Healthy persons have a lower probability of NFARI |
| B2 | Healthy persons have a lower probability of FARI |
| BS | Healthy persons have a lower probability of FARI and NFARI. Health status has the same effect on the probabilities of both types of ARI. |
| C | Vaccination lowers the probability of seeking medical care in FARI patients (because of reduced symptom severity). |
| D | ARI patients with high health awareness have a higher probability of seeking medical care. |
Below, we list the probability ratios corresponding to each source of bias and the range of values used in our calculations.
| Source of Bias | Probability Ratio | Definitions | Range |
| A | PRA | P(NFARI|Vacc)/P(NFARI|Unvacc) | 0.5 – 2.0 |
| B1 | PRB1 | P(NFARI|Frail)/P(NFARI|Healthy) | 1.0 – 2.0 |
| B2 | PRB2 | P(FARI|Frail)/P(FARI|Healthy) | 1.0 – 2.0 |
| BS | PRBS | Common value of PRB1 and PRB2 | 1.0 – 2.0 |
| C | PRC | P(SMC|FARI, Vacc)/P(SMC|FARI, Unvacc) | 0.5 – 2.0 |
| D | PRD | P(SMC|Low HA)/P(SMC|High HA) | 0.5 – 2.0 |
P = Probability, PR = Probability ratio, Vacc = Vaccinated, Unvacc = Unvaccinated, FARI = Influenza ARI, NFARI = Non-influenza ARI, HA = Health awareness, SMC = Seeking medical care
Outcomes of interest
The bias of a VE estimate may depend on the outcome against which the vaccine is supposed to protect: (a) symptomatic influenza (SI) is any influenza illness, or (b) medically-attended influenza (MAI) which is an influenza illness that required medical attention.
Results
Our primary findings are summarized in the following table:
Bias* of Estimates of VE against Symptomatic Influenza (SI) and Medically-attended Influenza (MAI) from Four Study Designs
| Source of Bias | Outcome | ASC | PSC | TN | TCC |
| None | SI and MAI | no bias | no bias | no bias | small bias |
| A | SI and MAI | no bias | no bias | large bias | large bias |
| B1 | SI and MAI | no bias | no bias | small bias | small bias |
| B2 | SI and MAI | small bias | small bias | small bias | small bias |
| BS | SI and MAI | small bias | small bias | no bias | small bias |
| C | SI | no bias | large bias | large bias | large bias |
| C | MAI | ** | no bias | no bias | small bias |
| D | SI and MAI | no bias | moderate bias | no bias | moderate bias |
*Bias is defined as the absolute value of the difference between the estimated and the true VE. Small bias = below 5%; moderate bias = 5%-10%; large bias = above 10%.
**ASC studies do not provide an estimate of VE against MAI as information about seeking medical care is usually not collected in these studies.
Conclusions
- TN is the preferred study design for estimating VE against MAI. It provides an unbiased estimate if vaccination does not affect the probability of NFARI and health status has the same effect on the probabilities of FARI and NFARI.
- ASC is the preferred study design for estimating VE against SI
- VE estimates from PSC, TN and TCC studies may have substantial bias when the outcome of interest is SI and the vaccine may reduce symptom’s severity of FARI patients (Bias C).
Publication
Project 2: A Stochastic agent-based simulation model for comparing the bias and precision of influenza VE estimates from observational studies
Our stochastic agent-based simulation model generates susceptible-exposed-infected-recovered (SEIR) influenza outbreaks in a heterogeneous population. Upon infection with the influenza virus, a person may develop an acute respiratory illness (ARI). In addition, members of the population may develop one or more non-influenza ARI’s during the influenza season. The population consists of several strata (usually corresponding to age groups). In addition, members of the population belong to one of two ‘health status’ categories. Regardless of their health status classification, members may differ with respect to their probability of seeking medical care when they develop an ARI. Members may be vaccinated against influenza before or during the influenza season. The probability of being vaccinated depends on a person’s stratum, health status and propensity of seeking medical care.
For each simulation, our software generates an outcomes file with information about every member of the population. This information includes the person’s stratum, health status, propensity of seeking care, vaccination date (if vaccinated), day of influenza infection (if infected), type of influenza infection (asymptomatic or ARI) and occurrences of non-influenza ARI’s. Based on this information, the software can generate influenza studies according to specified study designs and calculate estimates of the vaccine effectiveness from each study. Finally, the mean of the VE estimates from all the simulations is calculated for each study design and compared with the true VE. The bias of the VE estimate is the difference between the mean estimated VE and the true VE. The standard error of the VE estimate is calculated from the standard deviation of the individual VE estimates.
We developed C++ and R software to conduct the simulations and computations described above. A technical description of the software can be found in Section C.2 of the Report. We used the software to evaluate and compare bias of VE estimated from the four study designs discussed in Project 1. The results and conclusions are very similar to those obtained from the probability model described in Project 1.
Project 3: The Bias of Estimates of Influenza VE from Test–negative Studies
Estimates of the effectiveness of influenza vaccines are commonly obtained from a test-negative design (TND) study, where cases and controls are patients seeking care for an acute respiratory illness who test positive and negative, respectively, for influenza infection. Vaccine effectiveness (VE) estimates from TND studies are usually interpreted as vaccine effectiveness against medically-attended influenza (MAI). However, it is also important to estimate VE against any influenza illness (symptomatic influenza (SI)) as individuals with SI are still a public health burden even if they do not seek medical care. We present a numerical method to evaluate the bias of TND-based estimates of influenza VE with respect to MAI and SI. We consider two sources of bias: (a) confounding bias due to a (possibly unobserved) covariate that is associated with both vaccination and the probability of the outcome of interest and (b) bias resulting from the effect of vaccination on the probability of seeking care. Our results indicate that (a) VE estimates may suffer from substantial confounding bias when a confounder has a different effect on the probabilities of influenza and non-influenza ARI, and (b) when vaccination reduces the probability of seeking care against influenza ARI (because of reduced severity of symptoms) then estimates of VE against MAI may be unbiased while estimates of VE against SI may be have a substantial positive bias (i.e., they overestimate the true VE).
Publication
Project 4. Bias of influenza vaccine effectiveness estimates from test-negative studies conducted during a pandemic
In Project 1 we assumed that all the vaccinated persons became effectively vaccinated prior to the onset of the study. When an influenza pandemic strikes, a suitable vaccine becomes available a few months after the onset of the pandemic and it takes a few more months until the desired vaccine coverage is reached. In other words, study participants become effectively vaccinated during the study. Using the probability model developed in Project 1, we found that the bias of the VE estimate from a test-negative study conducted during a pandemic is usually larger than the bias from a study conducted during a seasonal outbreak (when all vaccination occurs prior to the outbreak). Moreover, it is difficult to predict how the bias depends on the time between the onset of the pandemic and the time the vaccine becomes available.
Publication
Project 5. The Bias of Estimates of Influenza VE from Test–negative Studies under the ‘All-or-none’ vaccine model
The model described in Project 1 assumed that the vaccine is ‘leaky’, i.e. vaccinated individuals have a lower chance of becoming influenza-infected, compared to unvaccinated individuals. In this project we modified the model to reflect the ‘all-or-none’ mechanism, where a fraction of vaccinated persons become immune (i.e. cannot become infected) while all other vaccinees are not affected by the vaccine. We found that under this alternative model, the bias of VE estimates from test-negative studies is usually smaller than the corresponding bias expected under the ‘leaky’ vaccine assumption.
Project 6: The test-negative design for studies of the effectiveness of influenza vaccine in inpatient settings
A main concern of the TN design in the inpatient setting, as for any case-control design, is selection bias. In TN studies based on hospitalized influenza cases, selection bias may differ from studies based on outpatient cases. Specifically, the proportion of controls who have chronic cardiopulmonary (CP) conditions and are highly vaccinated may be substantial. CP exacerbations could be due to non-infectious causes. We derived mathematical expressions for VE against laboratory-confirmed influenza hospitalizations and used a simulator to verify theoretical results exploring expected biases under various scenarios. We explored meaningful interpretations of VE estimates from inpatient TND studies by comparing estimates from simulated inpatient TND studies to VE estimates from simulated cohort studies as well as to theoretical values of VE against laboratory-confirmed influenza hospitalizations. We found that estimates from inpatient TND studies capture the vaccine-mediated protection of the source population against laboratory-confirmed influenza hospitalizations. If CP individuals are enrolled because of non-infectious exacerbations, biased VE estimates will result. If CP status is adjusted accurately, the VE estimates can be unbiased.
Publication
Project 7: Comparing interim influenza VE estimates to estimates obtained at the end of the influenza season
We used simulated influenza outbreaks to compare interim VE estimates obtained during the influenza season with the corresponding estimates at the end of the season. We found that interim VE estimates are usually good predictors of the final estimates.
Project 8: Maximum likelihood estimation of influenza VE against transmission from the household and from the community
Recent studies have used a monitored household cohort study design to determine separate VE estimates against influenza transmission from the household and community. We developed a probability model and accompanying maximum likelihood procedure to estimate vaccine-related protection against transmission of influenza from the household and the community. Using agent-based stochastic simulations, we validated that we can obtain maximum likelihood estimates of transmission parameters and VE close to their true values. Sensitivity analyses to examine the effect of deviations from our assumptions were conducted. We used our method to estimate transmission parameters and VE from data from a monitored household study in Michigan during the 2012-2013 influenza season and were able to detect a significant protective effect of influenza vaccination against community-acquired transmission.
Publication
Project 9: Estimating the number of influenza cases averted in the USA due to direct and indirect protection from influenza vaccination
With influenza vaccination rates in the USA recently exceeding 45% of the population, it is important to understand the impact that vaccination is having on influenza transmission. We used a Bayesian modeling approach, combined with a simple dynamical model of influenza transmission, to estimate this impact. The combined framework synthesized evidence from a range of data sources relating to influenza transmission and vaccination in the USA. We found that for seasonal epidemics, the number of infections averted ranged from 5.8 million in the 2006/07 season (95% C.I. 5.1 – 6.5 mil.) to 32.6 million (95% C.I. 30.5 – 34.7 mil.) in the 2012/13 season. Expressed in relative terms, the proportion averted ranged from 22.5% (95% C.I. 19.9 – 26.6%) of potential infections in the 2011/12 season to 36.2% (95% C.I. 33.6 – 39.2%) in the 2008/09 season. The averted percent was only 0.23% (95% C.I. 0.05 – 0.74%) for the 2009 H1N1 pandemic, owing to the late timing of the vaccination program in relation to the pandemic in the Northern hemisphere.
Publication
Project 10: A Comparison of the Test-negative and Traditional Case-control Study Designs with Respect to the Bias of Estimates of Rotavirus Vaccine Effectiveness
Estimation of the effectiveness of rotavirus vaccines via the test-negative control study design has gained popularity over the past few years. In this study design, children with severe diarrhea who test positive for rotavirus infection are considered as cases, while children who test negative serve as controls. We used our probability model to evaluate and compare the test-negative control and the traditional case-control designs with respect to the bias of resulting estimates of rotavirus vaccine effectiveness (VE). Comparisons are performed under two scenarios, corresponding to studies performed in high-income and low-income countries. We consider two potential sources of bias: (a) misclassification bias resulting from imperfect sensitivity and specificity of the test used to diagnose rotavirus infection, and (b) selection bias associated with possible effect of rotavirus vaccination on the probability of contracting severe non-rotavirus diarrhea.
Our results suggest that both sources of bias may produce VE estimates with substantial bias. Particularly, lack of perfect specificity is associated with severe negative bias. For example, if the specificity of the diagnostic test is 90% then VE estimates from both types of case-control studies may under-estimate the true VE by more than 20 percent. If the vaccine protects children against non-rotavirus diarrhea then VE estimates from test-negative control studies may be close to zero even though the true VE is 50%. However, the sensitivity and specificity of the enzyme immunoassay test currently used to diagnose rotavirus infections are both over 99%, and there is no solid evidence that the existing rotavirus vaccines affect the rates of non-rotavirus diarrhea. We therefore conclude that the test-negative control study design is a convenient and reliable alternative for estimation of rotavirus VE.
Publication