
Dr. Richard Mendola, data scientist and race car driver.
Welcome to 2015. Beginning this month, my senior leadership team and I will be writing a monthly column for our LITS newsletter. My hope is that these columns will give all of you a better understanding of the important issues facing our organization, our plans for moving forward, and what you can do to contribute to our success. Along the way, I expect that you’ll discover a bit more about the LITS leadership teams’ perspectives and backgrounds.
The focus of my first article is on applying some of the concepts from the data science field. Bear with me, even if your initial reaction is that this topic has little to do with your professional activities at Emory.
Most of you know that I was trained as a clinical psychologist and also ran a statistics/computer consulting business. Although I’ve been away from the front lines of data analysis for several decades now, being in the IT profession has kept me focused on the centrality of data and information. Early in my career, I would have never predicted that terms like “big data” and “analytics” would have entered the public lexicon, let alone become the basis for some of the largest and most successful tech companies in the past decades.
At Emory, there are certainly many areas that are leveraging the “big data” revolution, with genetics and imaging being just a few of the examples. We’ve also got our share of analytics focused projects happening in LITS, including the School of Medicine’s tri-partite dashboard, our Finance and Student BI projects, our learning analytics project and the analysis that occurs on the millions of security events that are monitored each month. But that isn’t what I want to focus on in this article. My comments are confined to one small sliver of how we might better use data in our organization.
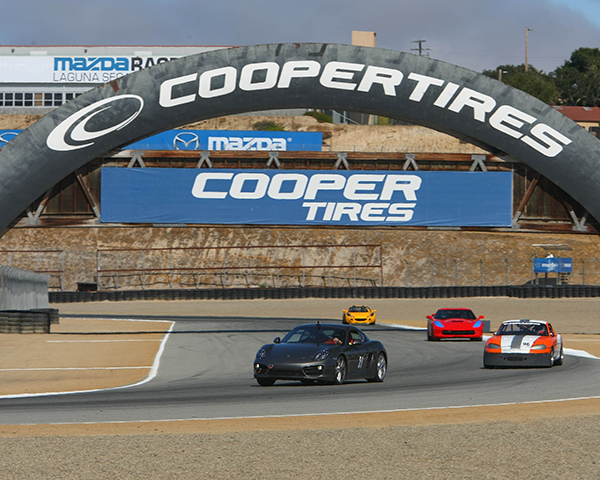
Rich entering Turn 3 at the famed Mazda Raceway Laguna Seca circuit.
My argument is that each of us is performing some activity that could be enhanced by a more data-informed perspective. Some categories of examples might include: how long it takes to perform a common task, whether customers are utilizing the services and products that we’ve invested in, or how the quality of your work is affected by other variables in your work environment. My challenge to each of you is to come up with one metric you can track, whether it is for a day or a week, just to see what insights you discover. It might be helpful to think of it as an experiment. Collect some data on how you’ve been performing a well-established task, and then make a change to see if it hurts or helps. You don’t have to share what you find, but if you wish to, we will certainly make some channels available for you to do that.
On my leadership team, we often talk about metrics, and how we can determine if we are making progress against our objectives. It is easy to get caught up in the potential downsides of metrics, such as evaluating those items that are easy to measure, or chasing a metric for its own sake. For this task, you needn’t worry about those complexities. Just have fun with the exercise.
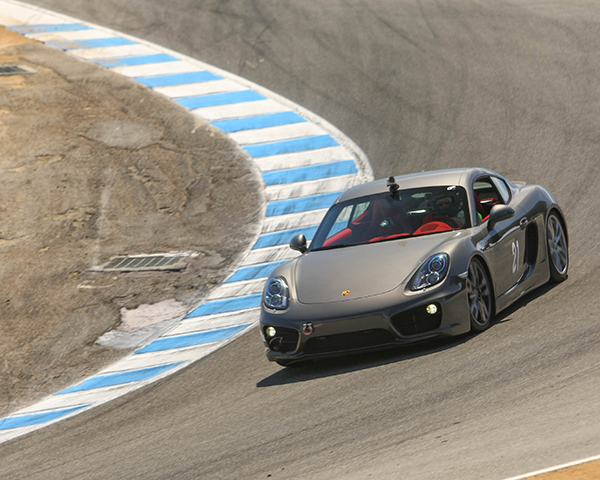
Racing “illustrates the value of collecting and assessing data.” – Mendola.
I’m going to close with a personal example from outside of work. I’ve chosen this example because it illustrates the value of collecting and assessing data for an activity that I thought I already knew how to do, which is driving a car. Granted, my example is driving a car on a racetrack, but I originally thought the same principles would apply. I was mistaken. Driving a car on a racetrack, despite its apparent similarities with driving on public roads, is not something that you learn overnight. You can work with instructors, practice, and get a feel for what produces faster lap times, but once you get the basics down, using data from the car’s various sensors can accelerate your learning curve and improve your performance dramatically. Here is an example of some of the data streams and calculated ratios that I review after every day on the track.
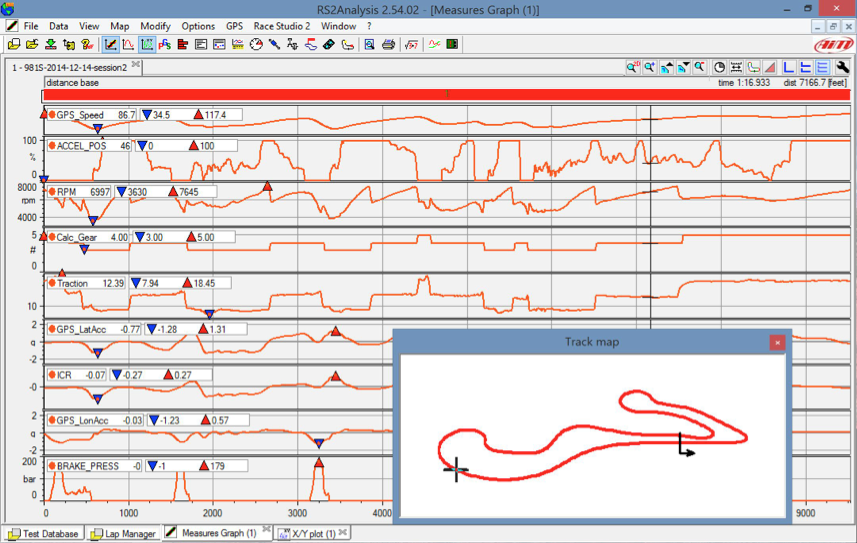
Like most unfamiliar data, it probably looks like gibberish. But since learning how to interpret the data, I can now tell whether I am turning early or late, accelerating/braking smoothly, and fully pushing the physical limits of the car and its tires. I’ve also got comparison data from a professional driving my car on some of the tracks, which makes it clear how much I have to learn!
In your role at Emory, you’re already a professional at what you do. Lets see how a data driven perspective can help you enhance your performance even further!