The 2 Way Odour Exposure Test in Prairie Voles – Research Update

Danial Arslan

Social interactions are often thought to be one of the most basic human needs that exists, alongside the need to find food to eat and water to drink. Some even postulate that our brains evolved, over the millennia, due to selection pressures placed because of the social environments our ancestors lived in. This came to be known as the social brain hypothesis.

As it turns out this instinctive need to form social bonds transcends the human species.

Studies have found genes which regulate social behaviours in distant organisms like the Drosophila melanogaster, Caenorhabditis elegans and Microtus ochrogaster. Thus, it can be inferred that even these species have their own systems of social hierarchies, societies and social bonds.

A variety of neuropsychiatric disorders such as schizophrenia and autism spectrum disorders are characterized by disruptions in these social behaviours and bonds. Hence, there has been a recent surge in the study of the neural circuitry involved in forming social bonds in order to better understand these diseases. Since social bonds aren’t only restricted to humans, we can study these disorders by studying neural pathways involved in forming bonds in other species first.

My lab has been studying prairie voles (Microtus ochrogaster) due to their surprisingly monogamous nature (as described in my previous blog post here). Based on previous work done, the lab is trying to ascertain whether oxytocin or specific brain waves, between the nucleus accumbens and the medial prefrontal cortex regions of the brain, might be responsible for the formation of these monogamous relationships.

The current data which led to this finding has been based on analysing brain waves, alongside affiliative behaviours seen, while voles were cohabitating. However, in order to find a stronger correlation between our independent variables (oxytocin concentration or the frequency of brain waves between the two brain regions) and what we wanted to measure experimentally (the strength of the partner bond formed) we needed to devise a more straightforward test and this is what I and one of the graduate students in my lab, sought out to do.

And so after weeks of testing different theories, we came up with a 2 way odour expoure test that we will now use moving forward. The basic principle would be to ‘entrap’ the scent of two female voles. We did this by collecting the bedding used by the voles while singly caged. (Side note: Since vole’s love making burrows paper bedding is placed in their cages to keep them busy). This paper bedding successfully captured their smells and was added to a petri dish with an exact number of perforations on the top and bottom of the dish’s cover. This would allow the scent to be carried as air passed in through one set of perforations and moved out of the other.

After entrapping the female scent, one female would be cohabitated with the male vole to establish the pair bond and then the male vole would be placed in a cage with 3 compartments as shown in the diagram below:
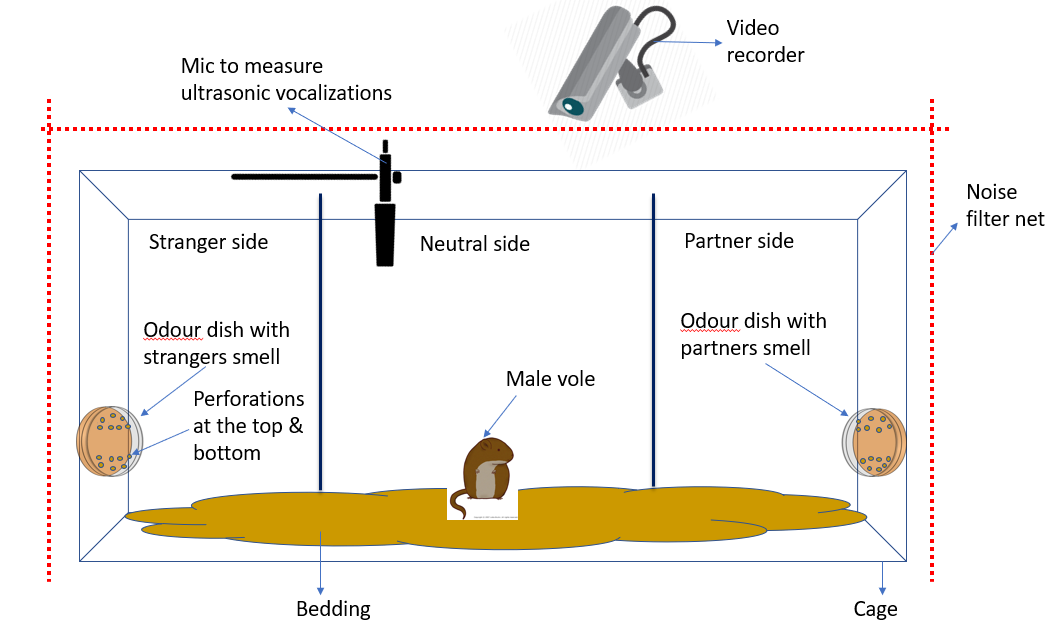
The ‘partner’ would be the female the male was housed with and the ‘stranger’ would be the female who was never housed with the male. The male would be placed in the center compartment and his movement to different sides would be tracked.

Then after the assay, the time spent in each compartment would be analysed, as well as the time spent by the vole sniffing and investigating each of the petri dishes, to ascertain whether the vole preferred the partner compartment and petri dish over the other one.

Meanwhile, any vocalizations made by the vole in these different sides would also be recorded to see if the vole’s vocalizations differed when it was in a side of the cage where it could smell its partner to when it was in the stranger side.

A general outline of the entire procedure can be seen with this schematic:
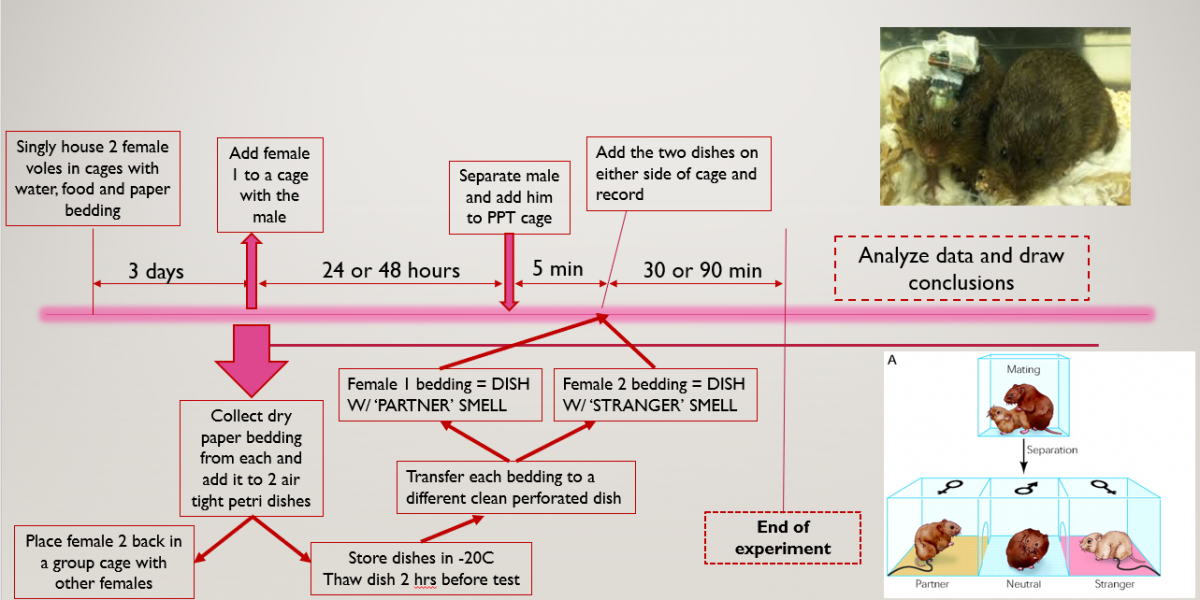
And so, we came up with an odour exposure test which would be done by seeing which odour the vole would investigate more. The basic assumption was that the vole would deduce that the smell of the female vole would indicate her presence and so would call out to her. We tweaked around the time we cohabitated the voles for as well as the time of the partner preference test itself to see under what conditions we could obtain the best data and that would be used moving onwards.

So, in conclusion, our odour exposure test would look at how the male vole reacts and subsequently behaves to the presence of olfactory cues which give it the impression that it is close to its partner. Preference would be seen by looking at time spent in a particular side of the cage, time spent sniffing the petri dish and auditory calls made out when in a particular side. This data could then be used to see if the behaviours do in fact differ when the vole detects the partner scent or the stranger scent. If a significant difference is seen, then in the future a neurologger device could be inserted into the brain regions of interest to see the exact brain waves and levels of oxytocin present during these behaviours and hence this devised test could act as a standardized assay for future experiments in the field.


Bibliography and Travel Plans for Reading Manuscripts!

Last semester, I conducted a broad study of the reception history of the Psalms, especially as they relate to Jewish impact on translations into English. I concluded by deciding on a specific topic of study: Rashi’s influence on  the Wycliffite translation of the Psalms through the postillae of Nicholas of Lyra. My next steps would be to:

  1. Come up with a bibliography of manuscripts to study more closely.
  2. Understand the history of these manuscripts, how they can be read, and start reading what transcriptions of them are available.
  3. Obtain funding to study these manuscripts.
  4. Study said manuscripts.

It was easy to conclude that I should read the Wycliffite manuscripts housed in the Bodleian Library and the British Museum in London, as these are the sources in which I will look for trickled-down influences from Rashi.

Bodleian Library, Oxford University
The Bodleian Library is one of the greatest libraries in the world, especially for reading original manuscripts! It’s been a perennial dream of mine to read manuscripts at Bodley.

In the first week of winter break, I applied for the Currey Seminar scholarship, which I won in February. This would pay for a large chunk of a trip to read manuscripts in England, but it would not be enough to fully cover my trip. Early in the Spring semester, I also applied for the Halle Institute-Fox Center for Humanistic Inquiry Undergraduate Global Research Fellowship. This offers a heftier grant with other benefits, including a residency at the Fox Center for Humanistic Inquiry. A few weeks ago, I was incredibly grateful to learn that I also won this scholarship. Together, these scholarships will fully fund a 3-week trip to England for me to read and compare the various Wycliffite manuscripts.

In the meantime, I have been working on a list of specific manuscripts to pay special attention to. I used a number of books charting the many extant Wycliffite manuscripts, but by far the most useful book was Elizabeth Solopova’s Manuscripts of the Wycliffite Bible in the Bodleian and Oxford College Libraries. This book provides not only a list with basic facts, but also all kinds of details. I combed through the book, compiling a list of the manuscripts with relevant details. I plan to reread this compilation (which also includes information from other books) and pick out the especially relevant points of significance.

Bilingual Wycliffite Manuscript
A bilingual (Latin and English) manuscript of the Later Version of the Wycliffite Psalter. MS Arundel 104, f. 364v. The text colors and markings have significance as they pertain to the process of translation.

I’ve also read a very useful and suitable manual by Conrad Lindberg titled A Manual of the Wyclif Bible, Including the Psalms (Stockholm Studies in English CII). This discusses in micro and macro details what we know of the process by which the Wycliffite translations came about. It is a wonderful philological manual, and though I found it to be slow reading, it was important for the purpose of familiarizing myself with the Wycliffite translations. Moreover, it uses the Psalms as examples for its analyses, which fits perfectly with my topic!

(On a side note, today I started learning Leonard Bernstein’s Chichester Psalms in choir. We are performing the Chichester Psalms in honor of his 100th birthday. It’s a lot of fun! Bernstein, a Jewish conductor, wrote this composition for the Chichester Cathedral Choir–another example of inter-religious cooperation.)

Leonard Bernstein
Leonard Bernstein was better known as a conducting virtuoso, but he also worked hard to establish himself as a composer. West Side Story is perhaps his most iconic work of musical composition.

This Spring Break, I walked to the Decatur County Superior Court Law Clerk and submitted my application for a US Passport (my most recent passport has expired). Currently, there are quite a few different developments going on in my research, and it can be a bit difficult to keep each of them moving forward at the same time. Starting April 1, I will begin the process of planning the trip: purchasing tickets (which means that I also have to figure out the other moving parts of my summer!), booking AirBNB or University dorm rooms, coming up with an agenda, gaining access to the Bodleian Library (Dr. Morey will be of great help here), contacting such Oxford Psalms Network academics as Susan Gillingham, etc. My plan is to visit Oxford in July.

I also was recently reminded of the Society of Biblical Literature. I missed the Call for Papers, although this really is not a big deal–I am not yet a member, so it would have been a bit of a process to submit a speaking proposal. Nonetheless, I think it would be meaningful to attend the national Annual Conference in Denver this upcoming November 17-20 (right before Thanksgiving!) It is always important to see the progress and development happening in related fields. In any case, I think it would be wise to become a member of the SBL some time down the road.  (If I were to attend the conference, I’d arrive early for a meeting of the Society for Post-Supersessionist Theology on the afternoon of November 16.) SBL’s International Conference is in Helsinki, Finland and will take place July 30 – August 3, which could be a pretty epic addendum to my time in Oxford, but I am also hoping to volunteer at a summer camp from July 29th – August 5th. I will have to think further about this conflict. For now, I am leaning towards the summer camp.

Denver, Colorado
Denver, Colorado

With my understanding of the three main texts of interest (Rashi’s commentaries, Lyra’s postillae, Wycliffe’s translation), I should read them in earnest; previously, I’ve mostly either scanned through them or read bits and pieces here and there. Now that I better understand their historical and hermeneutical context, I think it is time for me to read them with care. I have a book of Rashi’s commentaries as well as Wycliffe’s translations (both Early and Late Versions). Lyra’s postillae are unfortunately quite elusive, despite their huge influence in the Middle Ages; for the most part, they have not been translated, published, or even transcribed. As such, my best bet is to read around the postillae and use my rudimentary (but growing!) knowledge of Latin to figure out relevant passages in scans of manuscripts, which are available. I am still trying to think of a more efficient way to tackle this problem, but for now this will do. There is always more secondary literature, and I continue to read up on it.

Another difficulty I am facing is the following: Rashi, Nicholas, and Wycliffe are all unqiue for their literal approach to understanding the Bible, an approach that had a revolutionary effect on Christian exegesis. Despite the enormous significance, it is less exciting to point out “literalisms”–and, in general, significant “literalisms” are more difficult to find. I will continue to examine the philological specifics of these texts. I think the best thing for me to do at this point is to continue to familiarize myself with the texts themselves, to immerse myself in them. From here, I will have a better idea of how to discuss this significance of the literal approach. I’ve often thought that research is somewhat like cooking scrambled eggs: only when you bring some of the spatula’s movement into the eggs will anything start to take shape. I look forward to jumping into this next phase of research and seeing what fascinating shapes appear!

Who Are We?

Over the past few months, as I dug into archives regarding Taiwanese dance history during Japanese colonial days and the development of modern dance in Taiwan, I began to reshape my research question in attempts to examine how Taiwanese cultural identity is reflected in dance throughout the last 100 years. 

Research Question

As a Han Taiwanese, I am interested in how social changes catalyzed the development of professional concert dance among Han Taiwanese during Japanese colonization. I also want to look into how Taiwanese identity has evolved from the post colonial era into the millennial reflecting in dance styles. Specifically, I will analyze pieces made by iconic modern dance choreographers from the late 1940s to present. 

Method

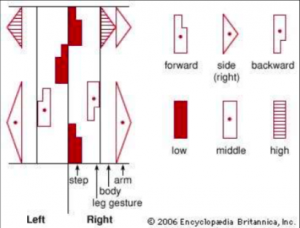
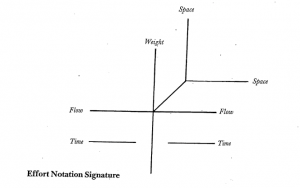
In order to analyze and describe dance, I draw knowledge and skills from one of my current classes— Dance Literacy. Rudolf Laban (1879-1958) was a dance theorist and teacher whose studies of human motion provided the intellectual foundations for the development of central European modern dance. Laban also developed Labanotation, a widely used movement-notation system (Encyclopaedia Britannica). Three major systems of movement classification constitute his framework:

1. Kinetography Laban or Labanotation, objective movement analysis anddescription

2. Eukinetics and Effort, the theory dealing with the dynamic structure of movement


3. Choreutics, or Space Harmony, the theory investigating spatial relationships of movement and dance

[https://scholarblogs.emory.edu/sire299thees/files/2018/03/space-harmony-forms.pdf]

Laban’s famous pupil, Irmgard Bartenieff furthered Laban’s concepts and developed the  movement techniques called Bartenieff Fundamentals. “The work of Irmgard Bartenieff and her many collaborators and pupils is the very greatest importance in research on mother-infant relationships, the social behavior of primitive people, choreometric styles around the world, work with psychiatric patients, studies of animal behavior,” said Margaret Mead. Bartenieff Fundamentals include the following principles:

  1. Total body connectivity
  2. Breath support
  3. Grounding 
  4. Developmental progression
  5. Intent 
  6. Complexity
  7. Inner-Outer
  8. Function-Expression
  9. Stability-Mobility
  10. Exertion-Recuperation
  11. Phrasing
  12. Personal uniqueness

Analysis

Over the spring break I analyzed 14 dance pieces done by 4 iconic Taiwanese modern dance choreographers and compiled my notes into charts based on criteria like body, space, shape, and effort. I will be organizing the notes to find patterns in dance styles of each choreographer and look into the influences of social changes during their developmental years that may be reflected in their dance pieces. Also, I will take into account of how these choreographers inspire and influence each other’s styles. Here is my raw data:

Jui-Yueh Tsai (1921-2005)— the mother of Taiwanese modern dance

Productions Shape— pin-pointed, wall, ball, spiral Effort—weight (light/strong), time(quick/sustained), flow(free/bound), space(direct/indirect) Space— vertical, horizontal, sagittal (1D, 2D, 3D) Body— initiation of movement, sequential/simultaneous, breath support
Bones of Brave Warriors (1953) pin point and more wall, few ball bound, indirect and more direct, more quick and some sustained, light more 2D than 3D, more sagittal and some horizontal, sequential, more structured, shape orientated
We love our Taiwan (1946) wall, ball, more pin point direct, quick, bound, light and few strong more 2D, sagittal, sequential and some simultaneous, shape orientated
Chase (1949) wall, some spiral light, sustained, indirect, free sagittal, diagonal, more 2D and some 3D pelvis, sequential, shape orientated, structured
Puppet (1953) wall, some ball direct, bound flow, more quick than sustained, more light than strong sagittal, more 2D and some 3D, horizontal sequential, more literal than abstract (narrative), spine initiation

Henry Yu (1941-)— the father of Taiwanese modern dance

Productions Shape— pin-pointed, wall, ball, spiral Effort—weight (light/strong), time(quick/sustained), flow(free/bound), space(direct/indirect) Space— vertical, horizontal, sagittal (1D, 2D, 3D) Body— initiation of movement, sequential/simultaneous, breath support
Black Angel (1979) wall, a few spiral, ball (back) direct, strong, quick, bound (mostly) horizontal, sagittal, mostly 2D and some 3D peripheral (hand & leg) initiation, more simultaneous

Hwai-Min Lin (1947-)— the founder of first Taiwanese modern dance company “Cloud Gate Dance Theater”

Productions Shape— pin-pointed, wall, ball, spiral Effort—weight (light/strong), time(quick/sustained), flow(free/bound), space(direct/indirect) Space— vertical, horizontal, sagittal (1D, 2D, 3D) Body— initiation of movement, sequential/simultaneous, breath support
Formosa (2017) predominantly spiral, some wall, little ball, and no pin-point both light and strong (more), both quick and sustained (more), both bound and free (more), mostly indirect Mostly 3D and some 2D (plane), more vertical and sagittal (forward) use breath to move like qigong, simultaneous,
Dust (2014) mostly wall and some spiral, architectural(shape orientated) bound, both quick and sustained,strong, direct mostly 2D (vertical + sagittal) and some 3D, mostly vertical sequential, head-tail connection, breathe to jerk
White Water (2014) mostly spiral and wall, few pin-point, and little ball, architectural(shape orientated) mostly indirect, light, free, both quick and sustained (more) vertical stress with some horizontal and sagittal, 2D and 3D arms, legs, and spine to initiate movement
Rice (2013) mostly wall and spiral, some ball both quick and sustained (more), bound flow, indirect, strong 3D and few 2D, sagittal and horizontal both sequential and simultaneous, breath for flow
Pine Smoke (2003) spiral and some wall, architectural(shape orientated) both quick and sustained (more), indirect, free and some bound, both strong and light (more) diagonal, 3D and 2D, mostly horizontal, some sagittal breath to move suddenly and evenly, both sequential and simultaneous

Tsung-Lung Cheng (1976-)— the artistic director of “Cloud Gate 2”

Productions Shape— pin-pointed, wall, ball, spiral Effort—weight (light/strong), time(quick/sustained), flow(free/bound), space(direct/indirect) Space— vertical, horizontal, sagittal (1D, 2D, 3D) Body— initiation of movement, sequential/simultaneous, breath support
13 tongues (2016) mostly spiral and some ball and wall sustained, indirect, more free and some bound, strong 3D and some 2D, more sagittal and horizontal, diagonal core initiation, sequential and more simultaneous,
Beckoning (2015) spiral, more wall and some ball, indirect, bound flow, sustained, light diagonal, sagittal, horizontal, circular pathway grounded, sequential, head and pelvis initiation
Blue hour (2013) mostly wall and some spiral both quick and sustained, both strong and light, more indirect, bound 3D, improvisational breath for abrupt movement, simultaneous

Links to dance pieces:

Tsai

https://www.youtube.com/watch?v=8JaUMn0c4a8

https://www.youtube.com/watch?v=-z7lPWd-RV8&t=31s

https://www.youtube.com/watch?v=syN0deWvQ0c

https://www.youtube.com/watch?v=PezHlV2xxH8 (full performance)

Yu

https://www.youtube.com/watch?v=uU1RrvSSozQ (from beginning to 35 seconds)

Lin

http://www.cloudgate.org.tw/en/production-formosa.html

http://www.cloudgate.org.tw/en/production-pine-smoke.html

http://www.cloudgate.org.tw/en/production-rice.html

http://www.cloudgate.org.tw/en/production-dust-and-white-water.html

Cheng

http://www.cloudgate.org.tw/en/production-13-tongues.html

http://www.cloudgate.org.tw/en/production-beckoning-and-blue-hour.html

Modeling Affective Bias Data

Last semester, I left off after reviewing all the video files of four Deep Brain Stimulation (DBS) patients completing the affective bias task during the “Chronic” phase of the clinical trial. This is the phase in which their stimulation is constitutively on for a period of 6 months, and during this time they attend weekly testings in which affective bias is administered anywhere from 1 to 4 times in a session. This phase is followed by “Discontinuation”, in which stimulation is turned off for a relatively short amount of time that cannot be disclosed to maintain patient objectivity, and patients attend daily testing sessions. The purpose of this phase is to test the long-term effects of the prior stimulation period. Due to the ethical constraints that come along with this kind of clinical trial, this off-period is the longest time a patient’s stimulation can be off. Unfortunately, this period is not always long enough to show the long-term effects of stimulation.

Anyway, now that the video files are ready to be preprocessed and analyzed, we have been waiting to meet with the graduate student who created the machine-learning algorithm that allows for facial analysis. During this waiting time, I have completed the Discontinuation database for Affective Bias for patients 906, 907, and 908. To recap, here are the steps I took to complete this task:

  • When a patient completes one run of the affective bias task, a matlab file is created with their scores for each face that was rated. During discontinuation, a patient completes the task about 4 times each session, and testing is done everyday for 2 weeks. This equates to about 150 mat lab files that must be compiled into a single database file that can be used for analysis.
  • To fast track compiling the files, I automated the process using a python script that is able to take multiple .mat files =and input them into a .csv that can be opened in excel. In addition, the script uses information about each face that was rated to calculate an expected value for each face’s rating.
  • Once all information from the affective bias task itself was complete in the database, I had to manually input patient Positive and Negative Affective Schedule (PANAS) scores. PANAS, which is a psychiatric tool used as direct measure of depression, is completed at the beginning of each testing session.

Now that the database is complete, we can begin building a model for the data. The goal of the model is to use information of the expected rating and of patient depression to predict how a given patient will rate a given face. The outcome variable is a vector of predicted responses. The model that has been used in past affective bias analysis looks something like this:

where Yi = vector of outcome responses for ith subject, Si = stimulation status, E= expected rating, D= Hamilton Depression Rating, and y0i = random intercept.

Although this is not the exact model we will be using, I will be working with Kelly to tweak the SAS script that was used to implement this regression for prior work. This analysis may end up being a minor focus of my poster given that I have spent a good portion of time this year working on it due to the setbacks in the facial motor analysis.

Research Update on GABA Spec and LCModel Protocol

In lab, I have generated a protocol (as seen below)  to operate within a neural-imaging software called LCModel. So far the process has been long and arduous, with not much usable data being collected due to shims, or faulty MRI scanning procedures. Most of my analysis will likely be methodolgically based as opposed to being grounded in emprical data. Despite this, the following protocol may prove useful as tool to help troubleshoot with errors that may appear in LCModel. Using Terminal, one can use the protocol to run LCModel in order to analyze their spectral data.

How to tunnel

  • Open Terminal>input: ssh -Y username> enter password
  • Ls to check if in the right place
  • cd CABI_MRS
  • Matlab &
  • All output goes to ‘Documents>CABIStroke>GABA>GABA processing sheet’

How to find PW

  • “Keychain”> Show bitc password> PW 2x> Copy and Paste PW into terminal

PREPROCESSING

  • In Terminal:
    • “matlab &” opens MATLAB
  • In MATLAB:
    • Open MATLAB>scripts>readSiemens_stability_CABI_MRS.m
  • Change path where it says inDir line 9 and outDir line 10
    • Go to Fetch to check file pathway
    • Example inDir: ‘/home/michael.borich/CABI_MRS/SS_###/#T_CMRRR_GABA_10min_1#
    • Example outDir: ‘/home/michael.borich/CABI_MRS/Processed/SS_###/#T
    • Make sure line 12 has the spectral_reg_flag set to 1 as default
  • Figure 2:
    • Baseline must be as straight and as close to zero as possible, adjust phase change value if it is not so.
      • If you want to change phase value, hit “y” when prompted. If not, hit “n”
      • Change phase value “y”>-10<x<10 (approx.)> if sufficient, “n”
    • Enter phase change value in GABA processing spreadsheet (column B)
  • Figure 1:
    • Blue and red peaks should both be symmetrical around 3 ppm
    • To change freq value if necessary enter “y” as prompted and then enter appropriate no.
    •  Enter freq change value in GABA processing spreadsheet (column C)
  • Figure 3:
    • Enter “n” (will not need to change phase value)
  • Figure 4:
    • Click before and after peak
    • Outputs with fullwidth_Hz_H20
    • Enter value in GABA processing spreadsheet (column D)
  • Figure 5:
    • Click before and after peak
    • Outputs with fullwidth_Hz_NAA
    • Enter value in GABA processing spreadsheet (column E)
  • Figure 6:
    • Click before and after peak around 3 ppm (creatine peak)
    • Outputs with fullwidth_Hz_Cr
    • Enter value in GABA processing spreadsheet (column F)
    • Value should ideally be less than 12
  • To obtain GABA.water file
    • In Terminal:
      • “matlab &” opens MATLAB
    • In MATLAB:
      • Open MATLAB>scripts>readSiemens_GABA_water.m
    • Change path where it says inDir line 9 and outDir line 10
      • Go to Fetch to check file pathway
      • Example inDir: ‘/home/michael.borich/CABI_MRS/SS_###/#T_CMRRR_GABA_10min_1#
      • Example outDir: ‘/home/michael.borich/CABI_MRS/Processed/SS_###/#T
  • Errors:
    • If error comes up that mentions nlinfit, go to line 12> change =1 to =0
      • “save”>”run”> enter new phase change value
    • If Diagnostics are Red then google how to check for error
    • If error comes up that mentions line 181

PROCESSING

Open LCModel

  •  Open terminal>[keep spaces]ssh -Y node7
  • Enter password
  • Open LCModel:
    • cd ~/.lcmodel
    • ./lcmgui &
  • “Select User Profile” window will appear, select “GABA”
  • “Select your data type” window will appear, select “Other”
  • Loading the DIFF data into LCModel
    • Follow path: home/michael.borich/CABI_MRS/Processed/SS_###/#T/DIFF*
      • Select “GABA.raw”
    • “Control Parameters” window appears
      • Select “Change BASIS”
      • Select file that ends in “_DIFF.basis”
    • Add “DIFF” to the end of output file path (next to Reconfigure button)
    • Click “Advanced Settings”
      • Click “Change Control-Defaults file” and make sure “GABA_DIFF” is selected
    • HIT Run LCModel
    • You will be prompted to select UNSUPPRESSED Water Reference RAW file
      • Select “GABA_water.raw”
    • Graphic should appear
      • Red line=model
      • Black line= raw data
      • Two lines should have as much overlap as possible
    • Record Data on the spreadsheet>
  • Loading the OFF data into LCModel
    • Follow path: home/michael.borich/CABI_MRS/Processed/SS_###/#T/OFF*
      • Select “GABA_off.raw”
    • “Control Parameters” window appears
      • Select “Change BASIS”
      • Select file that ends in “_OFF.basis”
    • Add “OFF” to the end of output file path (next to Reconfigure button)
    • Click “Advanced Settings”
      • Click “Change Control-Defaults file” and make sure “GABA_OFF” is selected
    • HIT Run LCModel
    • You will be prompted to select UNSUPPRESSED Water Reference RAW file
      • Select “GABA_water.raw”
    • Graphic should appear
      • Red line=model
      • Black line= raw data
      • Two lines should have as much overlap as possible

Research Update 3/14/18

This year, I have been working with Dr. Rodman and her graduate student to design a study examining how one’s chronotype interacts with the ambient lighting environment (warm, dim light light versus cool, bright light) to affect how people perceive facial expressions of varying intensities.  

Recall that chronotype refers to one’s natural inclination to sleep and wake at certain times in the 24 hour cycle.  Morning-oriented individuals prefer to sleep earlier and wake up earlier, while evening-oriented individuals prefer to sleep later and wake up later.  Blue light has been shown to increase alertness, and past studies have shown that evening-oriented individuals are at a greater risk for developing mood disorders such as depression. The lab hypothesizes that this may due to evening-oriented individuals’ greater exposure to bright (blue) light, as they may be perceiving negative (or neutral) facial expressions as more negative, due to increased alertness.

About two weeks ago, a graduate student and I started collecting data.  Prior to bringing participants into the lab, though, we had to prepare the experiment room.  The room is quite small, and we hung a curtain to partition it, so that when the experimenter opens the door the outside light does not enter the room and confound our results. Additionally, we set up two lamps with dim and bright settings and randomly assigned participants to each treatment group.

I am responsible for running six participants a week.  After participants sign the form of consent, I give them a packet of questionnaires regarding chronotype, sleep habits, eating habits, creativity, etc.  I then set a timer for 20 minutes, and they fill out the packet inside the experiment room. Participants must remain inside the room for 20 minutes in order to adjust to their prescribed lighting environment before they take the computer task.  (If a participant finishes early, I am instructed to tell them to continue checking over their answers and stay inside the room until the 20 minutes has elapsed.) Then, subjects must complete a computer task, in which faces are flashed across the screen for short, varied amounts of time.  The faces exhibit different emotions (happy, sad, fearful, surprised, angry) and are mixed with varying levels of the original neutral face. I instruct participants to rate what expression they think they see, and how confident they are in their rating, from a scale of 1-4.  Lastly, I debrief subjects on the true purpose of the study, as we had originally told participants that we were researching how personal preferences affect our perception of emotions. For the rest of the semester, I will continue to run participants and collect data.

Research on Impact of Immigration on the Well-being of U.S. Natives

Introduction and Motivation

Previous economic research has shown various economic and public health benefits of immigration policies such as Deferred Action for Childhood Arrivals (DACA) or the Development, Relief, and Education for Alien Minors  (DREAM) Act. In particular, DACA is a 2012 U.S. immigration policy that provided renewable work permits and freedom from deportation for a large number of undocumented immigrants. It is suggested to potentially improve the social welfare through four potential social determinants: economic stability, educational opportunities, social and community contexts, and access to health care.Accordingly, the termination of DACA by the Trump Administration in September 2017 has caused widespread sensation all over the U.S. As an international student, I was not familiar with the impact of immigration on the social welfare as well as the weight of such a monumental immigration policy in the hearts of U.S. population. Therefore, I want to investigate the economic and health outcomes of immigration on the well-being of U.S. natives in order to better understand the necessity of immigration policies of DACA and DREAM Act.

My original research with a concentration on the impact of immigration on the well-being of U.S. natives in terms of labor market competition and subjective well-being is inspired by the research on Happiness Economic by the 2015 Economics Nobel Prize recipient Sir Angus Deaton. According to Sir Angus Deaton’s research, economic growth is interrelated with subjective well-being (SWB). An analysis of the Gallup-Healthways Well-Being Index from 2008-2013 indicated the positive correlation between life evaluation and income.Furthermore, the study also suggests that the effects of economic growth on happiness are different in developed and developing countries. In a prospective study, I was inspired to investigate the impact of immigration on the well-being of U.S. natives across all states. The purpose of this study is to investigate how the spatial concentration of immigrants affects the life satisfaction of U.S. natives. The individual-level data on life satisfaction would be gathered from Gallup-Healthways Well-Being Index (GHWBI) poll and the data on immigrant population distribution would be collected from the Migration Policy Institute (MPI) Data Hub. On the other hand, the data on the U.S. population distribution across different age groups would be gathered from the Henry J. Kaiser Family Foundation Database, which is based on analysis of the Census Bureau’s March Current Population Survey. This study intends to examine the effect of immigration directly on the welfare of natives through constructing a linear regression model and plots of subjective well-being (SWB) against the regional statistics of MPI data. In addition, I intend to extract data on local unemployment rates, GDP, as well as the measure of life satisfaction by the Likert scale on ease of living, happiness, loneliness, and interest in life across all U.S. states.

Previous Research Findings

Economists have long focused on the impact of immigration on natives’ labor market outcomes such as wages and employment, which are objective measures of “welfare”. The typical approach has been to correlate these measures with the share of immigrants in local labor markets. The empirical evidence to date is rather mixed. For instance, while Borjas (2003) 3 finds negative effects of immigration on the wages of natives in the US, others find that the impact of immigration, if any, is negligible (Card, 1990, 2001) 4,5. More recently, Ottaviano and Peri (2012) 6document immigration as having a positive effect on the wages of high-skilled natives, and a negative effect on low-skilled natives. A longitudinal study in the UK finds minor impacts on unemployment, participation and wages – both economically and statistically (Dustmann et al., 2005) 7. Conversely, Manacorda et al. (2012) 8 find that since immigrants and natives are complements in production, there is no negative wage effect on the latter. However, the authors also find evidence that newly-arrived immigrants are substitutes in production with immigrants already residing in the UK. Analyzing the impact of immigration on the employment rates of native Germans, Pischke and Velling (1997) 9 find that immigration does not adversely impact natives’ employment. More recently, D’Amuri et al. (2010) 10 analyze both the wage and employment effects of immigration in West Germany, finding that immigration has essentially no impact on natives’ labor market outcomes, but has an adverse effect on previous immigrants.

Another strand of the literature has explored the impact of immigration on other outcomes while still using objective measures of welfare. For example, Dustmann et al. (2010) 11 analyze whether the immigration stemming from the EU enlargement toward Eastern Euro- pean countries affected UK public finances. They find that immigrants from the accession countries positively contributed to public finances, since they were found relatively more likely to be in work than natives, and less likely to access social benefits.

Finally a branch of the literature has started to explore the relationship between immigration and natives’ attitudes. For example, Card et al. (2005) 12 analyze European Social Survey data and conclude that while attitudes towards immigrants are partially shaped by economic factors, other aspects such as culture, and natives’ social status are important in affecting the way in which immigration is perceived. Moreover, Boeri (2010) 13 argues that the business cycle influences natives’ opinions towards immigrants. Other studies investigate the determinants of attitudes toward immigrants 14.

Methods

  1. The individual-level data of subjective well-being (SWB) variable is derived from responses of the question “Are you satisfied or dissatisfied with your standard of living?” in the Gallup Healthways Survey, which allows responses on an ordinal scale from 0 to 100.
  2. Gather state-level data on immigrant population through the demographic online research tool Social Explorer.
  3. Extract state-level data on local unemployment rates and the median household income levels through the Social Explorer online tool.
  4. Aggregate all the datasets into the the state-level data, and compile them for the same year.
  5. Construct a multiple linear regression model by using Stata.

Data Analysis

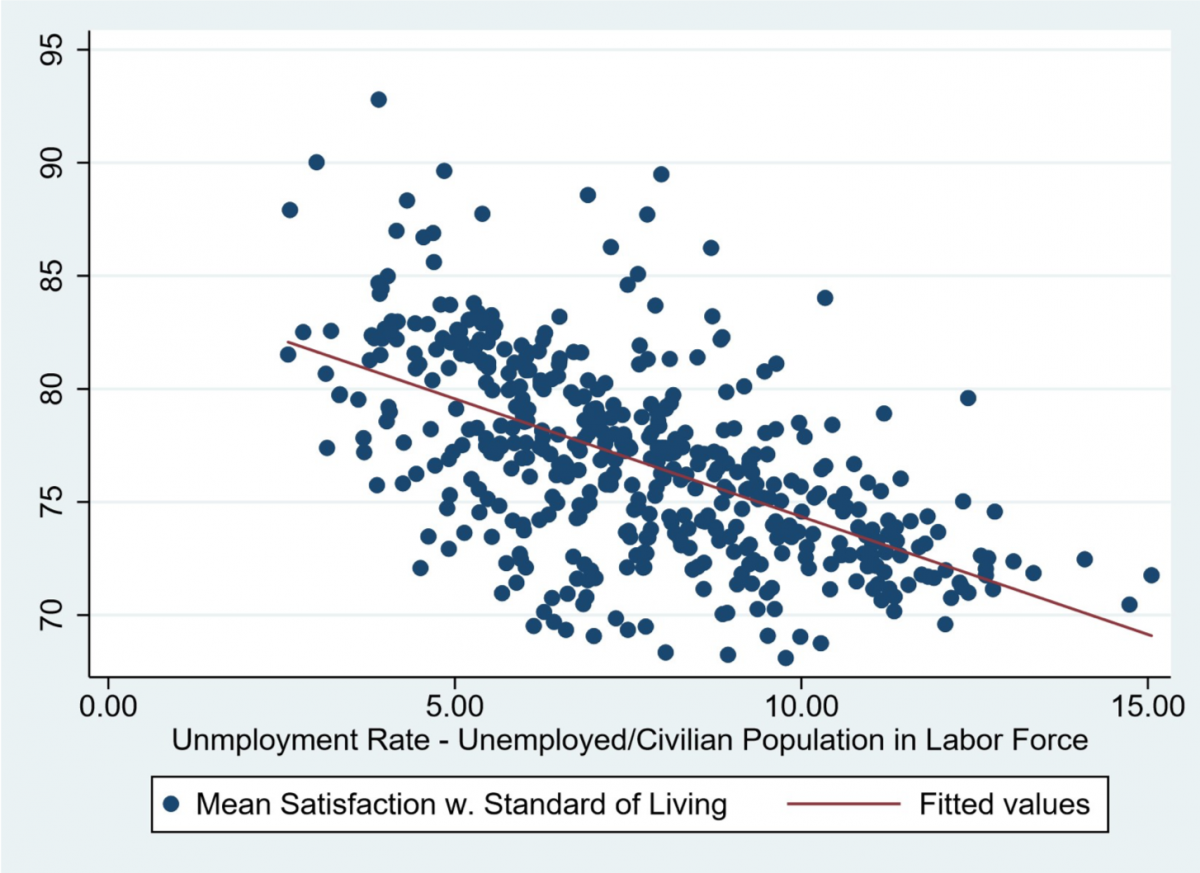
Figure 1. The scatterplot of the SWB index regressed against the unemployment rate in all U.S. states.

The negative slope coefficient of -0.851 and the significantly low p-value indicate that the percentage of unemployment is negatively associated with the subjective well-being.

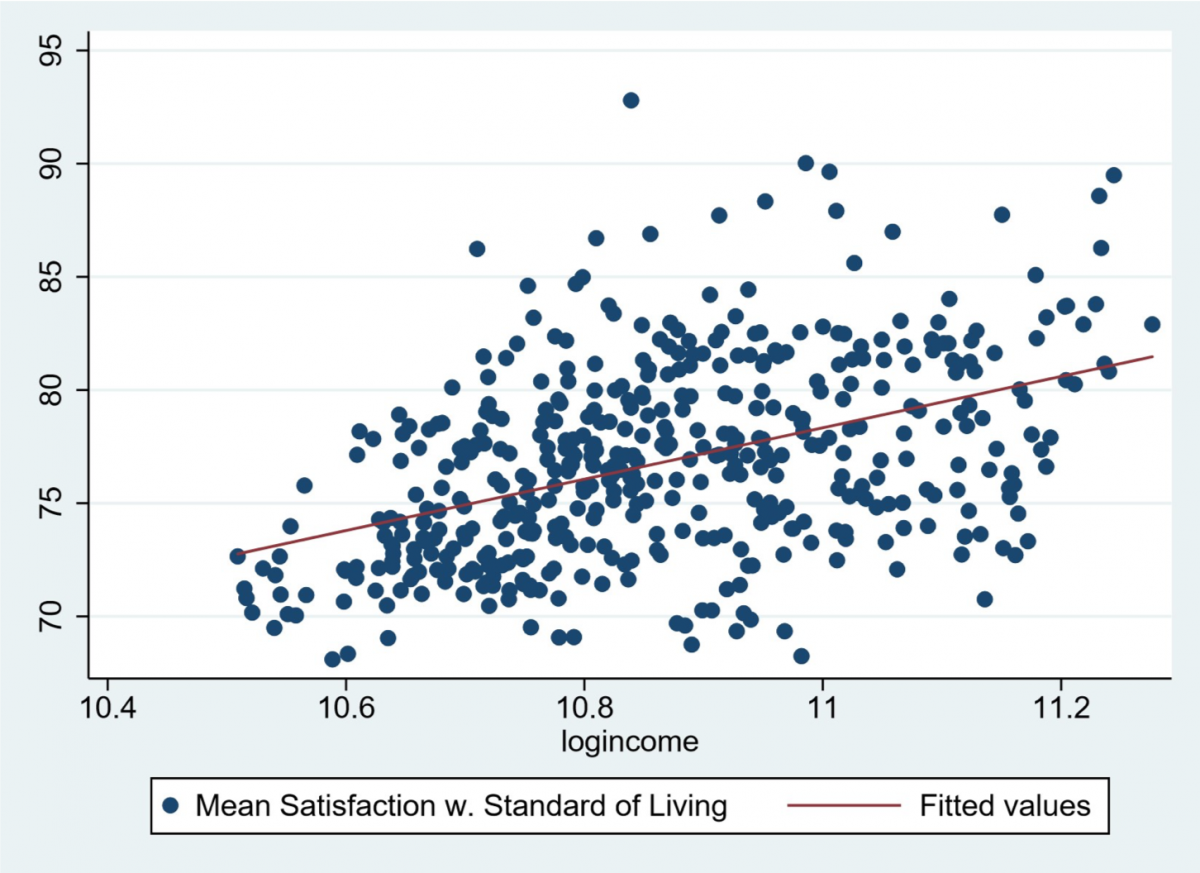
Figure 2. The scatterplot of the SWB index regressed against the logarithm of income in all U.S. states.

The significantly low p-value for the t test implies there is a linear relationship between the income level and the subjective well-being. Moreover, the positive slope coefficient 8.445 suggests that as income levels increase, the subjective well-being levels also rise.

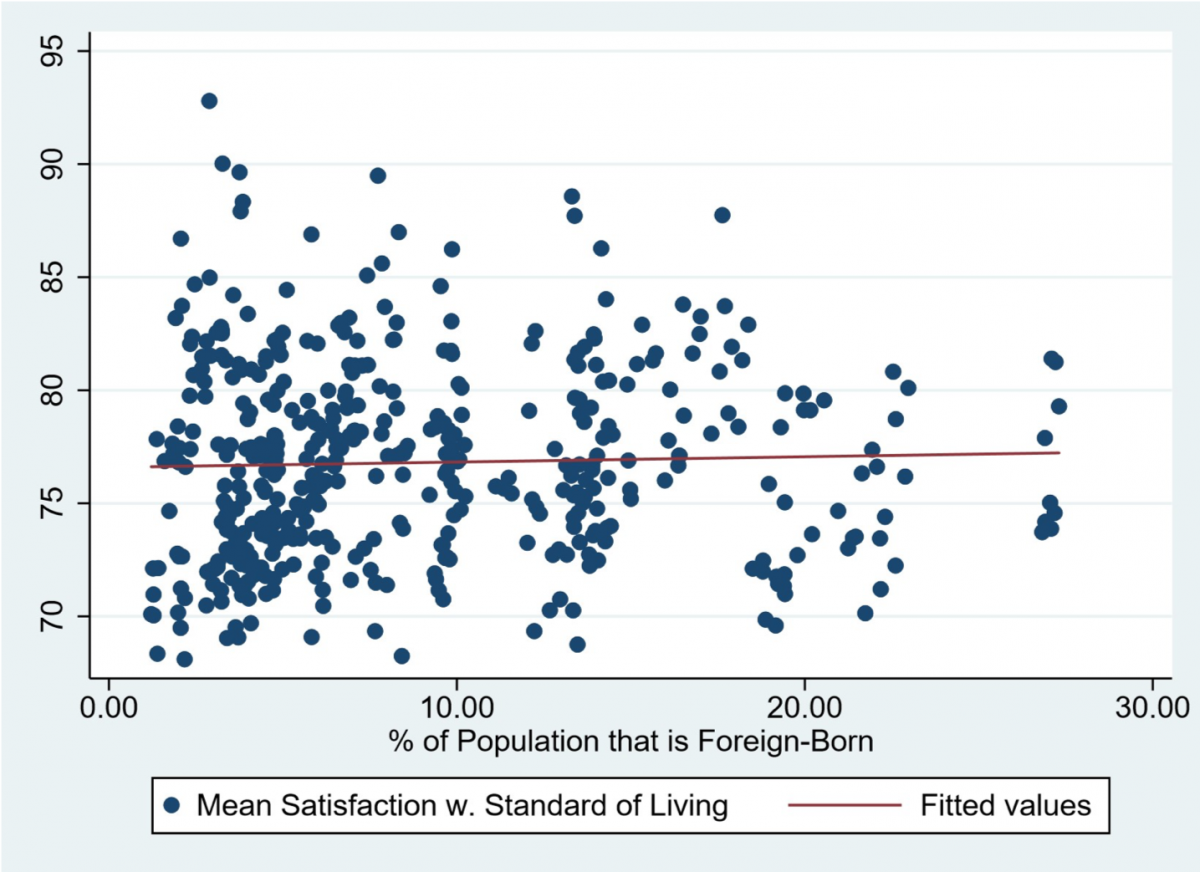
Figure 3. The scatterplot of the SWB index regressed against the immigrant population proportion in all U.S. states.

The slope coefficient -0.029 and the p-value of 0.41 indicates that there is insufficient evidence to reject the null hypothesis that there is no linear relationship between immigration population proportion and the subjective well-being, controlling for income level and unemployment rate.  

The multiple linear regression model of the subjective well-being of U.S. natives provides evidence that immigration generates no significant effect on natives’ subjective well-being (SWB), which is consistent with findings of study by D’Amuri et al. (2010). In fact, the subjective well-being levels of U.S. natives are predominately determined by local income level and the percentage of unemployment.


References:

  1. Sudhinaraset, May, et al.“The influence of deferred action for childhood arrivals on undocumented Asian and Pacific Islander young adults: through a social determinants of health lens.” Journal of Adolescent Health 60.6 (2017): 741-746.
  2. Case, Anne, and Angus Deaton. “Suicide, Age, and Wellbeing: an Empirical Investigation.” Suicide, Age, and Wellbeing: an Empirical Investigation, June 2015, pp. 2–43., doi:10.3386/w21279.
  3. Borjas, G. (2003). The labor demand curve is downward sloping: Reexamining the impact of immigration on the labor market. Quarterly Journal of Economics 118(4), 1335–1374.

  4. Card, D. (1990). The impact of the mariel boatlift on the Miami labor market. Industrial and Labor Relations Review 43(2), 245–257.
  5. Card, D. (2001). Immigrant inflows, native outflows, and the local labor market impacts of higher immigration. Journal of Labor Economics 19 (1), 22–64.
  6. Ottaviano, G. and G. Peri (2012). Rethinking the e↵ects of immigration on wages. Journal of the European Economic Association 10 (1), 152–197.
  7. Dustmann, C., F. Fabbri, and I. Preston (2005). The impact of immigration on the British labour market. Economic Journal 115(507), F324–F341.
  8. Manacorda, M., A. Manning, and J. Wadsworth (2012). The impact of immigration on the structure of wages: Theory and evidence from Britain. Journal of the European Economic Association 10(1), 120–151.
  9. Pischke, J. and J. Velling (1997). Employment e↵ects of immigration to Germany: An analysis based on local labor markets. Review of Economics and Statistics 79(4), 594– 604.
  10. D’Amuri, F., G. Ottaviano, and G. Peri (2010). The labor market impact of immigration in Western Germany in the 1990s. European Economic Review 54 (4), 550–570.
  11. Dustmann, C., T. Frattini, and C. Halls (2010). Assessing the fiscal costs and benefits of A8 migration to the UK. Fiscal Studies 31 (1), 1–41.
  12. Card, D. (2005). Is the new immigration really so bad? The Economic Journal 115(507), F300–F323.
  13. Boeri, T. (2010). Immigration to the land of redistribution. Economica 77(308), 651–687. 

  14.  Akay, Alpaslan, Amelie Constant, and Corrado Giulietti. “The impact of immigration on the well-being of natives.” Journal of economic Behavior & organization 103 (2014): 72-92.

Research Update

The following post will describe an update on my project to someone outside of academia. I am currently analyzing a channel located within the mitochondria. The channel is called the Mitochondrial Calcium Uniporter (MCU). MCU is highly selective to Calcium and only allows passage of calcium into the mitochondria.

My lab is studying this specific selectivity for calcium in hopes to better understand the MCU functionality and find better ways to regulate such a channel. Currently, we have identified a subunit located on the MCU called MCUb. It has been proven that over expression of this subunit prohibits the flow of calcium through the channel. However, upon further examination, we discovered that there are few regions between the two that are different. The regions in which we are analyzing is called the motif regions. These regions are the ones lining the inside of the channel and the ones responsible for the high calcium selectivity.

Currently, we are creating mutations of the MCU based upon the differences of the motif regions. These mutations are specifically designed to aid us in narrowing down the specific changes and modifications that result in the changes that we see between MCU and MCUb. To analyze these changes we manually add calcium sensitive fluorescence into the mitochondria. With this fluorescence we are able to track the intake of calcium into the mitochondria through the MCU by measuring the increase of  intensity of fluorescence over time. Through calculations and analysis, we can use our data to directly calculate intake of calcium for different mutations our lab creates.

I have currently examined 4 cell lines each with a different mutation. We are still analyzing the results, but we have seen some positive data indicating that these mutations are causing alterations to how calcium is entering the mitochondria.

With time, I hope to finish up the data analysis and continue to image more cell lines with mutations. One major bottleneck that my project is experiencing is the creation of the mentioned mutated cell lines. Creating stable cell lines with the specific mutations that we desire takes a considerable amount of time and we are currently working on creating as many cell lines as possible so that we can get a wide range of mutations to test. However, we hope to have enough mutations that we can narrow down the specifics of how we can better regulate the Mitochondrial Calcium Uniporter.

My research for someone outside of academia

Hello,

My research is about trying to evaluate whether the international community has made a difference in improving human rights status in countries that have grave human rights violations such as genocide, gratuitous killing, disappearance, and torture. Evidently, different regions have a different vulnerability to different violations.  For example, American countries, with their ethnic diversity, is more prone to genocide; while Middle East countries are more vulnerable to torture and honor killing due to religious conservatism. Therefore, it would not be sufficient to look at various human rights enforcement mechanisms on a global scale. Rather, my study aim at discovering which mechanism is the most effective against which type of violation in what region.

There are several types of enforcement the international community (NGOs, IGOs, states, individuals, etc.) could utilize to induce state c compliance with various human rights treaties to which the perpetrator state is a member. The international community could “name and shame” a state for violating human rights, namely, calling them out and imposing a reputation cost to that country. The reputational cost can later translate into the loss of foreign aid, foreign direct investment, and/or partnership in certain cooperations. The international community could also punish the perpetrator state using economic means. This is called trade linkage. A country could put human rights clauses in a bilateral trade agreement or threaten to impose economic sanction should a state violates human rights, thereby incentivizing states to comply with human rights protection to which they have already agreed under the Universal Declaration of Human Rights (UDHR). In addition, under certain circumstances, states could even resort to military actions under the doctrine of the “responsibility to protect” (R2P) to stop ongoing violations. This is permissible due to the international consensus that a state which deliberately violates human rights is not considered a legitimate state. Military actions for humanitarian purposes are called humanitarian intervention which has been used to save the indigenous population for massive ethnic cleansing before.

The difficult part of my study is how to accurately measure the state’s sensibility to which type of enforcement and what are the factors that I need to control so that I would know what is the true variable that is constituting the observed effect. When doing the comparison, I make sure that I hold the following variables in the countries constant: the population, the ethnic diversity, the history of authoritarian rule, past conflicts, and the agriculture history. These measures will be collected and synthesized into what I call a “sensitivity index ”that would evaluate the country’s overall sensitivity to which type of enforcement for which violation.

Should I find anything statistically and meaningfully significant, my study will contribute to existing literature on state compliance with human rights treaties. Political scientists can use this information to better inform governments or human rights organizations to come up with more effective strategies to protect human rights.