Carbon Monoxide Inhibition of Hydrogenase
Efficient energy production is important in today’s world where the stock of fossil fuel is limited and global warming is bringing devastating effects in certain parts of the world. There are many potential solutions to the energy crisis, solar and nuclear generators being the most well-known. However, there is another potential mechanism that can produce energy in high turnover rates that emits little to no CO2.
Hydrogenases catalyze the reversible 2H+ + 2e- —> H2 reaction in its active site. However, the active site can be inhibited by carbon monoxide (CO) which halts the catalysis of the reaction. By studying the mechanism of how CO diffuses into the active site of hydrogenase, scientists could potentially synthesize “mimic” proteins that have little inhibition, high turnover rates of products, and are compatible with other molecules that are used in industrial production, thus producing energy efficiently (this is only one of many potential applications).
In order to study the inhibition mechanism, first I will be synthesizing a caged CO manganese complex– a manganese complex which contains carbon monoxide. I will put this into a solution with myoglobin and shine light at a specific wavelength to excise the CO from the manganese complex and watch it diffuse into the active site of myoglobin through kinetics tracing*. If the CO successfully diffuses into the myoglobin active site, I will go on to perform this experiment with hydrogenase. I will test it with myoglobin first because myoglobin is much smaller than hydrogenase and if the CO fails to diffuse into the smaller myoglobin, it will have no chance of diffusing into the hydrogenase. This will allow me to use myoglobin in lieu of hydrogenase which our lab has to obtain from the University of Georgia.
Prior to doing this experiment, we must synthesize the manganese complex. To do this, we have to synthesize the Tris(pyrazol-2-yl) methane ligand which is a major component of the manganese complex. We will be starting the synthesis process soon.
I am looking forward to doing my first project with the help of my graduate mentor Greg. I am eager to share the results in our poster presentations at the end of the year!
*Kinetics tracing is a method of monitoring the electron distribution in the hydrogenase active site upon CO binding. The hydrogenase changes conformation, which in turn changes the electron distribution.
Environmentally-Friendly Energy
About Myself
My name is Eric Park and I am a second-year student studying in Emory College. I am undecided, but am highly considering applying to medical school.
My Lab and Research
I am working in Dr. Dyer’s lab, specifically with my graduate mentor Greg. Greg is a third-year student studying inorganic/physical chemistry. Our research is on understanding the mechanism of hydrogen bonds in metalloenzymes—enzymes that contain a metal ion—and produce “mimic” enzymes to utilize the bond energies as an environmentally-friendly and cost efficient energy source. We also focus on the 2H+ + 2e- –> H2 reaction and study how nature efficiently carries out this reaction.
First Lab
I went in the lab for the first time on September 30th, 2017 and Greg taught me how to analyze absorption rates using a UV-Vis spectrometer. Absorption rate is the percentage of light a solution absorbs as a specific wavelength of light is shined through it. Using the equation **A= E*c*l (A= absorption, E= extinction coefficient, c= concentration, l= path length) and the absorption rate that was collected from the UV-Vis spectrometer, we can calculate the extinction coefficient—a specific absorption rate value unique for every substance. In this particular experiment, I used a diluted myoglobin solution as the subject of study.
**As concentration of the solution increases, the less light is able to shine through. This is self-explanatory by using every day examples. The more nestle chocolate milk powder you put in water, the darker the solution gets and the lesser amount of light is able to pass through. For the path length, light is less able to pass through a full tank of dark chocolate milk than a small glass of chocolate milk.
Second Lab
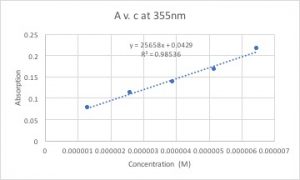
On October 3rd, 2017 I repeated the same experiment but with dithyanide mixed to the myoglobin solution. Dithyanide has two electrons that can reduce other molecules, therefore it can reduce two myoglobin molecules. This reduction of myoglobin changes the conformation of the ligands– anything attached to the myoglobin– and puts the electrons in a lower energy state. Since a lower energy state is equivalent to a higher wavelength, the absorption peak appeared at a higher wavelength (I will add figures later when they become available). In addition, we can calculate the extinction coefficient by graphing A v. c and calculating the slope of the trend line. Here is a sample graph where I graphed A v. c for the dithyanide + myglobin solution:

On the y-axis is the absorption rate and on the x-axis is the concentration of the solution. It is evident in the graph that the concentration and the absorption rate are proportional to each other. The slope of the trend line would be the value of the extinction coefficient because if you manipulate the equation A=E*c*l to E= A/(c*l) you can see that the absorption rate divided by the concentration gives the value of the extinction coefficient (the path length is 1 we can disregard it).
What I plan to do…
For the next couple months, I plan on learning more lab techniques and reading journals. I do not think I will actually get involved in Greg’s research until late spring to early summer. Until then, I plan on learning all the lab techniques that are required to assist Greg in his research.

