Over the past couple of weeks, I have been facing my ultimate nemesis in my project, confocal microscopy. Confocal microscopy is a microscope that is able to measure fluorescence (light) from a fluorescent dye (light inducing). In the beginning, I thought it was going to be an easy task, but I was deeply mistaken. It has taken my a total of 5 weeks to master the microscope and to produce usable data for my project. The main hurdle that I encountered was learning to permeabilized my cells. This was a crucial step because it was going to yield accurate and useful data. If I didn’t master this, my whole project would come falling down.
According to my professor, cell permeabilization is a “dark art”. For the past 5 weeks, I have been perfecting the art of permeabilizing cells. Cell permeabilization is when we use a detergent solution to break down the cellular membrane that surrounds the cells. However, we don’t want to break down the entire membrane, because the cell components would literally spill out everywhere. To have usable cells, we have to correctly time the permeabilization so that the detergent solution leaves tiny holes throughout the membrane of the cell.
The tiny holes serve two purposes. Firstly, they allow excess dye to leave the cytosol or inner fluid of the cell. In my experiment, we were using Rhodamine 2-AM dye. This is a dye that is sensitive to calcium concentrations and will intensify when calcium is present. When staining the cell, the dye goes everywhere inside the cell. However we only want the dye inside the mitochondria because we want to measure the influx of calcium inside of the mitochondria. By creating tiny holes, we can force out the unnecessary dye that is surrounding the exterior of the mitochondria.
Secondly, the tiny holes allow the uptake of calcium to occur at a more reasonable rate. Without the permeabilization the calcium uptake would take minutes. With the permeabilization, the calcium uptake occurs in seconds, which allows us to produce many assays in one sitting.
Knowing when a cell is permeabilized was a huge challenge for me, because I had no idea what would a permeabilized cell looked like. On top of that, each cell line had different permeabilization time that was very inconsistent and would change every single time. With practice and much time, I was able to recognize and identify the signs of successful permeabilization.
From what i achieved, a successful permeabilization will result in a grainy texture of the cell fluid that surrounds the nucleus. The grainy texture is in fact small bubbles that are a result of the break down of the cell membrane. Once we reach this stage, the permeabilization has just begun. To make sure that it is the correct amount permeabilization, the bubbles will increase in size and become even more grainy. Eventually, there comes a point where the bubbles are just the right size so that it will not destroy the membrane and it’s big enough to allow dye to flow out and calcium to flow in. This point is up to the discretion of the researcher. There is not a justified size to the bubbles, but after many practice rounds, there is a preferred size for each researcher every time.
Once I accomplished the skill of permeabilization, I was able to gather data. The way we gathered data was to start the laser recording, and during the recording, we would add a measured calcium solution directly onto the cells. After, we would watch what happened to the intensity of the dye. An increasing intensity would result in a higher influx of calcium. This is what we are looking for when we analyze the recording, because it means the cell is working and the mitochondria is doing its job.
For the most part, the results have been extremely good, but I am still collecting data at this time. It has taken many hours of hard work and dedication to reach this point, but both my mentor and I agree that from this point, things will be picking up at an increasingly fast pace. From this experience, I learned never to underestimate the easy things because sometimes there the ones that are standing in your way.
My name is Olivia Lofton and I’m a sophomore from Newnan, Georgia. I’m currently majoring in economics and minoring in applied mathematics. I plan to go to graduate school to pursue my PhD in economics. I’m primarily interested in public policy and economic development. I’m currently assisting Dr. DePasquale with her research in health economics.
Where My Research Stands
Dr. DePasquale’s research is centered in health economics as well as sports economics. For the initial stage of my assistantship, I will help Dr. DePasquale in wrapping up some of her own health economics papers, while simultaneously studying her research and noting particular elements that interest me. Once I piece these elements together and have a more complete idea of what I would like to research, Dr. DePasquale will help me in customizing a more independent research project.
Hospital Mergers vs. System Joiners
As of right now, the economic literature on mergers, as well as the two government agencies that primarily monitor mergers, the Federal Trade Commission and the Department of Justice, treat horizontal mergers and system joiners as one in the same.
To clarify, the American Hospital Association defines a merged hospital as one hospital fully merged from two previously independent hospitals, and which now operates under one license. A system joiner, on the other hand, is much less precise, and includes the joining of any individual hospital to a larger hospital system.
Dr. DePasquale studied how labor, admissions, costs, and treatments (surgical operations, ICU beds, etc.) changed in response to a merger versus a joiner. The results yielded significant differences for nearly all outcomes depending on whether a merger or a joiner had taken place. Such a disparity in economic consequences led Dr. DePasquale to believe that she should argue that horizontal mergers and system joiners should be treated differently within both policy and economic literature.
I will aid Dr. DePasquale by researching merger law in aims of answering the following questions:
How frequently are the FTC and DOJ merger guidelines updated?
Do these guidelines differ for horizontal mergers versus vertical mergers?
What financial amount signifies that a merger needs to be reported?
If the FTC and DOJ can’t review all mergers, which ones are more likely to be reviewed by the FTC versus the DOJ?
What defines a merger?
Are there any other significant differences between FTC and DOJ guidelines?
The answers to the question will help Dr. DePasquale to draft a compelling argument in regard to the handling of mergers and joiners.
My name is Camille Steger, and I’m a fourth year studying Quantitative Science with a concentration in Neurobiology at Emory College. Upon graduating, I plan to attend medical school.
Lab History
I’ve been working with Dr. Kelly Bijanki, a faculty member in the psychiatry department of the medical school for two years now. Her research focus is in the effects of clinical deep brain stimulation. She works in two different labs as the neuroimaging specialist- the first is Dr. Willie’s Behavioral Neuromodulation lab; Dr. Willie is a neurosurgeon who works in the Epilepsy clinic at the Emory hospital. Long story short: depth electrodes have to be implanted into the brains of patients with serious epilepsy so doctors can locate the seizure focal region- the part of the brain producing the seizures. Although these electrodes are present as a means to help the patients, they also provide an opportunity for clinical research. In Dr. Willie’s lab, Dr. Bijanki and other researchers have developed paradigms to explore the effects of electrical stimulation on different brain regions that have applications in many different fields, including memory and emotional reactivity, extinction learning and fear, cataplexy, and recently, even in mirth and analgesia.
When I first started working with Dr. Bijanki, my role was mainly to analyze and preprocess autonomics data from an experiment that we call the Startle Paradigm. In this paradigm, we had patients listen to a series of loud white noise bursts while tracking their autonomic responses- heart rate, respiration rate, and skin conductance (sweatiness of the palms)- with and without electrical stimulation to the amygdala, which is a part of the brain known to be involved in emotion, and specifically fear. However, after the analysis of the bulk of this data, we found that there was little to no effect caused by the stimulation using this paradigm. It has since evolved into a more complex amygdala study called the Fear Extinction Paradigm. This is a project that is still in the works, so I’m not going to divulge any specifics other than its purpose is to show that amygdala stimulation can play a role in a heightened ability to unlearn a fearful stimulus – which has major applications in PTSD.
The second lab that Dr. Bijanki works in is called the Mayberg lab. They are also in the psychiatry department at Emory’s medical school; however, their focus is a little different: depression. In the Mayberg lab, electrodes are surgically implanted into the cingulum bundle of patients with serious, long-term depression. The cingulum is a white matter tract in the medial part of the cerebrum, located immediately above the corpus callosum. Stimulation to the cingulum has been shown to significantly improve symptoms for patients suffering from clinical depression.
A major problem in psychiatry, and therefore, in determining the effects of deep brain stimulation, is how to quantify a patient’s subjective attitudes, like how depressed they’re feeling, for example. Direct measures, such as surveys, are the most commonly used way to quantify attitudes in psychology, but there is debate over whether direct measures can be trusted due to the social bias that accompanies them. This makes indirect ways of quantifying attitude a more appealing option, but how can something as subjective as mood be measured without explicitly asking a patient?
During her post-doc at Iowa, Dr. Bijanki helped develop an indirect measure method called affective bias. Affective bias is a method used to quantify a patients’ overall mood, and has been shown to significantly correlate to depression rating. During affective bias, a patient looks at a block of sad faces, and rates each one of a scale of 0 to 100. Each face mathematically mirrors an exact percentage of sad to neutral, meaning each face has an expected value for its rating. The same is done for happy faces. Patients with depression have been shown to rate faces in the sad block at a lower value (even sadder) than their expected value. This is one of the ways the Mayberg lab quantifies their patients’ depression.
My Current Project
During experimentation on one of the patients in Dr. Willie’s lab, who happened to have electrodes in her cingulum bundle (the same region the Mayberg lab uses), stimulation to this brain region elicited a significant mirth response. This has prompted a greater interest in the affects of stimulation to this area, and my project seeks to quantify the behavioral effects of stimulating this region of the brain. How can we scientifically prove that stimulation to a brain region produces a feeling and manifestation of mirth in our patients?
For my project, I will be helping to analyze the patients’ changes in facial movements during the affective bias task in an attempt to quantify behavioral responses during stimulation. The affective bias task is used on patients in both Dr. Willie’s lab and in the Mayberg lab and video recordings of all testing is kept by both labs, which gives us a huge amount of data to analyze. Sahar, a graduate student in the Mayberg lab, has already written a script in matlab that takes these videos and analyzes block by block changes in the patient’s facial movements. Her script produces a similarity matrix of values between 0 and 1 that quantifies differences and similarities in the patient’s facial movements in each of the blocks. My role will be to assist with the interpretation of the data, as well as guide the production of the final figure that will capture our findings. Furthermore, we hope to use the findings to inform our knowledge of the minor differences in the placement of electrodes within the cingulum bundle.
Recent Updates
At the latest meeting with Dr. Bijanki, we discussed one of my first assignments for the project. Although we have already begun our analysis on the facial movements in one patient in Dr. Willie’s lab, there will be some down time before we will be able to collaborate with Sahar and other members in the Mayberg lab and begin the bulk of the analysis on the project. In the meantime, Dr. Bijanki and I discussed my role in processing the huge amount of affective bias data from the Mayberg lab. The affective bias task produces a matlab file containing a matrix of data: each row representing the face that the patient was shown, and a series of columns containing the information about the face and the patient’s rating of that face. My goal is to write a script in matlab, R, or python that is able to compile these matlab matrices into a single database that can be used by Dr. Bijanki and the other researchers to analyze the data more quickly.
As another side project, she asked me to begin reading through past research relating to a psychological phenomena called facial feedback hypothesis. Facial feedback hypothesis states facial movement influences emotional experience. This ties into my project because the videos we will be analyzing not only seek to quantify the effect of stimulation, but also the effect of looking at a happy or sad face during the affective bias task. If we take the facial feedback theory into account, we would expect a patient’s face to mimic the face they are looking at during the task in an attempt to internalize and understand the emotion of the face they are being shown. The background reading I plan to do on this topic will shape the presentation of our findings when introducing our research during talks or even in articles.
My name is Danial Arslan and I am a sophomore at Emory University who is planning to pursue a (BS) degree in Biophysics and a (BS/MS) degree in Pure Mathematics. I am pre-med and am planning to later pursue the MD degree.
Introduction:
I will be working in Robert Liu’s lab at the Rollins Research Center.
Robert Liu runs a Computational Neuroethology lab which delves into the neural processes which are responsible for how an organism behaves. This includes studying how new neural connections form during social cues which can then later transform into behaviours for specific cues in organisms.
The lab also notes how neural plasticity can be regulated through manipulating neural mechanisms present in the ‘reward system’ of the brain. They are currently investigating specific topics within this broad research question. This includes understanding how female mice develop the ability to recognize their pups, through their offspring’s ultrasonic vocalizations. Moreover, the lab is also interested in exploring the social behaviours exhibited by prairie voles.
The lab is currently starting a new study into the electrophysiological mechanisms of social bonding in prairie voles, which is what I will be working on.
Overview of what the lab is working on now:
Adopted from the following paper: Amadei, Elizabeth A., et al. “Dynamic corticostriatal activity biases social bonding in monogamous female prairie voles.” Nature (2017). This paper can be accessed by clicking here.
“The vole is closely related to the lemming and resembles a hamster.”1
Image adopted from: (Joel Sartore / National Geographic Creative)
The formation of monogamous relationships is not only complex but rare, with only 5% of current mammalian species actually demonstrating such ‘pair bonds’. These bonds are created when organisms undergo a series of biochemical and neurological changes which cause them to perceive their partners as ‘rewarding.’ However, there is still speculation as to how these neural mechanisms are formed during social interactions with partners.
In this paper, it is hypothesized that this rewarding mechanism is created through an increase in corticostriatal activity between the neural accumbens (NAcc) and the medial prefrontal cortex (mPFC). Corticostriatal circuitry plays a key role in creating motivation and forming goal oriented and reward seeking behaviours in organisms.2 The authors of this paper therefore hypothesize that greater connectivity between the NAcc and the mPFC will result in an organism demonstrating more affiliative behaviours towards their mates.
The authors use a female prairie vole (Microtus ochrogaster) as their experimental model, to demonstrate social bonding. Prairie voles are extremely monogamous in nature and extremely affiliative, with males staying with their female mates and spending approximately half of their time in the nest with their pups.3
Individual variation in corticostriatal activity and the number of receptors for dopamine and oxytocin in the corticostriatal circuitry was shown to predict differences in affiliative behaviour. This was measured, in this experiment, by observing how quickly females would huddle with their partners after cohabitation.
Furthermore, activating this mPFC–NAcc circuit, during social scenarios with a specific mate, caused females to exhibit a preference for their mate. This showed that the corticostriatal activity was also responsible for escalating the affiliative behaviour. Therefore, this experiment showed how corticostriatal activity, during pair bond formation, could use the brain’s reward system to cause an increase in affiliative behaviour.
Where am I in the Research Process and Future Plans:
A timeline outlining my goals for the coming year, in my research space.
I currently just joined the lab this week and have yet to go over previous articles the lab has published to get a sense of where they are now and where they are heading. I will be meeting up with my graduate fellow next week and will be working under him for the first semester. This will include going over various papers, related to this study, to become more knowledgeable in the field. Moreover, I will be working under his project in order to learn basic lab procedures, tests and techniques.
By January, I will be starting my own independent study, within this main research goal, with the hopes that by March I have at least some preliminary data which I can include in my scientific poster.
References:
Tucker, Abigail. “What Can Rodents Tell Us About Why Humans Love?” Smithsonian.com. Smithsonian Institution, 01 Feb. 2014. Web.
Haber, Suzanne N. “Corticostriatal Circuitry.” Dialogues in Clinical Neuroscience 18.1 (2016): 7–21. Print.
McGraw, Lisa A., and Larry J. Young. “The Prairie Vole: An Emerging Model Organism for Understanding the Social Brain.” Trends in neurosciences 33.2 (2010): 103. PMC.
Amadei, Elizabeth A., et al. “Dynamic corticostriatal activity biases social bonding in monogamous female prairie voles.” Nature (2017).
My name is Yining Feng and I am a junior majored in Economics in the Emory College. I am also minored in Predictive Health, and I have been a pre-med student for 2 years at the Oxford College of Emory University. I am considering pursuing the dgree of doctor of dental surgery (DDS) or a master of business administration (MBA). If there is a joint degree program DDS/MBA avaible, then I am planning on pursuing both degrees simultaneously.
My Research
I am currently assisting Dr. Jeong Ho Kim with his research project on the Measuring Mutual Funds skills, with a particular focus of the Chinese Mutual Funds Market. The research project is devised to study the assest management industry, and research the industrial organization implications of trend chasing by mutual fund investors. The economics term mutual fund refers to an investment company that brings together money from many investors and invests it in stocks, bonds or other assets.1 The combined holdings of these underlying assets the fund owns are known as its portfolio. Each investor in the fund owns shares, which represent a part of these holdings. 1 My tasks during the first stage of the research include reviewing related literature, collecting organizing, and cleaning data about Chinese Mutual Funds Market from the Wharton Research Data Services (WRDS) website. I have learnt and enhanced my skill of using Stata or R software for data cleaning throughout this process. In the second stage of the research, I am expected to run regressions and estimate models for the data of Mutual Funds.
What has previous research shown?
The data collected by Citibank in 2012 suggest that 28% of China’s financial assets under management (AUM) are held in mutual funds (Exhibit 1). The Chinese Mutual Funds Market is still under the developing stage due to the lack of market participation of Chinese people with huge amounts of saving. 2 Nevertheless, the Chinese assest management industry still displays a bright future because of the increasing interest from outside the industry both from foreign financial firms and large domestic corporations as passive investors. 2 The distribution structure of the Chinese market emphasizes the culture of short-term trading. The tendency of short-term mentality among Chinese investors leads to a significantly different business model for the Chinese fund industry compared with the American industry. While U.S. investment managers have carefully considered fund launches, the Chinese industry has constantly created new funds since 2010. 3
Current Outlook of the Chinese Mutual Funds Market
The Chinese economy has maintained a stable growth since 2014, as evidenced by the constant GDP annual growth rate around 7% (Exhibit 2). The steady growth of the economy is attributed to an industrial sector recovery, strong credit growth, fast-growing information technology sector and a booming real estate sector.4
Exhibit 2: China GDP Annual Growth Rate (July 2014-July 2017)
Overall, the output of services has accounted for more than half of the Chinese economy since 2015. The 2017 report by the National Bureau of Statistics suggests that commercial leasing, transportation and storage, as well as the information technology sectors together account for the biggest source of Chinese economic growth. The 19.2% growth rate of the information technology sector is ranked the highest during the 1st quarter of 2017; the 8.8% growth rate of the transportation and storage sector is preceded by the second highest growth rate of 10.1% in the leasing and commercial services sector; the growth rate of the real estate sector also reached 7.9%; both the lodging & catering sector and the retail and wholesale sector rose 7.4% at the fastest pace ever since 2014 (Exhibit 3).4
Exhibit 3: The First-quarter Growth Rate of Chinese Service Sectors in 2017
Data Collection and Cleaning
There are three basic types of mutual funds including equity funds that invest in stocks, fixed-income funds that invest in bonds, balanced funds that invest in both stocks and bonds, and money market funds that seek the risk-free rate.5 The data cleaning process began with identifying duplicates based on specific characteristics for distinguishing between variable subsets.The duplicates report generated by the Stata software showed that there were in total 185 unique mutual funds with complete investment concentration data available since 1998. During the sample selection and information processing procedures, invalid data were excluded from the analysis. The historical data, including data on value-weighted stock index monthly returns and investment concentration, were obtained from the WRDS database.
Stata Duplicate Report Example
(1) Use the data from File 1 “Funds Main Info” and base the duplicate count solely on the variable “Fund ID“. Start by running the duplicates report command to see the number of duplicate rows in the dataset. This is followed by duplicate reports id, which gives the number of replicate rows by the variables specified; in this instance we have just “fundid”. We could have used the duplicates examples command instead of the duplicates report command. The duplicates examples command lists one example of each duplicated set.
use "C:\Users\jkim230\Dropbox\Data\csmar\fund_maininfo.dta", clear
(2) Use the data from File 2 “Fund Unit Class Info” and base the duplicate count solely on the variable “Fund Class ID“. The subsequent procedure is the same as step (1).
use "C:\Users\jkim230\Dropbox\Data\csmar\fund_unitclassinfo.dta", clear
by fundclassid fundid, sort: gen nvals = _n==1 by fundclassid: replace nvals = sum(nvals) by fundclassid: replace nvals = nvals[_N]
su nvals * * Variable | Obs Mean Std. Dev. Min Max -----------+----------------------------------------------------- * nvals | 3,120 1 0 1 1 ***************************************************************** use "C:\Users\jkim230\Dropbox\Data\csmar\fund_maininfo.dta", clear
(3) Merge the mutual funds data from File 1 with that of File 2. Merge is for adding new variables from a second dataset to existing observations. Perform the command of one-to-many merge on specified key variables.
merge 1:m fundid using "C:\Users\jkim230\Dropbox\Data\csmar\fund_unitclassinfo.dta" * * Result # of obs. * --------------------------------------------------------------- * not matched 819 * from master 0 (_merge==1) * from using 819 (_merge==2) * * matched 2,301 (_merge==3) * ---------------------------------------------------------------
save "C:\Users\jkim230\Dropbox\Data\csmar\asdf.dta", replace ***************************************************************** use "C:\Users\jkim230\Dropbox\Data\csmar\fund_promoter.dta", clear
(4) The command duplicates report of the merged file shows that there are 185 unique fundid values.
The second stage of the research is to run regressions and esetimate models describing Chinese mutual funds managers’ abilities of stock-picking and market-timing based on the comparison of the effects of performance persistence between concentrated mutual funds and diversified mutual funds. The first step is to test whether the managers of concentrated equity mutual funds have greater stock-picking abilities than do diversified equity mutual funds based on regressions and models used to estimate the stock-picking abilities of mutual fund managers.
References
“Mutual Funds.” SEC Emblem, U.S. Securities and Exchange Commission, 14 Dec. 2010, www.sec.gov/fast-answers/answersmutfundhtm.html.
Sahai, Neeraj, and Peter L. Alexander. “Asset Manangement Overview.” China: The World’s Best Opportunity for Assest Managers?, 12 June 2012, pp. 7–11., www.citibank.com/transactionservices/home/about_us/articles/docs/china_asset.pdf.
Hamacher, Theresa, and Robert C. Pozen. “In China, Big Opportunities for Investors, If Mutual Funds Can Find a Way In.” Brookings, Brookings, 28 July 2016, www.brookings.edu/opinions/in-china-big-opportunities-for-investors-if-mutual-funds-can-find-a-way-in/.
Vickery, Mark. “3 China Mutual Funds To Buy As The Economy Expands In Q1.” Seeking Alpha, Zacks Investment Research, 20 Apr. 2017, seekingalpha.com/article/4063680-3-china-mutual-funds-buy-economy-expands-q1.
Chen, H., & Chen, L. (2017). An Analysis of the Investment Concentration of Equity Mutual Funds in China. 53(3), 511-520. doi:10.1080/1540496X.2015.1093846
My research project aims at investigating the effectiveness of different human rights enforcement mechanisms such as naming & shaming, trade linkage, and direct intervention when being applied to different regions of the world. I’m currently working with Dr. Zachery Bowersox at the Political Science department.
My research is still in the literature review and coming up with research design stage where I am still trying to formulate an index or mathematical model that would allow me to evaluate the effectiveness of different mechanisms while controlling for some key variables that will interfere with the result. What I have been working on for the past weeks was something called a “sensitivity scale” which will be factored into the equation to condition the main variable X country-year. This scale will include the region’s history of human rights violation, the cultural tolerance to autocratic rule, and its agricultural background which might impact the region’s sensitivity to less severe human right violations. In terms of data collection, I have been looking at the PTS and CIRI data, along with Freedom House and UN reports.
Existing literature mostly report mixed or no evidence on the effectiveness of one type of enforcement mechanism while the other types are only effective under some circumstances or being used in tandem with other measures. In some cases, scholars have found robust evidence that certain enforcement mechanism such has trade linkage in fact exacerbates the HR problem in the region. Most of these studies use significance tests to test their hypothesis. Indices are employed sometimes but not as common.
From the lit review, there have been abundant tests and analysis on the effect of particular HR enforcement mechanism on regional HR performance, but few has conducted research factor regional culture into the equation. The existing literature provides very helpful resources on methodology and relevant theories that help me not only in formulating my equation but also locate variables that need to be controlled in the tests. Several recent studies also provide me with valuable data which had not been made available in the common data sets.
Plans for the following weeks:
I will plan to finalize my model and look for data that would fit specifically into my sensitivity scale. I will also finalize the independent, dependent, and control variables for my study although the list for control variables could expand later on. Dr. Bowersox is assigning me readings in folders on a weekly basis, so I expect the literature review process to complete soon. Meanwhile, I plan to reach out to the digital librarian at the Woodruff Library to clean up some of the data already collected.
My research is on gender identity and dance. I am currently working with dance professor Lori Teague to explore gender identity exemplified by body and movements.
Background— Readings
I have been assigned some readings regarding gender and dance, and the first of them is Critical Gestures by Ann Daly. In her book, Daly points out a concept that “to dance is “female”” and yet in classical dance world like classical ballet men are still “in control” of women like tossing her around like a doll in choreography. This reading is a great entry to my research because it explicitly states that “dance is an ideal laboratory for the study of gender because its medium—the body—is where sex and gender are to originate… [and] where the discourses of the “natural” and the “cultural”” intersect. Another reading called In-Between Bodies: Sexual Difference, Race, and Sexuality also provides an important perspective on gender identity by stating that “rather than being considered given and and natural, bodies have been conceived as produced by social/cultural/historical influences while being resistant to those very process of production.” Therefore, gender is a constant evolving ideology that is contributed by “in-between mind (culture) and body (nature).”
Discussion— Expectations and Stories
In the first several meetings with professor Lori, we discussed about the readings, expectations for doing this research, and personal stories related to gender identity. Since I am taking two classes, dance pedagogy and improvisation, with professor Lori, some of my class assignments are tailored to relate to my research. During the meetings, professor Lori also asked me some questions to help me reflect on my personal experiences as a Taiwanese woman living in the United States and deepen my understanding of reading materials.
Future Plan
Future assigned readings will mostly come from articles included in dance conference so I can learn how to write about dance research for academia. We are planning to present the research on some of the dance conferences and this research partnership will likely continue after Research Partners Program. In the upcoming week, there will be a dance intensive held by professor Lori for me and other dancers/choreographers to do the actual dance for this research, so I will be able to participate in the process of creating a dance piece which will have its debut in early March.
References
Bloodsworth-Lugo, Mary K.. In-Between Bodies: Sexual Difference, Race, and Sexuality. Edited by Tina Chantor, State University of New York Press, 2007.
Daly, Ann. Critical Gestures: Writings on Dance and Culture. Wesleyan University Press, 2002.
My name is Tyler Pham, and I am currently a junior at Emory University. I am pursuing a degree in both Biology and Chemistry. This year, I will be researching in Dr. Jennifer Kwong’s Lab to better understand the mitochondrial calcium uniporter.
Research
Dr. Kwong’s Lab primarly focuses on a specific calcium uniporter within mitchondria called the Mitochondrial Calcium Uniporter (MCU). MCU is located in the inner membrane of the mitochondria and is responsible for uptaking calcium. Calcium acts as a second messenger that is able to both increase ATP production and signal cell death during a calcium overload. Understanding how the MCU works will help prevent cell death during calcium overload in such events like a heart attack (ischemia-reperfussion). Not much information is known about the MCU, but it is fairly certain that the MCU is made up of 4 subunits that together form a tetramer pore. Dr. Kwong’s Lab conducts research to both better understand how the subunits function and to improve regulation methods to this uniporter.
Image from Kwong (2015)
Involvement
My research project primarly focuses on laying a foundational knowledge to better undestand how the MCU subunits function. I will be measuring and comparing the calcium influx between an untransfected MCU and genetically mutated MCU with variant subunits. The variant subunits will contain differnet selectivity filters embedded within them to alter the flow of calcium into the tetramer pore. By analyzing the effects of mutating the subunit, we can better understand how the MCU functions.
I have only started working in Dr. Kwong’s lab for less than 2 weeks, and I have already learned so much from working with her. She has been training me in workshop like sessions to teach me the various skills and techniques I would need to know to work in her lab. So far, I have learned how to properly grow and plate cell tissue cultures and how to isolate proteins by lysing cells. In addition, I am currently perfecting how to measure calcium influx using a confocal microscope that is able to detect fluorescent dyes with lasers. I only have a few more skills and techniques to learn, and I hope to finish in the next couple of days.
Future Plans
I hope to finish up learning all of the necessary skills required to work on this research project. In addition, I plan to calculate and collect my first data set from the intial untransfected cell lines. I am excited to see where this project leads and what potential can come out of it. I hope to see my efforts play a major role in the future studies to come.
References
Kwong, Jennifer Q., and Jeffery D. Molkentin. “Physiological and Pathological Roles of the Mitochondrial Permeability Transition Pore in the Heart.” Cell Metabolism, vol. 21, no. 2, 2015, pp. 206–214., doi:10.1016/j.cmet.2014.12.001.
Posted on
Chronotype and Facial Affect Processing: An Assessment Among the College Population
By Eli B. Recht
Paper Overview:
My assignment for my first week in Dr. Rodman’s lab was to read the Senior Thesis of one of her former researchers, Eli Recht.
Eli starts out by mentioning that past research indicates that evening-oriented individuals have a predisposition for developing mood disorders, which impairs social functioning. His particular research looks at the impact of chronotype (individual circadian rhythms) and temporal (time of day) preference on social cognition, particularly facial processing. In other words, he wanted to see whether or not eveningness is related to social cognition. Eli’s paper includes literature reviews on the topics of chronotype and facial affect processing, which then allowed him to form his own hypotheses. Personally, the literature reviews were beneficial to read, as I am new to the topic.
Literature Review of Chronotype:
First, Eli gives the reader some background information on circadian rhythms. Circadian rhythms are 24-hour internal rhythms influenced by zeitgebers (external cues from our environment) such as light. Humans are diurnal, meaning that we are active during periods of light and rest during periods of dark. The hypothalamus’ suprachiasmatic nucleus (SCN) synchronizes many functions (including daily rhythms of wakefulness and sleep, hormone secretion, body temperature, performance, endocrine regulation, metabolic activity, sensory integration, alertness, heart rate, and gene expression) when it receives light signals through the retina. Circadian malleability refers to the flexibility of our rhythms to adapt to a changing environment, which is why we can alter our circadian rhythms with artificial light. Our circadian rhythms can also be altered by non-photic zeitgebers, including body temperature, attention, memory, sensory integration, locomotor activity and exercise, exogenous melatonin, food intake, drugs, stress, emotion, and social interaction.
Moreover, Eli discusses the differences between owls and larks. Owls are those who prefer to be active in the evening, whereas larks prefer to be active in the morning and have earlier times of peak alertness and food intake, and higher daytime core body temperatures. Larks also have more regular sleep patterns, as well as less disrupted sleep and sleep deprivation, compared to owls. Consequently, though, larks are less flexible in terms of shifting their sleep schedules. Additionally, owls and larks differ in their personality traits and moods; larks are cooperative, empathetic, motivated, whereas owls tend to be more pessimistic and show symptoms of major depression.
Interestingly, Eli mentions that eveningness is actually a genetic predisposition (vulnerability) for developing depression. In fact, light can be used as a treatment to improve mood for both owls and depressed people. Eli also discusses the influence of sociality on owls and depressed people. Staying up late to socialize with friends may actually cause depression by delaying one’s biological clock, leading to dysfunction of the SCN (which is connected to the limbic system and thus, emotions).
Literature Review of Facial Affect Processing:
Facial affect processing is the system by which we detect and interpret facial expressions and is thus critical to social competence. Eli mentions various brain structures involved in this process, including the fusiform face area and orbitofrontal cortex, superior temporal sulcus, and the amygdala. People with disruptions in sleep, attention, and mood actually perceive things differently, and the same goes for depressed patients, who perceive expressions as more negative. Also, research shows that people perform better on tasks during their preferred times of activity (relating back to owls and larks).
Hypotheses Generated from Literature Reviews:
Evening types will perceive emotional expressions with less emotional intensity than morning or intermediate types, particularly at the low intensity range of expressiveness.
Participants tested at their preferred times of activity will perceive facial expressions with more emotional intensity than participants tested at their non-preferred times of activity, particularly at the low intensity range of expressiveness.
Method:
This research was conducted on Emory University students ages 18-24. A Morningness-Eveningness Questionnaire (MEQ) was distributed to the participants to determine chronotype. Based on the results of the MEQ, students were then placed into two groups, preferred and nonpreferred, referring to the time of day that they were being tested. For instance, an evening-oriented individual being tested in the morning would be placed in the nonpreferred group. The subjects were shown four facial expressions (anger, happiness, sadness, and surprise), each with 10 gradients in emotional intensity. These expressions were then rated on a 9 point intensity scale, via a computer task.
Conclusions:
There was no significant difference in the average intensity ratings of the four facial expressions between chronotype groups or preferred or nonpreferred time groups; thus, his original hypotheses were not supported. Eli’s, his experiment was still informative to the lab! He conducted an exploratory data analysis and found a time of day effect. (An EDA is basically when statisticians see what the data can tell them beyond the original hypotheses in order to form new hypotheses and experiments.) Essentially, subjects would rate the intensity of facial expressions higher at the higher ranges of intensity during the evening. (This means that, for example, at night, you are more likely to perceive someone’s expression as even more intense than usual.)
Questions/ Future Directions:
Based on this study, perhaps we could look further into the time of day aspect. Also, I am curious to see if we could expand this research to other age groups.
My name is Eric Park and I am a second-year student studying in Emory College. I am undecided, but am highly considering applying to medical school.
My Lab and Research
I am working in Dr. Dyer’s lab, specifically with my graduate mentor Greg. Greg is a third-year student studying inorganic/physical chemistry. Our research is on understanding the mechanism of hydrogen bonds in metalloenzymes—enzymes that contain a metal ion—and produce “mimic” enzymes to utilize the bond energies as an environmentally-friendly and cost efficient energy source. We also focus on the 2H+ + 2e- –> H2 reaction and study how nature efficiently carries out this reaction.
First Lab
I went in the lab for the first time on September 30th, 2017 and Greg taught me how to analyze absorption rates using a UV-Vis spectrometer. Absorption rate is the percentage of light a solution absorbs as a specific wavelength of light is shined through it. Using the equation **A= E*c*l (A= absorption, E= extinction coefficient, c= concentration, l= path length) and the absorption rate that was collected from the UV-Vis spectrometer, we can calculate the extinction coefficient—a specific absorption rate value unique for every substance. In this particular experiment, I used a diluted myoglobin solution as the subject of study.
**As concentration of the solution increases, the less light is able to shine through. This is self-explanatory by using every day examples. The more nestle chocolate milk powder you put in water, the darker the solution gets and the lesser amount of light is able to pass through. For the path length, light is less able to pass through a full tank of dark chocolate milk than a small glass of chocolate milk.
Second Lab
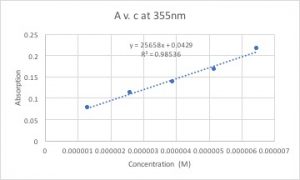
On October 3rd, 2017 I repeated the same experiment but with dithyanide mixed to the myoglobin solution. Dithyanide has two electrons that can reduce other molecules, therefore it can reduce two myoglobin molecules. This reduction of myoglobin changes the conformation of the ligands– anything attached to the myoglobin– and puts the electrons in a lower energy state. Since a lower energy state is equivalent to a higher wavelength, the absorption peak appeared at a higher wavelength (I will add figures later when they become available). In addition, we can calculate the extinction coefficient by graphing A v. c and calculating the slope of the trend line. Here is a sample graph where I graphed A v. c for the dithyanide + myglobin solution:
On the y-axis is the absorption rate and on the x-axis is the concentration of the solution. It is evident in the graph that the concentration and the absorption rate are proportional to each other. The slope of the trend line would be the value of the extinction coefficient because if you manipulate the equation A=E*c*l to E= A/(c*l) you can see that the absorption rate divided by the concentration gives the value of the extinction coefficient (the path length is 1 we can disregard it).
What I plan to do…
For the next couple months, I plan on learning more lab techniques and reading journals. I do not think I will actually get involved in Greg’s research until late spring to early summer. Until then, I plan on learning all the lab techniques that are required to assist Greg in his research.


 Over the past couple of weeks, I have been facing my ultimate nemesis in my project, confocal microscopy. Confocal microscopy is a microscope that is able to measure fluorescence (light) from a fluorescent dye (light inducing). In the beginning, I thought it was going to be an easy task, but I was deeply mistaken. It has taken my a total of 5 weeks to master the microscope and to produce usable data for my project. The main hurdle that I encountered was learning to permeabilized my cells. This was a crucial step because it was going to yield accurate and useful data. If I didn’t master this, my whole project would come falling down.
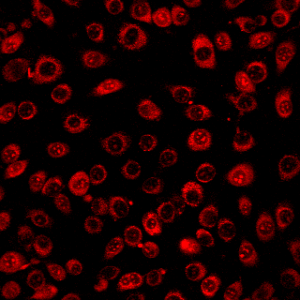 From what i achieved, a successful permeabilization will result in a grainy texture of the cell fluid that surrounds the nucleus. The grainy texture is in fact small bubbles that are a result of the break down of the cell membrane. Once we reach this stage, the permeabilization has just begun. To make sure that it is the correct amount permeabilization, the bubbles will increase in size and become even more grainy. Eventually, there comes a point where the bubbles are just the right size so that it will not destroy the membrane and it’s big enough to allow dye to flow out and calcium to flow in. This point is up to the discretion of the researcher. There is not a justified size to the bubbles, but after many practice rounds, there is a preferred size for each researcher every time.
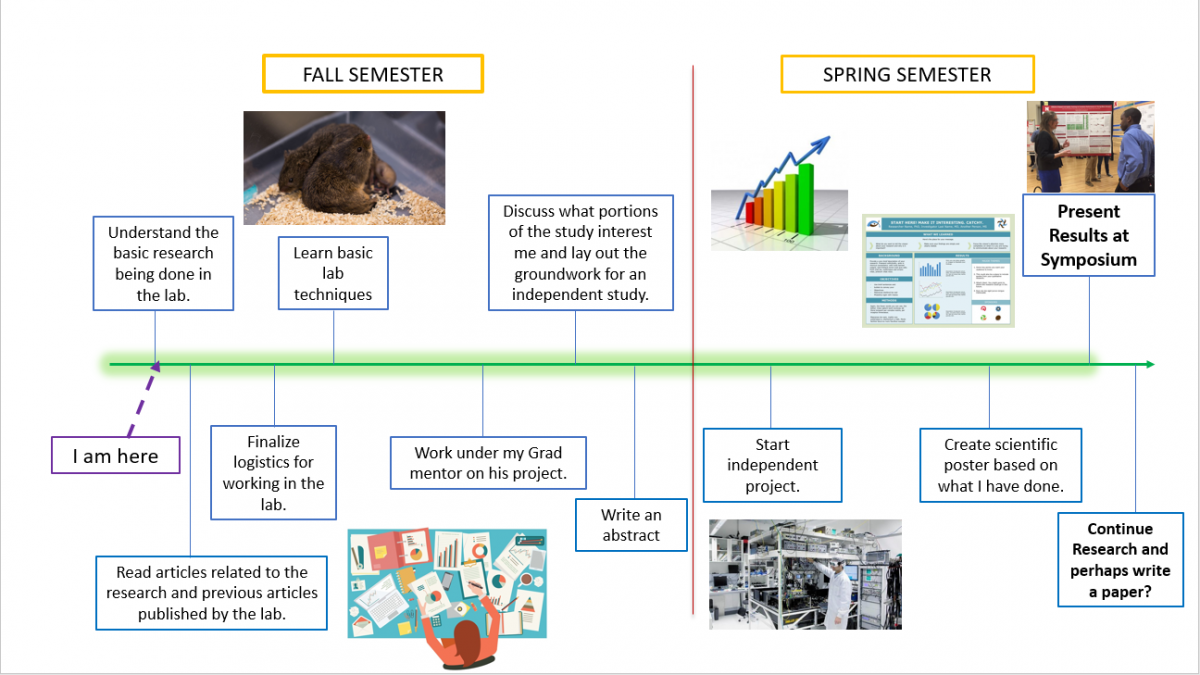
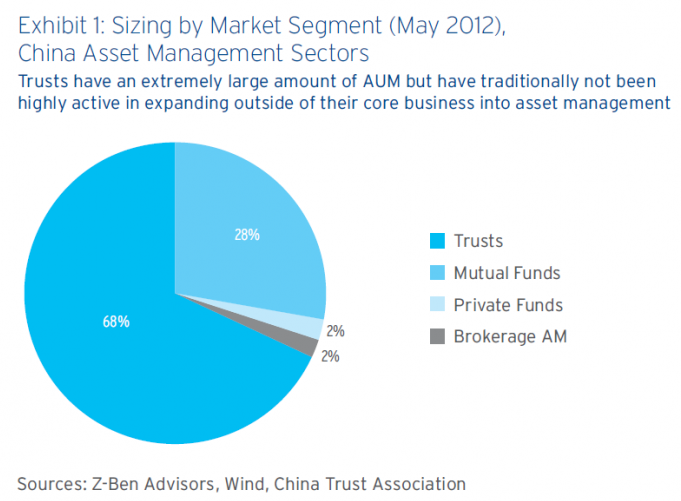
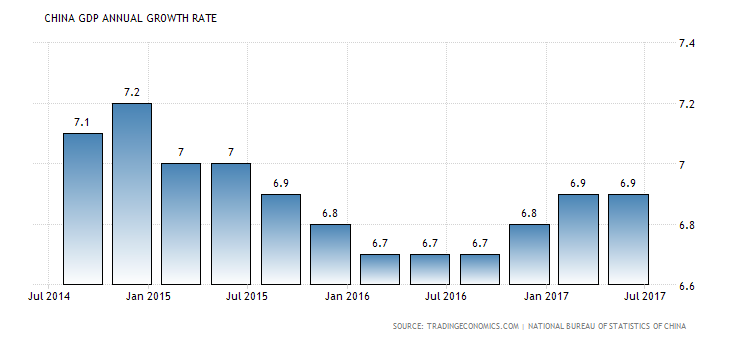
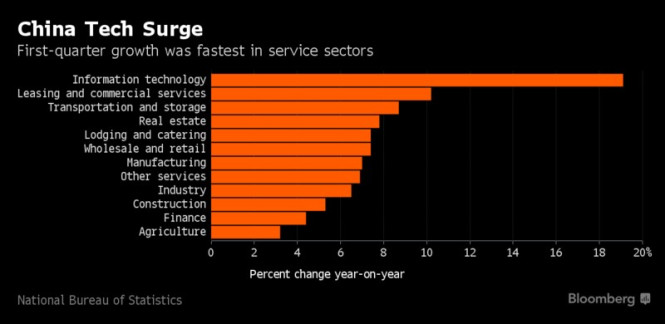
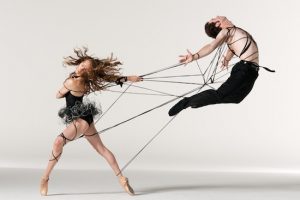
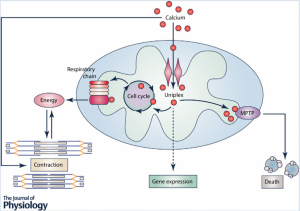 Image from Kwong (2015)