The Evolution of Turner Field and its Impact on NPU-V

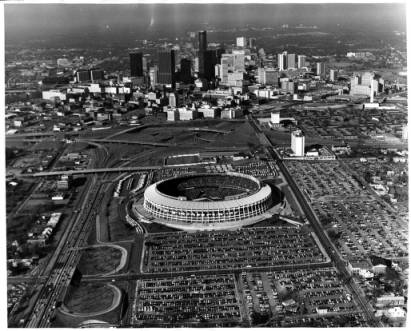
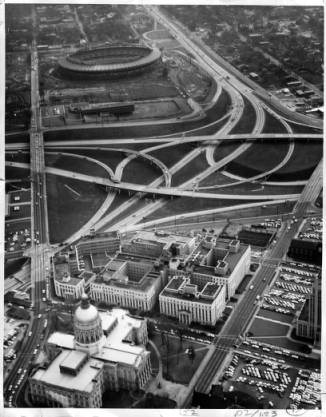
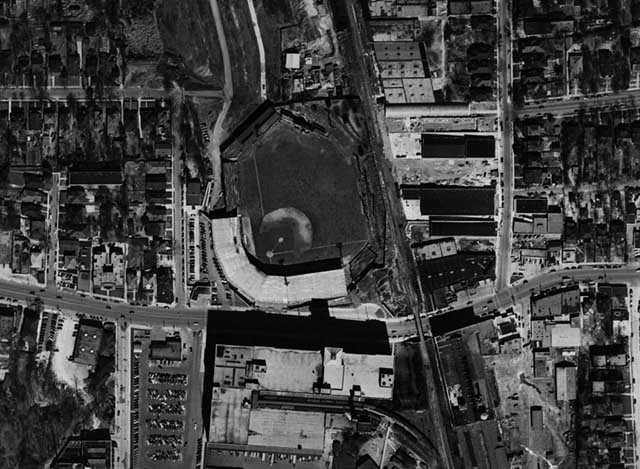
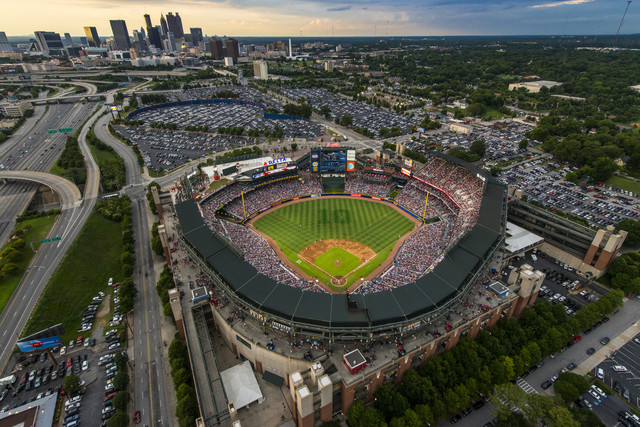
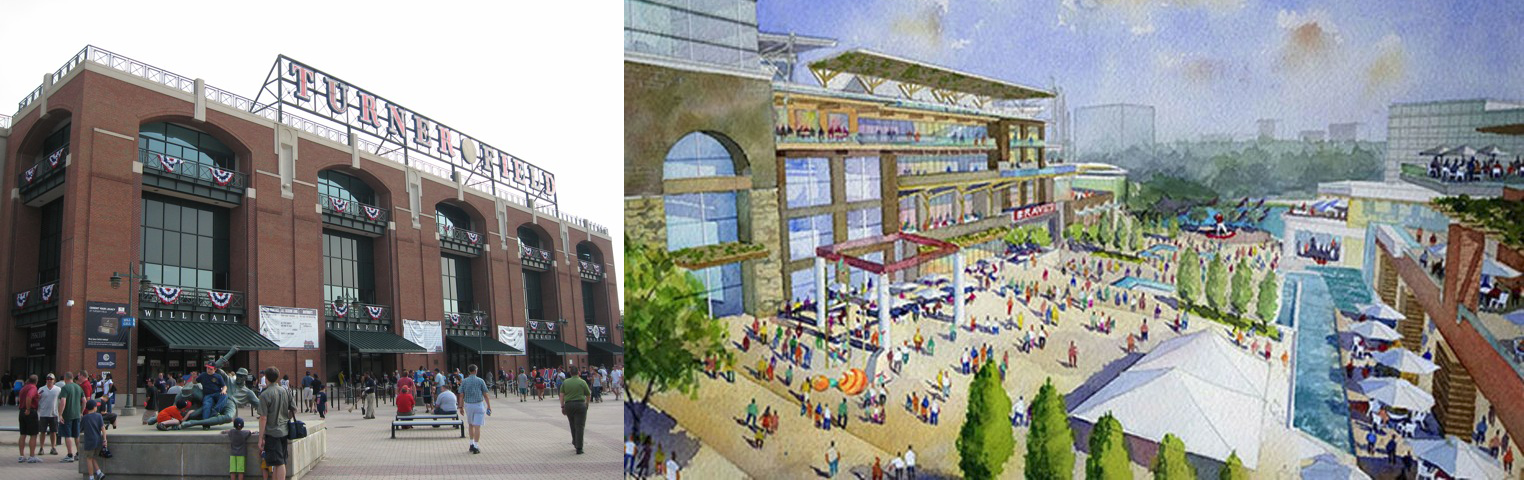
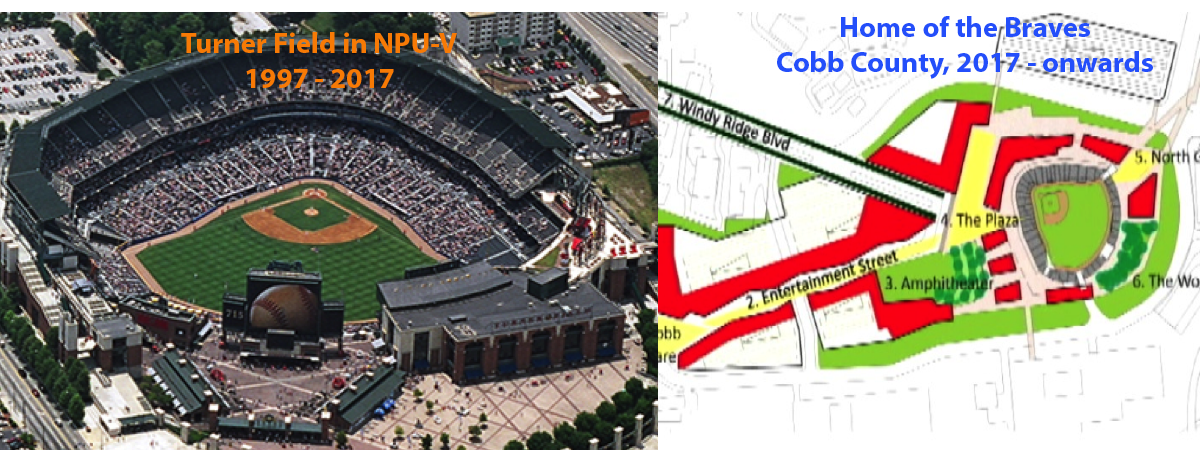
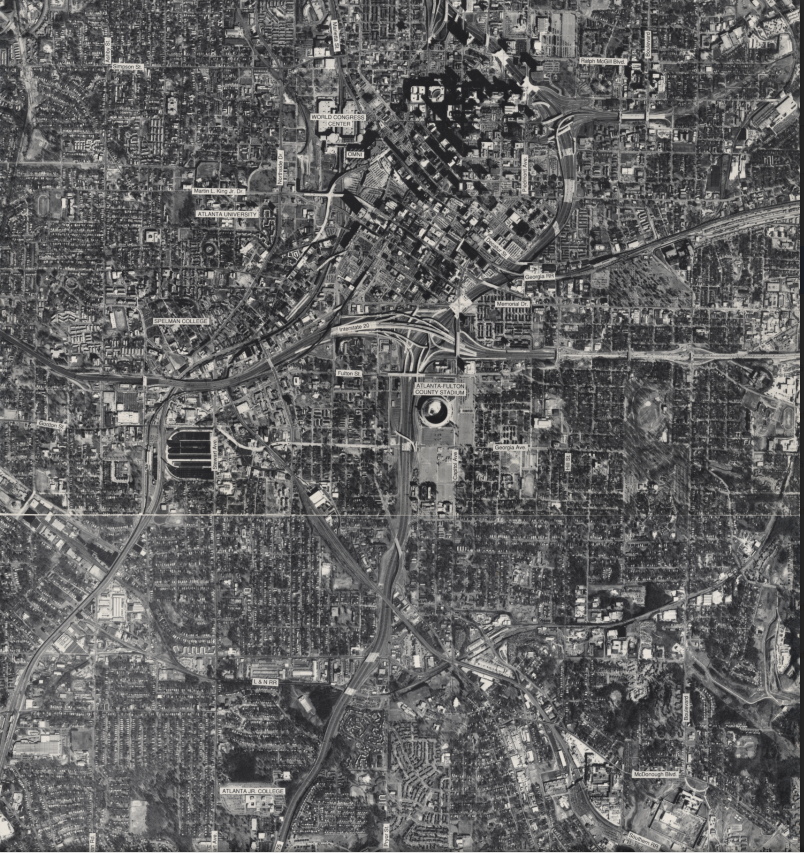
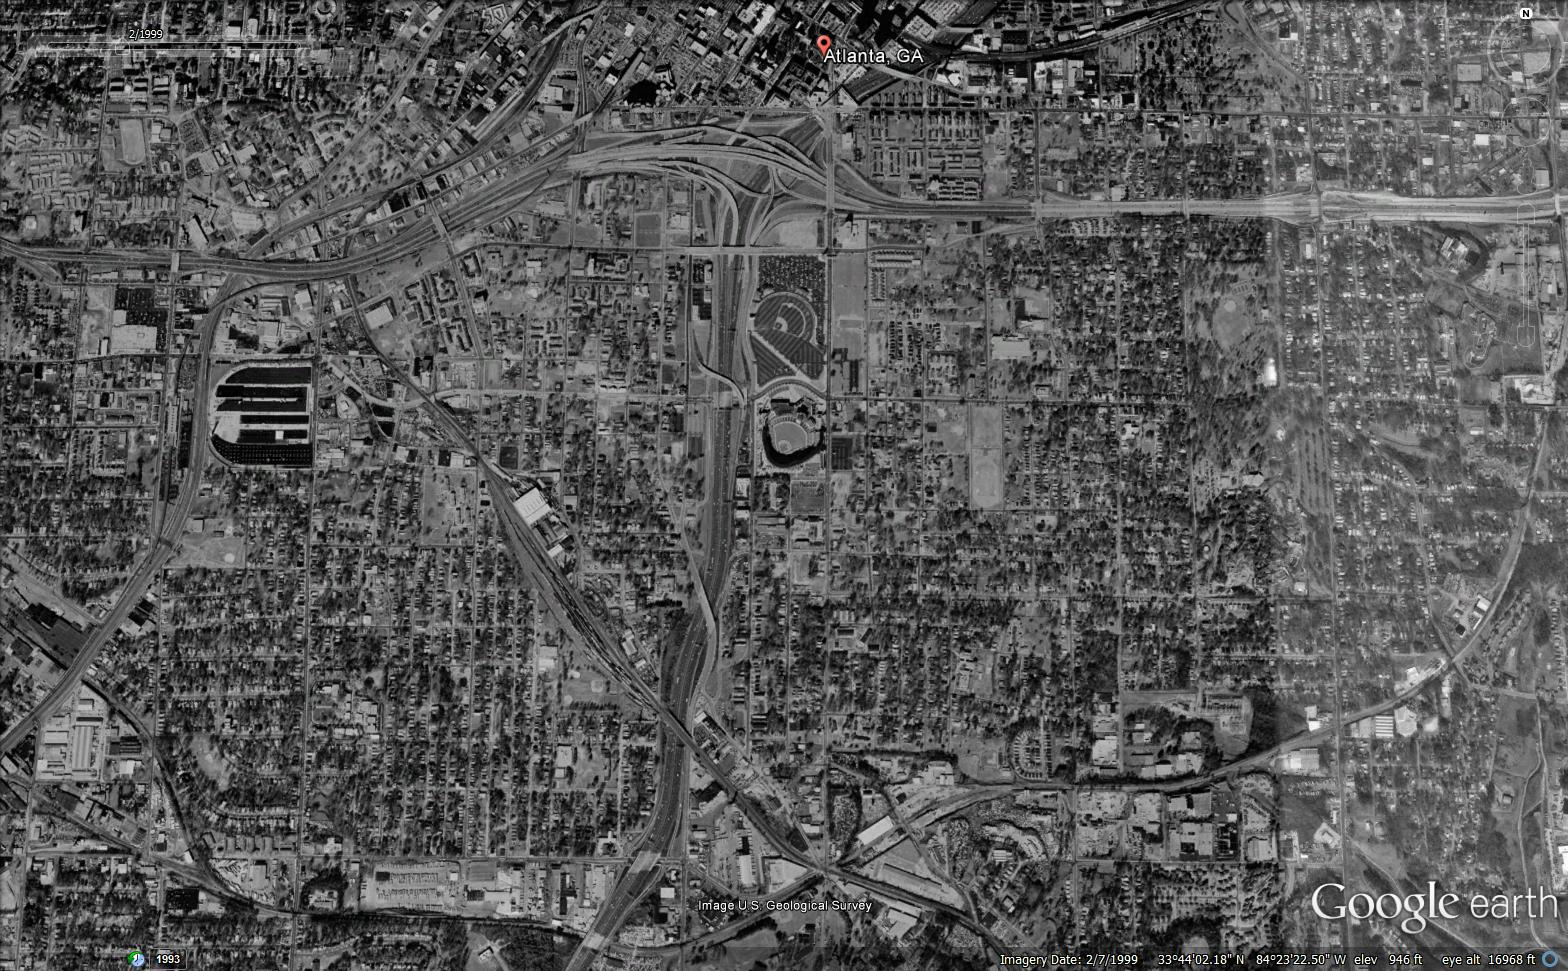
This wordpress scholar blog is an analysis of baseball facilities in Atlanta beginning in 1990 with a focus on NPU-V through the construction of Atlanta-Fulton Stadium and ultimately Olympic Stadium which transformed into the famous Turner Field. This investigation specifically evaluates demographics such as the changes in population, race, housing values and occupancy, crime rates, and poverty levels. Three map layers with socioeconomic data are presented – 1990, 2000, and 2010 – along with a timeline of events and historical photographs.

Members: Sahana Kuthyar, Chelsae Gill-James, Megan Rosa

Class: ENVS 385 Visualizing the City

Dr. Page

Socioeconomic Data

Population

1990 15,960
2000 15,825
2010 14,198

Trend: Decrease in population

Race

1990 2000 2010
White 5,730 491 412
Black 9,289 14,512 12,906
Asian 399 570 582
Hispanic 223 253 284
Other 319 253 312

Trend:

Decrease in white populations

Increase in black, Asian, and Hispanic populations

Crime Rate

1990 2000 2010
Property Crime 21% 58% 23%
Violent Crime 24% 32% 22%

Trend: Highest crime rate in 2000

Housing

1990 2000 2010
Total units 5,747 6,587 8,686
Occupied units 4,425 5,731 6,601
Vacant units 1,322 856 2,085
Appraised value $69,900 $130,600 $175,342
Ownership of homes 4,150 3,798 3,408

Trend:

Increase in total housing units, occupied units, and appraised value

Overall increase in vacant units

Decrease in ownership of homes

Poverty

1990 2000 2010
Poverty rate 38% 47% 35%
Average Gross Income $20,458 $21,249 $29,461

Trend:

Highest poverty rate in 2000

Increase in average gross income