This post continues a dialogue between Mark Ravina and TJ Greer on text mining and the recent student protest movement. In this entry we examine the potential for sentiment analysis.
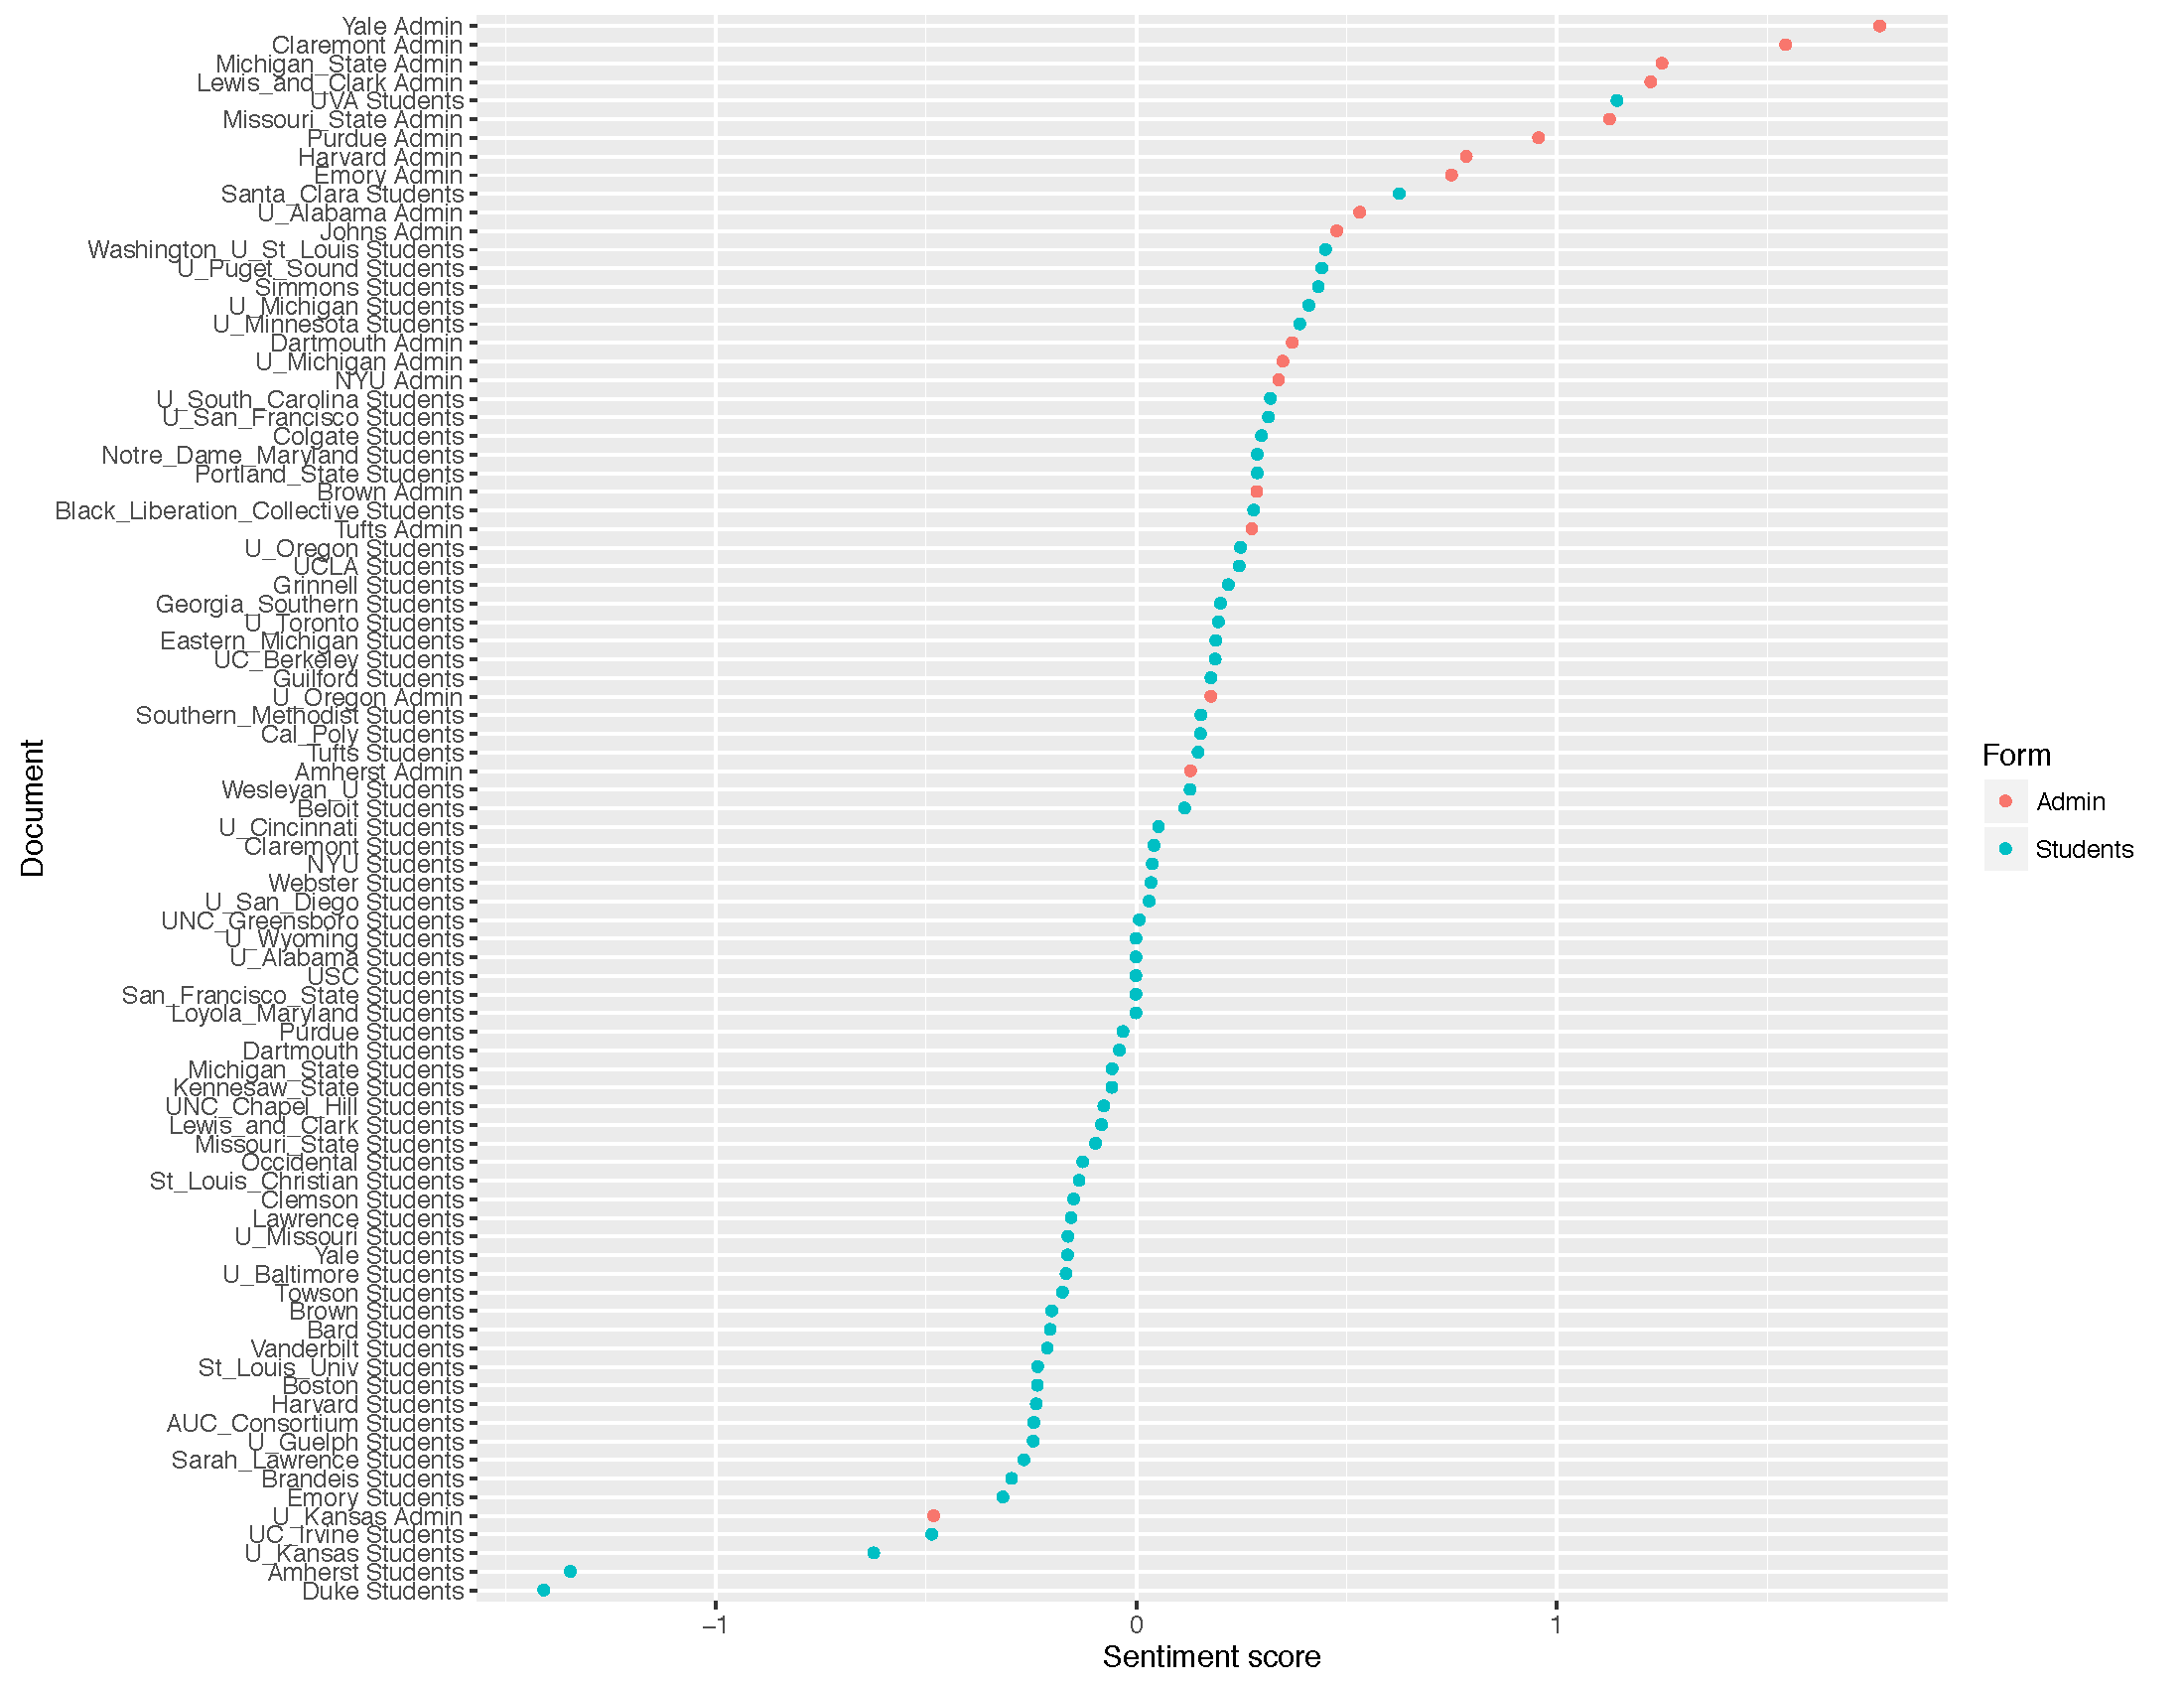
Mark: I’m somewhat cynical about sentiment analysis. How much of the emotional valence of a document can really be captured by counting adjectives? But I was intrigued by the “polarity” function in the qdap package, which actually looks at nearby words to see if the meaning of adjective is intensified or negated. For example, “not” before “sad” switches the meaning, but “very” intensifies it. According to the qdap package, Duke is the most negative student document while UVA is the most positive. I wonder if those scores aren’t triggered largely by the frequent use of the word “hate” as “hate speech” by the Duke students. On the other hand, the UVA documents uses “should” a great deal, and just has a gentler tone. What do you think?
TJ: To me the qdap sentiment analysis does capture the general tone of the documents. But what’s equally interesting is how the student activists tend towards -1 (negative), while the administrations tend toward 1 (positive). Though there is only one administration document, the University of Kansas, that tends towards -1, there are a multitude student activists documents that tend toward 1. I made a similar observation about the scatter plots in our previous post. In the word frequency scatter plots, just in this sentiment analysis, student activists were rather diverse in their language patterns. Although student activists used some of the same words as administrators, there were also many terms used solely by students. There was much greater diversity in student activists’ documents, as compared to the administration documents. Here we see this again in regard to sentiment. Though a number of student activists documents have a positive sentiment, administrations almost never have a negative sentiment in the figure. However, I must note that “negative” sentiment in this context has a very different implication than how we intuitively view polarity in documents. In this context, administrations that are more “negative” are actually being responsive to the students concerns and appear to be practicing a form of active listening via the written word, regurgitating student activists’ expression of pain, frustration, and anger and then presenting their respective administration’s perspective on the student activists’ concerns.
Mark: OK, you prompted me to do some number crunching, and your impression are correct. By every standard measure, the sentiment scores are more varied for student demands than for administration responses.
| Sentiment scores | students | administrations |
| SD (standard deviation) | 20.27 | 15.16 |
| IQR | 32.00 | 18.25 |
| range (max-min) | 2.55 | 2.25 |
And I became curious about lexical diversity. But the standard metrics there are less helpful. The students demands use roughly 5785 unique words, in contrast to 2516 for the administrations. But standard measures of lexical diversity divide by the total number of words: in our sample 15508 for the administrations and 56650 for the students. So the Type-Token Ratio (TTR) is actually lower for the students at 0.1, compared to 0.16 for the administrations. Of course, that’s probably a reason to distrust TTR.
