Mental And Physical Predictors Of Performance Among Recreational Runners
The overall aim of our class research project was to address two questions: Why we run and why some of us run faster. While addressing the first entailed an open-ended and very exploratory research methodology (see the student presentation Runners mental strategies), the latter focused on using survey and anthropometric data to hone in on hypothesized mental and physical attributes that might account for speed differentials among runners. This document focuses primarily on the second question and uses the survey data collected as well as the data on heights and weights.
The mental and physical predictors of running performance are much discussed and debated topics. Those interested in the evolution of endurance running, as well as those interested in accounting for within- and between-nation performance differences have sought to understand how body shape might impact running performance. This focus on body type emerges from the characteristic differences in body shape evident among short and long distance runners and, perhaps, in the body shapes of East African runners. Three aspects of body shape have been hypothesized to impact on running performance, especially as it relates to running economy. These are body weight, height and leg length, and calf circumference. For marathon runners, the average body mass index (kg/cm2) has declined since 1988 while marathon speeds have increased. Lighter body weight and lower body mass index may result in less energy used per unit of space moved and may be beneficial for heat dissipation. Marc et al argue, based on historical marathon data, that a BMI of 19.8kg/m2 optimizes marathon performance. Leg length has also been hypothesized to impact on running speed and economy. Although results are somewhat ambiguous, relatively longer legs have been associated with lower locomotor costs which may impact on running economy. Finally, Kong and de Heer (among others) have suggest that reduced calf circumference leads to lower moments of inertia and thus less mechanical work; in support of this, they show that Kenyan runners have small calf circumferences and that smaller calves are associated with shorter ground contact times.
A variety of lines of research have led to new results that strongly implicate the mind – or how someone thinks about the world – as a determinant of performance. The most well known of these approaches is Noakes’ Central Governor Model that assumes that the brain houses a central governor that regulates performance and effectively alerts the brain to ‘put on the brakes’ whenever exertion adversely threatens bodily function. This recognition has led others to test interventions that train the mind to override the central governor, which then allows bodies to push past the point brains deem safe. Marcora and colleagues, for example, showed that having people engage in a mental, but not physical, taxing task prior to exercise led to short shorter time to failure. We were not able to explicitly test hypotheses drawn from this line of thinking although we speculated that individuals who identified more strongly as athletes would perhaps be able to push past the point at which brains tried to put on the brakes. We also speculated that individuals who had more grit, or tenacity in the face of difficult tasks, would, net of other factors, have faster running speeds because they would be able to push past the point when their bodies were yelling, “Stop!”
Finally, researchers have long debated the role of sex in determining performance, with many noting a clear male advantage and others speculating that females will soon surpass males. We therefore hypothesized that the sex of the runner would be a strong predictor of speed, and we explored to what extent, if any , this difference was due to difference in other measured variables.
Brief Methods
Student researchers and Professor Hadley attended the 2014 Spring Tune Up 8k/15k race put on by the Atlanta Track Club (ATC). With the aid of the ATC, students sought volunteers to participate in our course research project and sought their verbal consent to participate. Participation entailed getting weighed and measuring standing height and sitting height (the difference allowed us to obtain an estimate of leg length). Participation also entailed filling out a survey that asked after a variety of pieces of information described below:
Weight, height, BMI, leg length, and calf circumference: Participants were weighted to the nearest 0.1 kilograms on a SECA portable scale. Their height was measured to the nearest centimeter using a portable SECA stadiometer. Calf circumference was assessed by identifying that section of a participant’s calf that appeared the largest and then using a tape to measure the circumference (cm). Participants then sat on a stool of known height and had their sitting height measured, which could then be used to estimate their leg length.
GRIT and Athletic Identity: We used the a) 8 item GRIT scale and the b) 10-item Athletic Identity Measurement Scale (Martin et al, 1997) to a) measure grit or tenacity and b) the degree to which people self identify as “athletes”.
Training volume and training types: Runners reported their normal weekly training volume in miles, and whether they included any of the following training modalities into their weekly training: Tempo runs, hill repeats, intervals, fartlek/variable speed, long runs, recovery runs, and cross-training.
Running Speed: For many of the analyses that follow we used running speed as the key outcome variable. We used each runner’s chip time divided by the length of his or her race in meters (8k or 15k) to arrive at speed in meters per second.
Injuries: Runners were given a list of nine specific injuries or common sites of pain and asked whether they had experienced injury/pain in that area in the last two years.
Demographic information: Runners were asked for their age (years), sex, and years running.
Why do you run?:Runners were asked, “Why do you run?” and “What are your running goals?” Responses to these questions were open-ended and could be answered in any way that the respondent decided. Responses were collated and coded by general theme for analysis.
Results
Our sample compared to the overall race population
The non-random nature of our sampling invites concern about how representative our sample is of the Spring Tune Up racing population. To examine the extent to which our sample, ANTHRO, matched the Spring Tune Up population we used the publicly available results that were posted online. With these results we were able to calculate racing speeds and compute average age and sex distribution and then compare these statistics with the same statistics calculated from our sample.
Table 1. Comparability of ANTHRO 385 samples to race population
|
8kSTU |
8k(ANTHRO) |
P |
15kSTU |
15k(ANTHRO) |
P |
|||
| Male, % |
43% |
55% |
0.03 |
50% |
47% |
0.28 |
||
| Age, years |
39.81 |
38.28 |
0.33 |
40.00 |
37.30 |
0.06 |
||
| Speed, m/s |
2.61 |
3.00 |
<0.01 |
2.93 |
3.00 |
0.33 |
||
| n |
577 |
80 |
456 |
66 |
||||
| Men | ||||||||
| Age, years |
42.25 |
37.39 |
0.03 |
41.53 |
36.87 |
0.03 |
||
| Speed, m/s |
2.92 |
3.27 |
<0.01 |
3.12 |
3.35 |
0.02 |
||
| n |
251 |
44 |
231 |
31 |
||||
| Female | ||||||||
| Age, years |
37.92 |
39.36 |
0.52 |
38.42 |
37.69 |
0.70 |
||
| Speed, m/s |
2.37 |
2.66 |
0.01 |
2.73 |
2.69 |
0.60 |
||
| n |
326 |
36 |
225 |
35 |
||||
Overall, our study sample in the 8k race was biased towards males and runners who ran faster than the overall 8k study population. This was probably due to the fact that we over-recruited men who were slightly younger and men and women who were slightly faster than the Spring Tune Up 8k race population. For the 15k racers, we over-recruited males who were younger than the overall 15k male racer population and, probably relatedly, were somewhat faster than the overall 15k male race population. For women, our 15k study sample did not differ from the overall female 15k population in terms of age or speed.
Table 2. Characteristics of the study population
|
Female |
Male |
||||
|
Average |
SD |
Average |
SD |
||
| Age, yrs |
38.5 |
12.1 |
37.1 |
12.8 |
|
| BMI |
22.7 |
4.1 |
23.4 |
3.8 |
|
| Bodyweight (kg) |
61.0 |
11.9 |
73.5 |
13.6 |
|
| Height (cm) |
163.8 |
6.3 |
176.9 |
7.2 |
|
| Calf circumference (cm) |
37.9 |
12.8 |
39.2 |
12.4 |
|
| Speed (m/s) |
2.7 |
0.5 |
3.3 |
0.5 |
|
| Miles/wk |
18.1 |
10.7 |
20.8 |
13.1 |
|
| AIMS |
4.4 |
2.3 |
4.8 |
2.1 |
|
| GRIT |
27.7 |
3.8 |
25.9 |
3.9 |
|
| Injury count(# of injuries in last two years) |
1.9 |
1.8 |
2.2 |
1.8 |
|
| n |
69 |
75 |
|||
One hundred and forty four racers agreed to take our survey. Their characteristics are shown above in Table 2. The results shown below are based on this sample of 144 racers.
Running speed: Why do some run faster?
Correlates of running speed – bivariate analyses
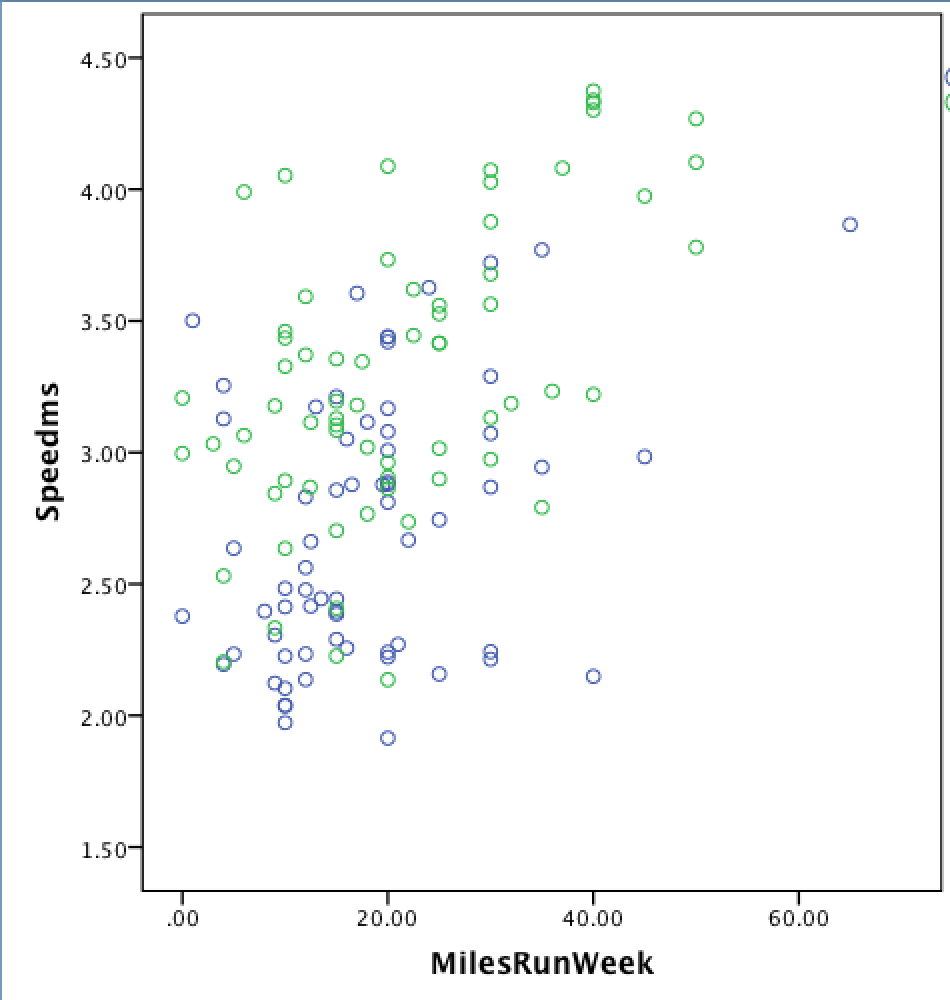
The correlates of speed in the bivariate analyses were sex specific (Table 3). For women, heavier women and those heavier for their height ran significantly slower, as did older women. For men, leg length was a marginally significant predictor of speed but BMI, weight, and age were not correlated with speed. For both women and men, miles run per week was positively related to speed: those who ran more per week ran faster at the Spring Tune Up (see Figure 1). Finally, those who scored higher on the athlete identity scale (AIMS) also ran faster, and this was true for men and women.
Table 3. Correlates of running speed by sex. Values are the correlation coefficient and those in bold are statistically significant. 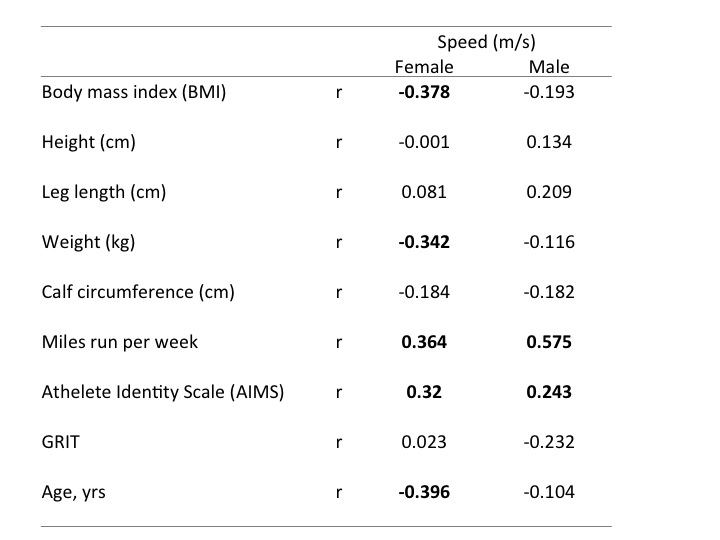
Figure 1. Miles run per week and speed (m/s) at the Spring Tune Up. Green dots are male, blue dots are female.
Exploratory analyses of the data showed that many variables were interrelated. To identify the independent effects of each variable we fit two linear regression models (one for women, one for men). We used backward stepwise regression methods to arrive at the smallest set of variables that predicted running speed (Table 4). In these models we find that the same set of variables predict speed in men and women. These variables are miles run per week, leg length (positive association), body weight and age (negative association). These models show that people with longer legs and who run more miles per week tend to run faster while heavier and older individuals tend to run slower. Interestingly, the athlete identity scale is no longer significant when we account for other factors. The variables in the model explain between 36% and 39% of the variation in running speed observed at the Spring Tune Up suggesting other unmeasured factors account much of the variation in speed. There is more research to be done!
Figure 2. Women’s speed (m/s) by their body mass index.
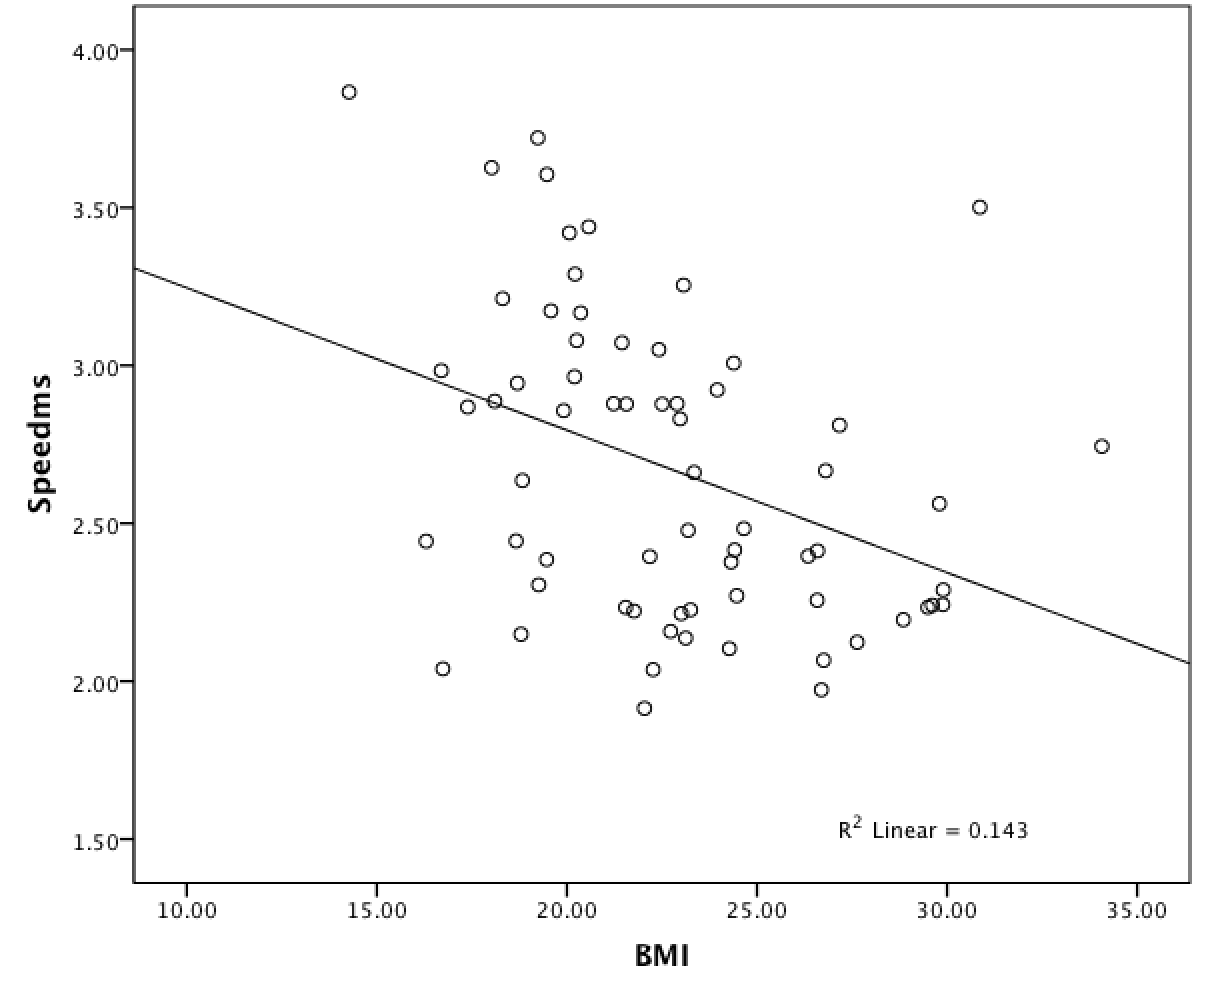
Table 4. Correlates of men and women’s running speed from backward stepwise regression models.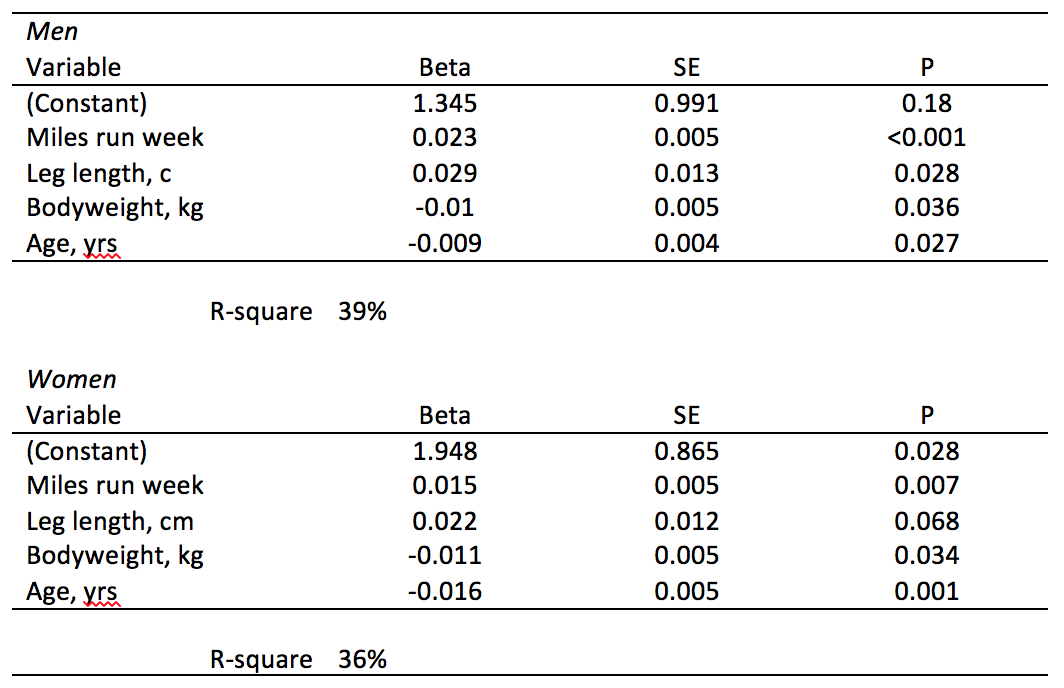
Injuries
Types, Prevalence, and Predictors of Running Injuries
Runners in our sample reported a high 2-year prevalence of running –related injury. Table 5 shows the type and frequency of running-related injuries. Only 23% of the sample reported no injury, whereas nearly 20% reported one injury, 20% reported two injuries, and 19% reported three injuries. The remainder reported four or more injuries. Knee pain, muscular strains, and IT band pain and shin pain were the most commonly reported sites of injury, and this was remarkably similar for men and women. No variable in our dataset consistently predicted any of the injury variables except those who scored in the upper 3rd of the athlete identity scale reported significantly more injuries (2.6 injuries vs. 1.5 injuries; p<0.01).
Table 5. Prevalence of self-reported injury due to running by men and women.
| Had injury in last 2 years? |
Male |
Female |
| Knee/patellar Pain |
46% |
39% |
| Muscle strain |
40% |
33% |
| IT band |
20% |
29% |
| Shin pain |
32% |
26% |
| Calf pain |
28% |
25% |
| Plantar fasciitis |
16% |
14% |
| Achilles pain |
24% |
12% |
| Tendonitis |
11% |
10% |
| Stress fracture |
3% |
4% |
Why Do People Run?
Runners in our survey were also asked why they ran and what were their running goals. These were open-ended questions which were subsequently recorded and/or grouped. Table 6 reports the recorded categories and the frequency with which they were mention by our sample. The most often mentioned reasons for running were simply that “It feels great!”, “just love it!” or that it “makes me happy.” This set of reasons was followed closely by reasons that had to do with fitness, health, or running being a good and/or accessibility form of exercise. Nearly a third of respondents mentioned some mental benefit of running as a reason for running; this included statements such as “Running provides mental clarity”, “Running is a great stress reliever”, “Running is a very good anti-depressant”, and “running helps my self-confidence”. Just under 10% of respondents mention that they run because the have specific goals, such as “Go to Boston” or “Beat my buddy!” Fewer than 10% mentioned that they run because they enjoy the social aspects, especially running with friends. Nine respondents mentioned that they run because it allows them to eat or drink without guilt while eight participants specifically mention weight lose or maintenance as a reason for running. Runners could mentioned multiple reasons so totals sum to more than 100%.
Table 6. Self-reported reasons for running recorded into broad categories.
| Reason | Freq. endorsed (%) |
| Just love it!/Feels good!/makes me happy |
45.19 |
| Health/exercise |
39.26 |
| Self confidence/Mental clarity/stress reduction |
30.37 |
| Having/Meeting goals |
9.63 |
| Social aspects/Being with friends |
8.89 |
| So I can eat/drink! |
6.67 |
| Weight lose/maintenance |
5.93 |
| Training |
2.96 |
| Being outside |
1.48 |
Runner’s goals were somewhat less easy to categorize, although an attempt is shown in Table 7. A majority of respondents made some mention of staying in or gaining physical fitness, health, or ‘being in shape’, as a primary goal in their running. A quarter of respondents made some mention of running-related goals, such as “set a new PR”, “continually set new goals to strive for”, or “get faster” or “BQ!” Others noted that their goal was a specific race or time, such as “Run marathon in 2:50”. Simply having fun, finishing races, and being with friends were mentioned as goals by around 13% of respondents, and another 8% mentioned something along the lines of “get better” or “keep improving”. Weight control and some aspect of physique (“look good”) was mentioned by 8% of respondents, collectively and a small number of runners reported their goals were to stay injury free, get outside, or raise money for a specific charity.
Table 7. Goals that runners report aspiring towards.
| Goal | Freq. endorsed (%) |
| To stay fit/get in shape |
52.59 |
| Get faster/setting & meeting new goals/improve |
25.93 |
| Specific race/just race |
14.07 |
| Have fun/finish!/be with friends |
13.33 |
| General improvement |
8.15 |
| Weight control |
5.93 |
| Improve physique |
2.22 |
| Injury free |
2.22 |
| Get outside |
1.48 |
| Raise money for charity |
0.74 |
Conclusions
In this study we sought to assess two questions: Why do people run and why do some people run faster. With respect to the first question, people reported simply loving running, running for exercise, and for mental reasons, mostly stress reduction.
With respect to the second question we found a variety of answers. First, consistent with a large body of literature, men reported running faster speeds than women, and this was not explained solely by differences in body weight, leg length, or through mental aspects like athletic identity. In the adjusted models, we found that younger age, lower BMI and longer leg length and increased weekly mileage were associated with faster speeds. Neither GRIT nor athletic identity was associated with faster speeds, once other variables were controlled for. Training types were also not reliably associated with faster speeds.
Few variables predicted injuries, which was surprising but the high level of injury was consistent with many other studies of recreational runners.
The cross-sectional design of our study hampers our ability to make strong inferences.