Below are the datasets our lab uses as well as curated. The paper citations for the datasets have been added as well.
TROPOMI-derived ground ozone in California
Using the TROPOMI satellite data and the HRRR meteorological feild, the daily-level ground ozone concentrations were estimated using random forest model. TROPOMI data improved the estimate of extreme values when compared to a similar model without it. Our study demonstrates the feasibility and value of using TROPOMI data in the spatiotemporal characterization of ground-level ozone concentration.

Spatial Resolution: 10 km
Temporal Resolution: daily
Temporal Coverage: May 2018 – April 2019
The estimated ozone season, non-ozone season average ozone concentrations and the model was publicly available at: https://zenodo.org/records/14498553
Reference: Wang, W., Liu, X., Bi, J., & Liu, Y. (2022). A machine learning model to estimate ground-level ozone concentrations in California using TROPOMI data and high-resolution meteorology. Environment International, 158, 106917. [link]
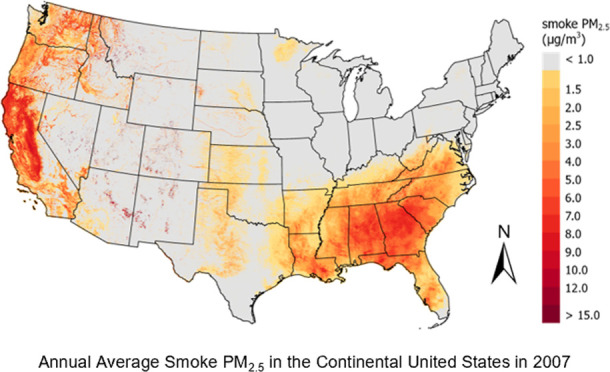
CONUS smoke PM2.5 estimation
We estimated daily air pollution levels (PM2.5) across the United States by combining data from government monitors, low-cost sensors, and computer models. We used additional information from satellites, weather data, and smoke maps to improve coverage and accuracy. To separate smoke from wildfire events from other pollution sources, we built models that compared air quality in smoky and non-smoky areas. This approach allowed us to estimate how much of the air pollution came specifically from wildfire smoke each day.
Reference: Wildland Fires Worsened Population Exposure to PM2.5 Pollution in the Contiguous United States
Danlu Zhang, Wenhao Wang, Yuzhi Xi, Jianzhao Bi, Yun Hang, Qingyang Zhu, Qiang Pu, Howard Chang, and Yang Liu
Environmental Science & Technology 2023 57 (48), 19990-19998, DOI: 10.1021/acs.est.3c05143
The original data is available at 1km resolution. Different levels of this dataset were available, as outlined below:
1. ZIP daily level
For the ZIP-level daily data, the 1 km total and nonfire PM2.5 estimates were aggregated to ESRI ZIP Code boundaries using the arithmetic mean for all grid points within each ZIP. Daily smoke PM2.5 at the ZIP level was then computed as the difference between the aggregated total and nonfire PM2.5 estimates.
Spatial Resolution: ESRI ZIP code
Temporal Resolution: daily
Temporal Coverage: Jan 2007 – Dec 2018
The data is available at: https://zenodo.org/records/17289804