Research on Impact of Immigration on the Well-being of U.S. Natives

Introduction and Motivation

Previous economic research has shown various economic and public health benefits of immigration policies such as Deferred Action for Childhood Arrivals (DACA) or the Development, Relief, and Education for Alien Minors  (DREAM) Act. In particular, DACA is a 2012 U.S. immigration policy that provided renewable work permits and freedom from deportation for a large number of undocumented immigrants. It is suggested to potentially improve the social welfare through four potential social determinants: economic stability, educational opportunities, social and community contexts, and access to health care.Accordingly, the termination of DACA by the Trump Administration in September 2017 has caused widespread sensation all over the U.S. As an international student, I was not familiar with the impact of immigration on the social welfare as well as the weight of such a monumental immigration policy in the hearts of U.S. population. Therefore, I want to investigate the economic and health outcomes of immigration on the well-being of U.S. natives in order to better understand the necessity of immigration policies of DACA and DREAM Act.

My original research with a concentration on the impact of immigration on the well-being of U.S. natives in terms of labor market competition and subjective well-being is inspired by the research on Happiness Economic by the 2015 Economics Nobel Prize recipient Sir Angus Deaton. According to Sir Angus Deaton’s research, economic growth is interrelated with subjective well-being (SWB). An analysis of the Gallup-Healthways Well-Being Index from 2008-2013 indicated the positive correlation between life evaluation and income.Furthermore, the study also suggests that the effects of economic growth on happiness are different in developed and developing countries. In a prospective study, I was inspired to investigate the impact of immigration on the well-being of U.S. natives across all states. The purpose of this study is to investigate how the spatial concentration of immigrants affects the life satisfaction of U.S. natives. The individual-level data on life satisfaction would be gathered from Gallup-Healthways Well-Being Index (GHWBI) poll and the data on immigrant population distribution would be collected from the Migration Policy Institute (MPI) Data Hub. On the other hand, the data on the U.S. population distribution across different age groups would be gathered from the Henry J. Kaiser Family Foundation Database, which is based on analysis of the Census Bureau’s March Current Population Survey. This study intends to examine the effect of immigration directly on the welfare of natives through constructing a linear regression model and plots of subjective well-being (SWB) against the regional statistics of MPI data. In addition, I intend to extract data on local unemployment rates, GDP, as well as the measure of life satisfaction by the Likert scale on ease of living, happiness, loneliness, and interest in life across all U.S. states.

Previous Research Findings

Economists have long focused on the impact of immigration on natives’ labor market outcomes such as wages and employment, which are objective measures of “welfare”. The typical approach has been to correlate these measures with the share of immigrants in local labor markets. The empirical evidence to date is rather mixed. For instance, while Borjas (2003) 3 finds negative effects of immigration on the wages of natives in the US, others find that the impact of immigration, if any, is negligible (Card, 1990, 2001) 4,5. More recently, Ottaviano and Peri (2012) 6document immigration as having a positive effect on the wages of high-skilled natives, and a negative effect on low-skilled natives. A longitudinal study in the UK finds minor impacts on unemployment, participation and wages – both economically and statistically (Dustmann et al., 2005) 7. Conversely, Manacorda et al. (2012) 8 find that since immigrants and natives are complements in production, there is no negative wage effect on the latter. However, the authors also find evidence that newly-arrived immigrants are substitutes in production with immigrants already residing in the UK. Analyzing the impact of immigration on the employment rates of native Germans, Pischke and Velling (1997) 9 find that immigration does not adversely impact natives’ employment. More recently, D’Amuri et al. (2010) 10 analyze both the wage and employment effects of immigration in West Germany, finding that immigration has essentially no impact on natives’ labor market outcomes, but has an adverse effect on previous immigrants.

Another strand of the literature has explored the impact of immigration on other outcomes while still using objective measures of welfare. For example, Dustmann et al. (2010) 11 analyze whether the immigration stemming from the EU enlargement toward Eastern Euro- pean countries affected UK public finances. They find that immigrants from the accession countries positively contributed to public finances, since they were found relatively more likely to be in work than natives, and less likely to access social benefits.

Finally a branch of the literature has started to explore the relationship between immigration and natives’ attitudes. For example, Card et al. (2005) 12 analyze European Social Survey data and conclude that while attitudes towards immigrants are partially shaped by economic factors, other aspects such as culture, and natives’ social status are important in affecting the way in which immigration is perceived. Moreover, Boeri (2010) 13 argues that the business cycle influences natives’ opinions towards immigrants. Other studies investigate the determinants of attitudes toward immigrants 14.

Methods

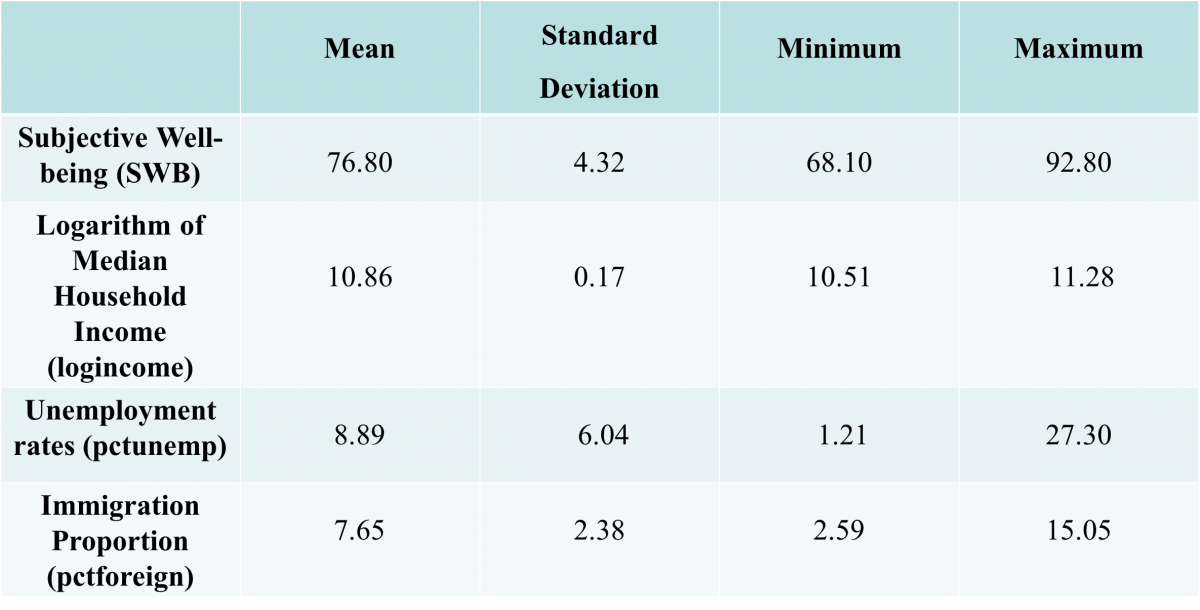
  1. The individual-level data of subjective well-being (SWB) variable is derived from responses of the question “Are you satisfied or dissatisfied with your standard of living?” in the Gallup Healthways Survey, which allows responses on an ordinal scale from 0 to 100.
  2. Gather state-level data on immigrant population through the demographic online research tool Social Explorer.
  3. Extract state-level data on local unemployment rates and the median household income levels through the Social Explorer online tool.
  4. Aggregate all the datasets into the the state-level data, and compile them for the same year.
  5. Construct a multiple linear regression model by using Stata.

Data Analysis

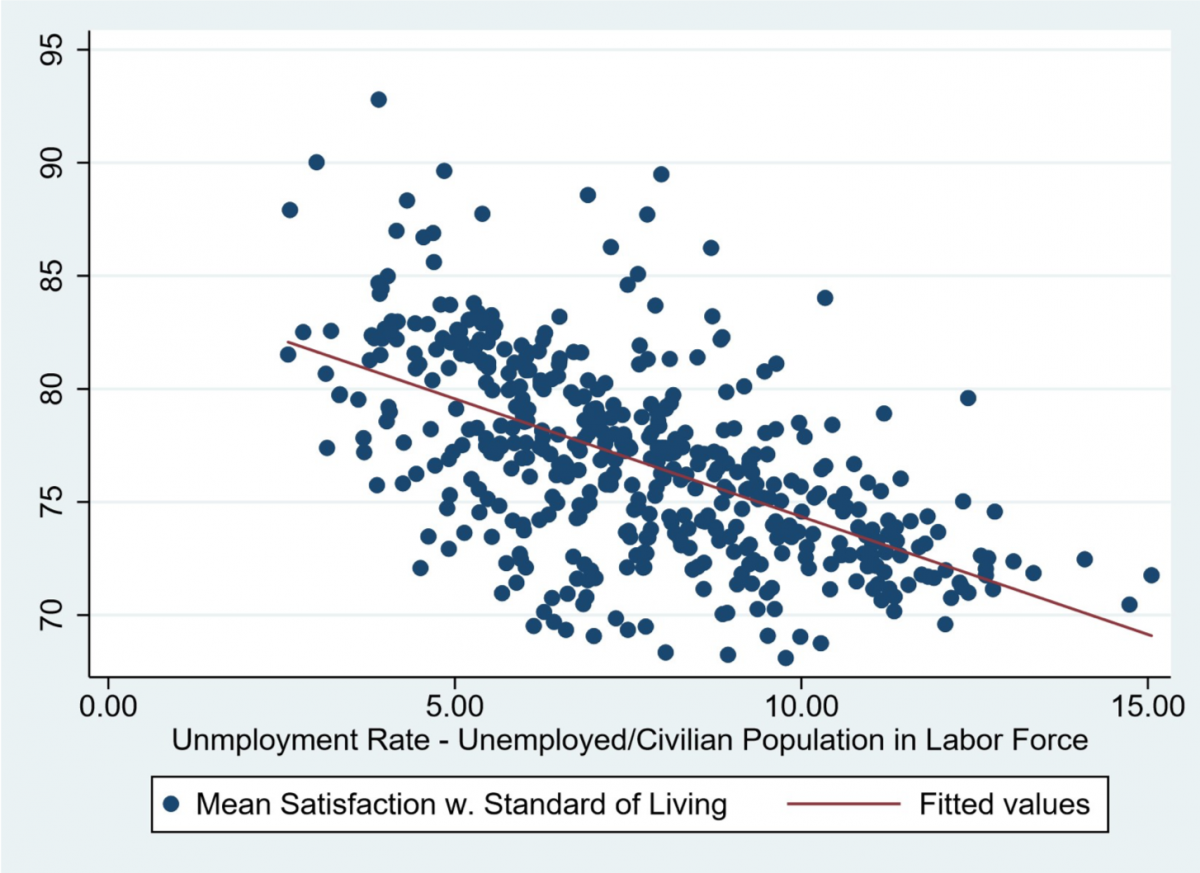
Figure 1. The scatterplot of the SWB index regressed against the unemployment rate in all U.S. states.

The negative slope coefficient of -0.851 and the significantly low p-value indicate that the percentage of unemployment is negatively associated with the subjective well-being.

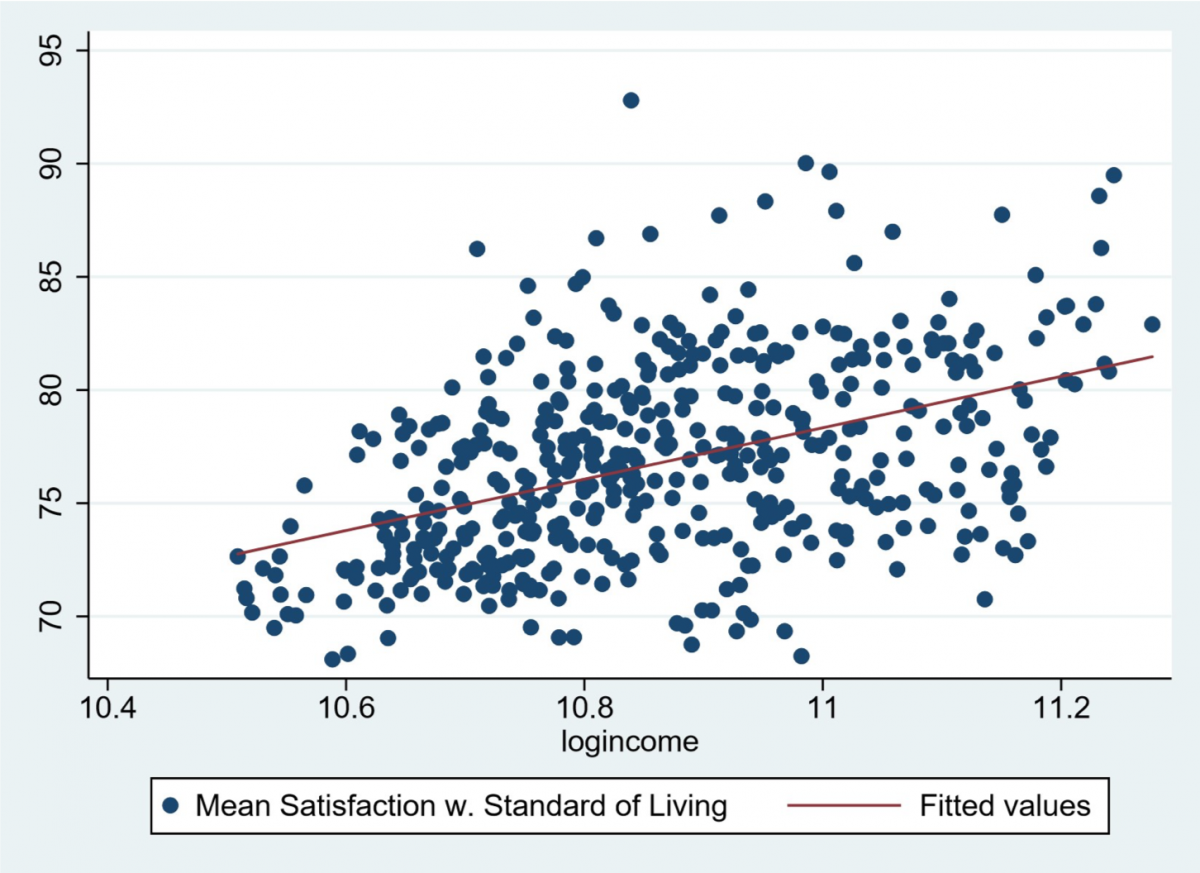
Figure 2. The scatterplot of the SWB index regressed against the logarithm of income in all U.S. states.

The significantly low p-value for the t test implies there is a linear relationship between the income level and the subjective well-being. Moreover, the positive slope coefficient 8.445 suggests that as income levels increase, the subjective well-being levels also rise.

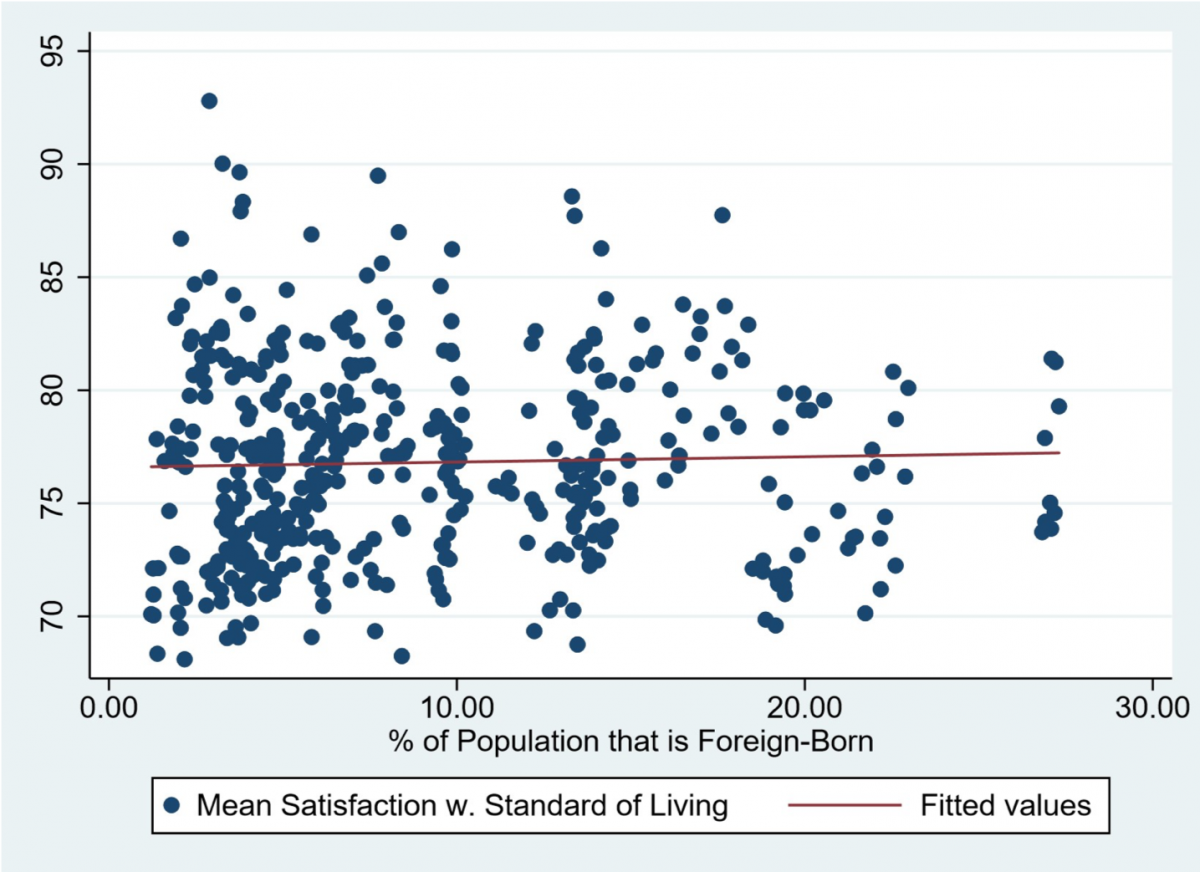
Figure 3. The scatterplot of the SWB index regressed against the immigrant population proportion in all U.S. states.

The slope coefficient -0.029 and the p-value of 0.41 indicates that there is insufficient evidence to reject the null hypothesis that there is no linear relationship between immigration population proportion and the subjective well-being, controlling for income level and unemployment rate.  

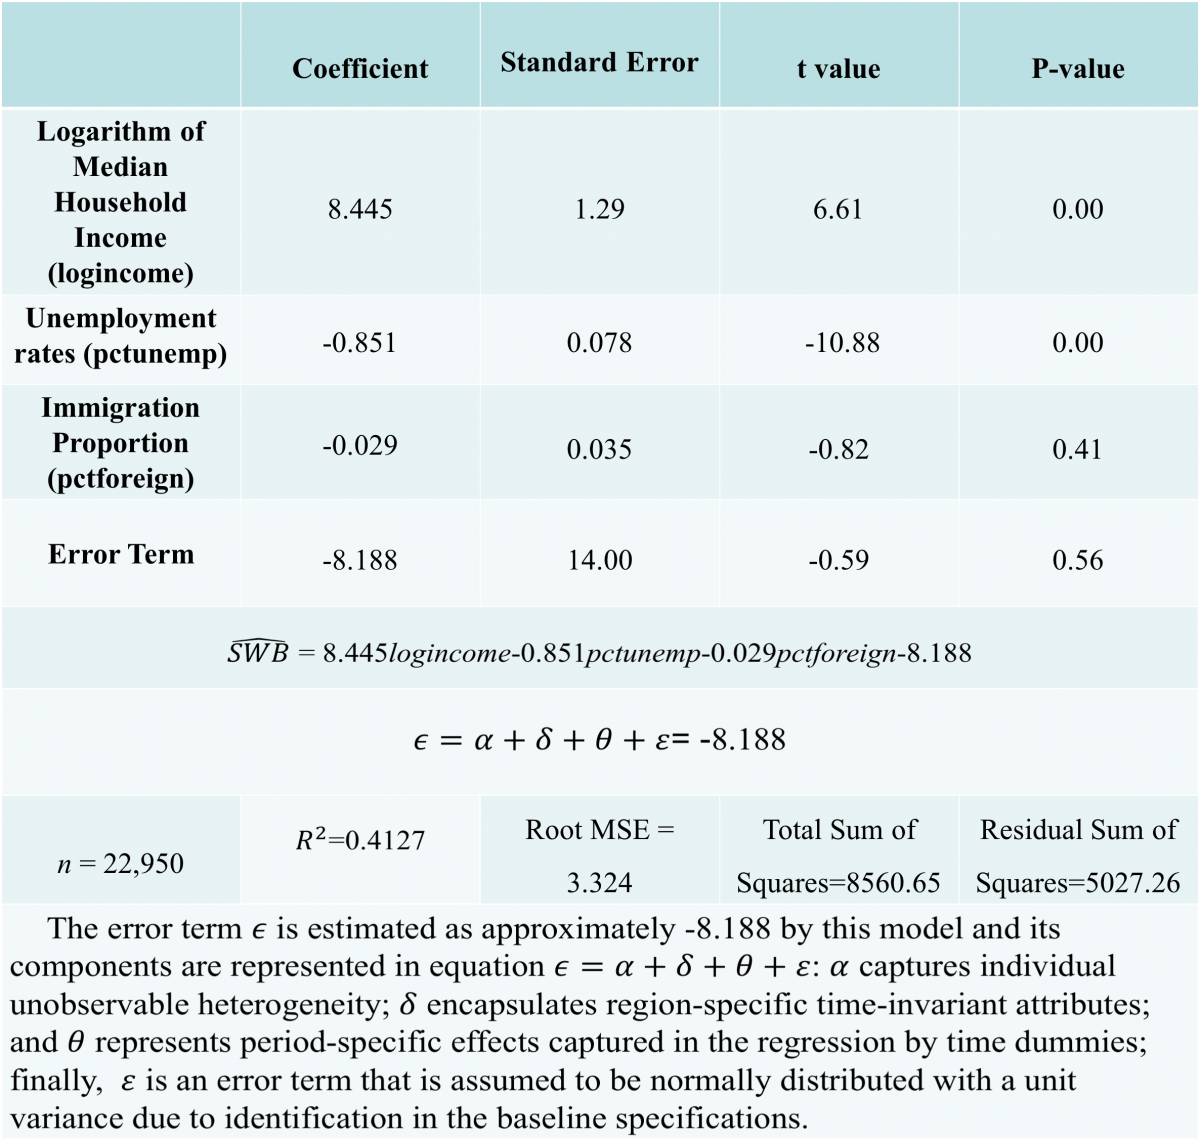
The multiple linear regression model of the subjective well-being of U.S. natives provides evidence that immigration generates no significant effect on natives’ subjective well-being (SWB), which is consistent with findings of study by D’Amuri et al. (2010). In fact, the subjective well-being levels of U.S. natives are predominately determined by local income level and the percentage of unemployment.


References:

  1. Sudhinaraset, May, et al.“The influence of deferred action for childhood arrivals on undocumented Asian and Pacific Islander young adults: through a social determinants of health lens.” Journal of Adolescent Health 60.6 (2017): 741-746.
  2. Case, Anne, and Angus Deaton. “Suicide, Age, and Wellbeing: an Empirical Investigation.” Suicide, Age, and Wellbeing: an Empirical Investigation, June 2015, pp. 2–43., doi:10.3386/w21279.
  3. Borjas, G. (2003). The labor demand curve is downward sloping: Reexamining the impact of immigration on the labor market. Quarterly Journal of Economics 118(4), 1335–1374.

  4. Card, D. (1990). The impact of the mariel boatlift on the Miami labor market. Industrial and Labor Relations Review 43(2), 245–257.
  5. Card, D. (2001). Immigrant inflows, native outflows, and the local labor market impacts of higher immigration. Journal of Labor Economics 19 (1), 22–64.
  6. Ottaviano, G. and G. Peri (2012). Rethinking the e↵ects of immigration on wages. Journal of the European Economic Association 10 (1), 152–197.
  7. Dustmann, C., F. Fabbri, and I. Preston (2005). The impact of immigration on the British labour market. Economic Journal 115(507), F324–F341.
  8. Manacorda, M., A. Manning, and J. Wadsworth (2012). The impact of immigration on the structure of wages: Theory and evidence from Britain. Journal of the European Economic Association 10(1), 120–151.
  9. Pischke, J. and J. Velling (1997). Employment e↵ects of immigration to Germany: An analysis based on local labor markets. Review of Economics and Statistics 79(4), 594– 604.
  10. D’Amuri, F., G. Ottaviano, and G. Peri (2010). The labor market impact of immigration in Western Germany in the 1990s. European Economic Review 54 (4), 550–570.
  11. Dustmann, C., T. Frattini, and C. Halls (2010). Assessing the fiscal costs and benefits of A8 migration to the UK. Fiscal Studies 31 (1), 1–41.
  12. Card, D. (2005). Is the new immigration really so bad? The Economic Journal 115(507), F300–F323.
  13. Boeri, T. (2010). Immigration to the land of redistribution. Economica 77(308), 651–687. 

  14.  Akay, Alpaslan, Amelie Constant, and Corrado Giulietti. “The impact of immigration on the well-being of natives.” Journal of economic Behavior & organization 103 (2014): 72-92.

The Chinese Mutual Funds Market Research Updates

Data Source and Implication

The research project is devised to study the assest management industry, and research the industrial organization implications of trend chasing by mutual fund investors. All the data from Wharton Research Data Services (WRDS) website were obtained from the data system of the Shenzhen Guo Tai An Education Tech Ltd. (GTA), a leading database company in China. The GTA database contains information on 966 Chinese mutual funds, including currency type funds, bond funds, index funds, and equity funds. Historical data and financial statements on China’s listed companies have been relatively complete since 1998.  Although returns of mutual funds were calculated in different time frames such quaterly, daily, or semiannually, the data were organized and standardized into annualised returns.

The data suggest that Chinese mutual funds market has become an increasingly crucial emerging market for international investors who seek to capture investment opportunities in China. 1 Given the expanding size of the country’s economy and its growing aging population needing to save for retirement, China’s mutual fund market has enormous potential for growth. However, Chinese regulations thwart all attempts by foreign fund managers to export mutual funds into China, requiring that all funds register with regulators in the country and comply with local rules. 2 Furthermore, the Chinese market requires that all fund sponsors must include Chinese-based companies. As a result, only through a joint venture with a Chinese company can foreign fund managers enter the Chinese mutual funds market. 2

Historical Descriptive Statistics

Table 1 shows the descriptive statistics used in a previous study published by Chen, H. & Chen, L.(2017). 1The mutual fund portfolio samples were categorized into five investment concentration levels per quarter: most concentrated, concentrated, common, diversified, and most diversified. When investors buy mutual funds in dollar amounts, the fund converts their investment into the exact number of shares based on the NAV at the time of their investment, even if that results in an odd number of shares. The unit of the net asset value (NAV) of mutual funds is one million Ren Min Bi (RMB). Net asset value (NAV) represents a fund’s per unit market value1. This is the price at which investors buy fund units from a fund company or sell it back to the fund. Net asset value is the daily value of a mutual fund that includes all the assets minus the fund’s liabilities converted to a per-share price. The NAV of each mutual fund share is calculated by dividing the net asset value of a mutual fund by the number of shares outstanding.

The result shown in Table 1 indicates that, the investment concentration level is inversely related to the NAV of equity mutual funds. The managers of equity mutual funds with a low NAV tend to be aggressive and take more investment risks 1. However, the portfolios classified by the industry concentration index are different from the portfolios classified by the risk level 1.


Notes: This table presents the descriptive statistics of portfolios under the evaluative criteria of the industry concentration index (ICI) and risk level. 1The industry concentration index (ICI) refers to the model proposed by Bollen and Busse (2005). 3 Risk level is obtained from the standard deviation of the residuals of the three-factor model of Fama and French (1993). 4 The study by Chen, H. & Chen, L.(2017) categorized the mutual fund sample objects into five investment concentration levels, quarter by quarter: most concentrated, concentrated, common, diversified, and most diversified portfolios. The unit of the net asset value (NAV) of mutual funds is million RMB. 1


The study published by Chen, H. & Chen, L.(2017) suggests that mutual fund managers prefer concentrating their holdings in industries where they have informational advantages over a well-diversified portfolio. The industry concentration index (ICI) is used as an essential indicator of this trend chasing by mutual fund investors. The result shown in Table 1 implies that, on average, more concentrated funds perform better after controlling for risk and style differences using various performance measures. Nevertheless, the study by Bollen and Busse (2005) discloses that superior performance is a temporary phenomenon that is observable only when funds are evaluated several times a year. 3 On the other hand, the result shown in Table 1 is buttressed by the three-factor model of Fama and French (1993), which is an asset pricing model that takes the size, value, and market risk factors into account to better measure market returns. 4 The model indicates that a security of a small firm with fewer capital assets tends to outperform that of a big-cap firm. On the other hand, a value stock, which is a security of a matured firm trading at a lower price, is likely to outperform a growth stock of a startup firm. In terms of market risk, small-cap stocks and value stocks are more susceptible to higher market risk and therefore they yield higher returns. As a conclusion, investment ability is more evident among managers who hold portfolios concentrated in a few industries.

Create Unique Identifier Example

(1) Use the data from File 1 “Daily_NAV.dta” and base the duplicate count solely on the variable “millionachievereturn“. Start by running the duplicates report command to see the number of duplicate rows in the dataset. This is followed by duplicate reports id, which gives the number of replicate rows by the variables specified; in this instance we have just “millionachievereturn.  We could have used the duplicates examples command instead of the duplicates report command.  The duplicates examples command lists one example of each duplicated set.

. use "Daily_NAV.dta", clear
. duplicates report millionachievereturn

Duplicates in terms of millionachievereturn


copies | observations surplus
-------+---------------------------
     1 |     1886      0
     2 |      966      483
     3 |      486      324
     4 |      156      117
     5 |      115      92
     6 |       18      15
     7 |        7      6
     8 |        8      7
    10 |       20      18
    11 |       11      10
1065187|  1065187      1065186
--------------------------------------

(2)To create a new variable nvalsnav from the existing variables symbol&millionachievereturn, whether each existing variable is string or numeric, type

. by symbol millionachievereturn, sort: gen nvalsnav = _n==1

This command creates a new variable nvalsnav that is 1 for the first observation for each individual and missing otherwise. _n is the Stata way of referring to the observation number; in a 10-observation dataset, _n takes on the values 1, 2, …, 10. When _n is combined with by, however, _n is the observation number within by-group, in this case, the existing variables symbol&millionachievereturn. If there were three existing variables symbol&millionachievereturn==1 observations followed by two existing variables symbol&millionachievereturn==2 observations in the dataset, _n would take on the values 1, 2, 3, 1, 2. Thus, by:if _n==1 is a way to refer to the first observation in each by-group.

. by symbol: replace nvalsnav = sum(nvalsnav)
(1,063,242 real changes made)

. by symbol: replace nvalsnav = nvalsnav[_N]
(3,661 real changes made)
. su nvalsnav

Variable | Obs         Mean   Std. Dev. Min Max
---------+-------------------------------------------------
nvalsnav | 1,068,860 1.950879 16.18818   1  286

. merge 1:m returnminusbenchmark using "/Users/yfeng47/Downloads/Daily NAV.dta"

(3)Execute one-to-many merge on variable returnminusbenchmark. The command merge joins corresponding observations from the dataset currently in memory (called the master dataset) with those from File 1 “Daily_NAV.dta” and File 2 “Fund NAV Performance.dta”, matching on the variable returnminusbenchmark.

. * merge Daily NAV.dta with Fund NAV Performance.dta

. use "Daily NAV.dta", clear

. browse

(4) Use the command isid to check whether the specified variables uniquely identify the observations.

. isid fundclassid tradingdate

. duplicates report fundclassid tradingdate

Duplicates in terms of fundclassid tradingdate

--------------------------------------
copies | observations surplus
-------+---------------------------
     1 |      1068860   0
--------------------------------------

. distinct fundclassid

Observations|   total distinct
------------+----------------------
fundclassid | 1068860 5618

. distinct symbol

Observations|   total distinct
------------+----------------------

    symbol  | 1068860  5618

. duplicates report symbol tradingdate

Duplicates in terms of symbol tradingdate

--------------------------------------
copies | observations surplus
-------+---------------------------
     1 |     1068860    0
--------------------------------------

. isid fundclassid tradingdate

. isid symbol tradingdate

. browse

. compress
variable tradingdate was long now int
variable symbol was str10 now str6
variable currencycode was str4 now str3
variable currency was str50 now str4
variable frequency was str100 now str4
(159,260,140 bytes saved)

. save "Daily_NAV.dta", replace
(note: file Daily_NAV.dta not found)
file Daily_NAV.dta saved

Conclusion: Either fund class ID or symbol, when combined with trading date, can uniquely identify each observation of data in the file.

Future Directions:

Unfortunately, the research project is discontinued because of the inconsistency of the data which hinders the next stage of running regressions and devising models to predict Chinese mutual fund investors’ behavior.  The new project will probably still investigate the Chinese Mutual Funds Market but with a focus on analysis of different data sets. Please stay tuned.


References:

1. Chen, H., & Chen, L. (2017). An Analysis of the Investment Concentration of Equity Mutual Funds in China. 53(3), 511-520. doi:10.1080/1540496X.2015.1093846

2. Hamacher, Theresa, and Robert C. Pozen. “In China, Big Opportunities for Investors, If Mutual Funds Can Find a Way In.” Brookings, Brookings, 28 July 2016, www.brookings.edu/opinions/in-china-big-opportunities-for-investors-if-mutual-funds-can-find-a-way-in/.

3. Bollen, N. P. B., and J. A. Busse. 2005. Short-term persistence in mutual fund performance. Review of Financial Studies 18 (2):569–97. doi:10.1093/rfs/hhi007.

4. Fama, E. F., and K. R. French. 1993. Common risk factors in the returns on stocks and bonds. Journal of Financial Economics 33 (1):3–56. doi:10.1016/0304-405X(93)90023-5.


Chinese Mutual Funds Market Research

About Myself

My name is Yining Feng and I am a junior majored in Economics in the Emory College. I am also minored in Predictive Health, and I have been a pre-med student for 2 years at the Oxford College of Emory University. I am considering pursuing the dgree of doctor of dental surgery (DDS) or a master of business administration (MBA). If there is a joint degree program DDS/MBA avaible, then I am planning on pursuing both degrees simultaneously.

My Research

I am currently assisting Dr. Jeong Ho Kim with his research project on the Measuring Mutual Funds skills, with a particular focus of the Chinese Mutual Funds Market. The research project is devised to study the assest management industry, and research the industrial organization implications of trend chasing by mutual fund investors. The economics term mutual fund refers to an investment company that brings together money from many investors and invests it in stocks, bonds or other assets.1 The combined holdings of these underlying assets the fund owns are known as its portfolio. Each investor in the fund owns shares, which represent a part of these holdings. 1 My tasks during the first stage of the research include reviewing related literature, collecting organizing, and cleaning data about Chinese Mutual Funds Market from the Wharton Research Data Services (WRDS) website. I have learnt and enhanced my skill of using Stata or R software for data cleaning throughout this process. In the second stage of the research, I am expected to run regressions and estimate models for the data of Mutual Funds.

What has previous research shown?

The data collected by Citibank in 2012 suggest that 28% of China’s financial assets under management (AUM) are held in mutual funds (Exhibit 1). The Chinese Mutual Funds Market is still under the developing stage due to the lack of market participation of Chinese people with huge amounts of saving. 2 Nevertheless, the Chinese assest management industry still displays a bright future because of the increasing interest from outside the industry both from foreign financial firms and large domestic corporations as passive investors. 2 The distribution structure of the Chinese market emphasizes the culture of short-term trading. The tendency of short-term mentality among Chinese investors leads to a significantly different business model for the Chinese fund industry compared with the American industry. While U.S. investment managers have carefully considered fund launches, the Chinese industry has constantly created new funds since 2010. 3

Current Outlook of the Chinese Mutual Funds Market

The Chinese economy has maintained a stable growth since 2014, as evidenced by the constant GDP annual growth rate around 7% (Exhibit 2). The steady growth of the economy is attributed to an industrial sector recovery, strong credit growth, fast-growing information technology sector and a booming real estate sector.4

Exhibit 2: China GDP Annual Growth Rate (July 2014-July 2017)

Overall, the output of services has accounted for more than half of the Chinese economy since 2015. The 2017 report by the National Bureau of Statistics suggests that commercial leasing, transportation and storage, as well as the information technology sectors together account for the biggest source of Chinese economic growth. The 19.2% growth rate of the information technology sector is ranked the highest during the 1st quarter of 2017; the 8.8% growth rate of the transportation and storage sector is preceded by the second highest growth rate of 10.1% in the leasing and commercial services sector; the growth rate of the real estate sector also reached 7.9%; both the lodging & catering sector and the retail and wholesale sector rose 7.4% at the fastest pace ever since 2014 (Exhibit 3).

Exhibit 3: The First-quarter Growth Rate of Chinese Service Sectors in 2017

Data Collection and Cleaning

There are three basic types of mutual funds including equity funds that invest in stocks, fixed-income funds that invest in bonds, balanced funds that invest in both stocks and bonds, and money market funds that seek the risk-free rate.5 The data cleaning process began with identifying duplicates based on specific characteristics for distinguishing between variable subsets.The duplicates report generated by the Stata software showed that there were in total 185 unique mutual funds with complete investment concentration data available since 1998. During the sample selection and information processing procedures, invalid data were excluded from the analysis. The historical data, including data on value-weighted stock index monthly returns and investment concentration, were obtained from the WRDS database.

Stata Duplicate Report Example

(1) Use the data from File 1 “Funds Main Info” and base the duplicate count solely on the variable “Fund ID“. Start by running the duplicates report command to see the number of duplicate rows in the dataset. This is followed by duplicate reports id, which gives the number of replicate rows by the variables specified; in this instance we have just “fundid”.  We could have used the duplicates examples command instead of the duplicates report command.  The duplicates examples command lists one example of each duplicated set.

use "C:\Users\jkim230\Dropbox\Data\csmar\fund_maininfo.dta", clear

duplicates report fundid
*
* Duplicates in terms of fundid
*
* --------------------------------------------------------
* copies |     observations      surplus
* -------+------------------------------------------------
*      1 |             1552            0
* --------------------------------------------------------
**********************************************************

(2) Use the data from File 2 “Fund Unit Class Info” and base the duplicate count solely on the variable “Fund Class ID“. The subsequent procedure is the same as step (1).

use "C:\Users\jkim230\Dropbox\Data\csmar\fund_unitclassinfo.dta", clear

duplicates report fundclassid
*
* Duplicates in terms of fundclassid
*
* -------------------------------------------------------------
* copies |        observations            surplus
* ------ +-----------------------------------------------------
*      1 |                3120                  0
* -------------------------------------------------------------

by fundclassid fundid, sort: gen nvals = _n==1
by fundclassid: replace nvals = sum(nvals)
by fundclassid: replace nvals = nvals[_N]

su nvals
*
* Variable |   Obs      Mean     Std. Dev.      Min        Max
-----------+-----------------------------------------------------
*    nvals |  3,120        1            0         1          1
*****************************************************************
use "C:\Users\jkim230\Dropbox\Data\csmar\fund_maininfo.dta", clear

(3) Merge the mutual funds data from File 1 with that of File 2. Merge is for adding new variables from a second dataset to existing observations. Perform the command of one-to-many merge on specified key variables.

merge 1:m fundid using "C:\Users\jkim230\Dropbox\Data\csmar\fund_unitclassinfo.dta"
*
* Result                           # of obs.
* ---------------------------------------------------------------
* not matched                         819
* from master                           0 (_merge==1)
* from using                          819 (_merge==2)
*
* matched                           2,301 (_merge==3)
* ---------------------------------------------------------------

save "C:\Users\jkim230\Dropbox\Data\csmar\asdf.dta", replace
*****************************************************************
use "C:\Users\jkim230\Dropbox\Data\csmar\fund_promoter.dta", clear

(4) The command duplicates report of the merged file shows that there are 185 unique fundid values.

duplicates report fundid declaredate institutionid
*
* Duplicates in terms of fundid declaredate institutionid
*
* ----------------------------------------------
* copies    | observations     surplus
* ----------+-----------------------------------
*      1    |          185           0
* ----------------------------------------------

***************************************************************

Future Directions:

The second stage of the research is to run regressions and esetimate models describing Chinese mutual funds managers’ abilities of stock-picking and market-timing based on the comparison of the effects of performance persistence between concentrated mutual funds and diversified mutual funds. The first step is to test whether the managers of concentrated equity mutual funds have greater stock-picking abilities than do diversified equity mutual funds based on regressions and models used to estimate the stock-picking abilities of mutual fund managers.


References

  1. “Mutual Funds.” SEC Emblem, U.S. Securities and Exchange Commission, 14 Dec. 2010, www.sec.gov/fast-answers/answersmutfundhtm.html.
  2. Sahai, Neeraj, and Peter L. Alexander. “Asset Manangement Overview.” China: The World’s Best Opportunity for Assest Managers?, 12 June 2012, pp. 7–11., www.citibank.com/transactionservices/home/about_us/articles/docs/china_asset.pdf.
  3. Hamacher, Theresa, and Robert C. Pozen. “In China, Big Opportunities for Investors, If Mutual Funds Can Find a Way In.” Brookings, Brookings, 28 July 2016, www.brookings.edu/opinions/in-china-big-opportunities-for-investors-if-mutual-funds-can-find-a-way-in/.
  4. Vickery, Mark. “3 China Mutual Funds To Buy As The Economy Expands In Q1.” Seeking Alpha, Zacks Investment Research, 20 Apr. 2017, seekingalpha.com/article/4063680-3-china-mutual-funds-buy-economy-expands-q1.
  5. Chen, H., & Chen, L. (2017). An Analysis of the Investment Concentration of Equity Mutual Funds in China. 53(3), 511-520. doi:10.1080/1540496X.2015.1093846