

Data Source and Implication
The research project is devised to study the assest management industry, and research the industrial organization implications of trend chasing by mutual fund investors. All the data from Wharton Research Data Services (WRDS) website were obtained from the data system of the Shenzhen Guo Tai An Education Tech Ltd. (GTA), a leading database company in China. The GTA database contains information on 966 Chinese mutual funds, including currency type funds, bond funds, index funds, and equity funds. Historical data and financial statements on China’s listed companies have been relatively complete since 1998. Although returns of mutual funds were calculated in different time frames such quaterly, daily, or semiannually, the data were organized and standardized into annualised returns.
The data suggest that Chinese mutual funds market has become an increasingly crucial emerging market for international investors who seek to capture investment opportunities in China. 1 Given the expanding size of the country’s economy and its growing aging population needing to save for retirement, China’s mutual fund market has enormous potential for growth. However, Chinese regulations thwart all attempts by foreign fund managers to export mutual funds into China, requiring that all funds register with regulators in the country and comply with local rules. 2 Furthermore, the Chinese market requires that all fund sponsors must include Chinese-based companies. As a result, only through a joint venture with a Chinese company can foreign fund managers enter the Chinese mutual funds market. 2
Historical Descriptive Statistics
Table 1 shows the descriptive statistics used in a previous study published by Chen, H. & Chen, L.(2017). 1The mutual fund portfolio samples were categorized into five investment concentration levels per quarter: most concentrated, concentrated, common, diversified, and most diversified. When investors buy mutual funds in dollar amounts, the fund converts their investment into the exact number of shares based on the NAV at the time of their investment, even if that results in an odd number of shares. The unit of the net asset value (NAV) of mutual funds is one million Ren Min Bi (RMB). Net asset value (NAV) represents a fund’s per unit market value1. This is the price at which investors buy fund units from a fund company or sell it back to the fund. Net asset value is the daily value of a mutual fund that includes all the assets minus the fund’s liabilities converted to a per-share price. The NAV of each mutual fund share is calculated by dividing the net asset value of a mutual fund by the number of shares outstanding.![]()
The result shown in Table 1 indicates that, the investment concentration level is inversely related to the NAV of equity mutual funds. The managers of equity mutual funds with a low NAV tend to be aggressive and take more investment risks 1. However, the portfolios classified by the industry concentration index are different from the portfolios classified by the risk level 1.
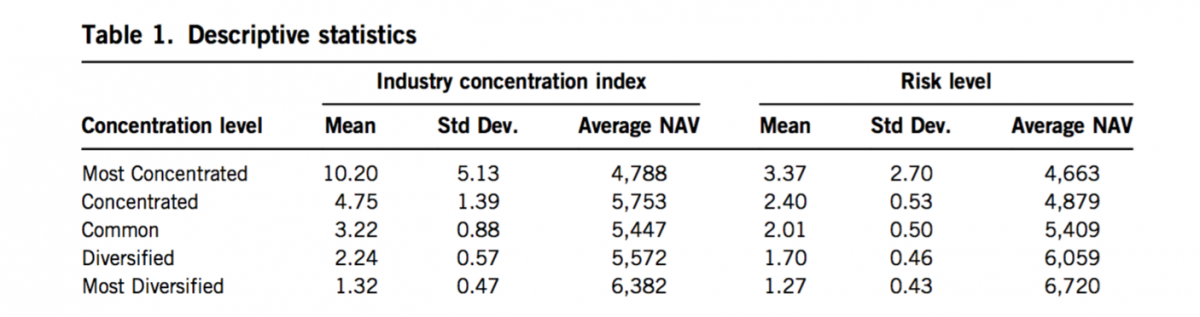
Notes: This table presents the descriptive statistics of portfolios under the evaluative criteria of the industry concentration index (ICI) and risk level. 1The industry concentration index (ICI) refers to the model proposed by Bollen and Busse (2005). 3 Risk level is obtained from the standard deviation of the residuals of the three-factor model of Fama and French (1993). 4 The study by Chen, H. & Chen, L.(2017) categorized the mutual fund sample objects into five investment concentration levels, quarter by quarter: most concentrated, concentrated, common, diversified, and most diversified portfolios. The unit of the net asset value (NAV) of mutual funds is million RMB. 1
Create Unique Identifier Example
(1) Use the data from File 1 “Daily_NAV.dta” and base the duplicate count solely on the variable “millionachievereturn“. Start by running the duplicates report command to see the number of duplicate rows in the dataset. This is followed by duplicate reports id, which gives the number of replicate rows by the variables specified; in this instance we have just “millionachievereturn”. We could have used the duplicates examples command instead of the duplicates report command. The duplicates examples command lists one example of each duplicated set.
. use "Daily_NAV.dta", clear
. duplicates report millionachievereturn
Duplicates in terms of millionachievereturn
copies | observations surplus
-------+---------------------------
1 | 1886 0
2 | 966 483
3 | 486 324
4 | 156 117
5 | 115 92
6 | 18 15
7 | 7 6
8 | 8 7
10 | 20 18
11 | 11 10
1065187| 1065187 1065186
--------------------------------------
(2)To create a new variable nvalsnav from the existing variables symbol&millionachievereturn, whether each existing variable is string or numeric, type
. by symbol millionachievereturn, sort: gen nvalsnav = _n==1
This command creates a new variable nvalsnav that is 1 for the first observation for each individual and missing otherwise. _n is the Stata way of referring to the observation number; in a 10-observation dataset, _n takes on the values 1, 2, …, 10. When _n is combined with by, however, _n is the observation number within by-group, in this case, the existing variables symbol&millionachievereturn. If there were three existing variables symbol&millionachievereturn==1 observations followed by two existing variables symbol&millionachievereturn==2 observations in the dataset, _n would take on the values 1, 2, 3, 1, 2. Thus, by …: … if _n==1 is a way to refer to the first observation in each by-group.
. by symbol: replace nvalsnav = sum(nvalsnav)
(1,063,242 real changes made)
. by symbol: replace nvalsnav = nvalsnav[_N]
(3,661 real changes made)
. su nvalsnav
Variable | Obs Mean Std. Dev. Min Max
---------+-------------------------------------------------
nvalsnav | 1,068,860 1.950879 16.18818 1 286
. merge 1:m returnminusbenchmark using "/Users/yfeng47/Downloads/Daily NAV.dta"
(3)Execute one-to-many merge on variable returnminusbenchmark. The command merge joins corresponding observations from the dataset currently in memory (called the master dataset) with those from File 1 “Daily_NAV.dta” and File 2 “Fund NAV Performance.dta”, matching on the variable returnminusbenchmark.
. * merge Daily NAV.dta with Fund NAV Performance.dta
. use "Daily NAV.dta", clear
. browse
(4) Use the command isid to check whether the specified variables uniquely identify the observations.
. isid fundclassid tradingdate
. duplicates report fundclassid tradingdate
Duplicates in terms of fundclassid tradingdate
--------------------------------------
copies | observations surplus
-------+---------------------------
1 | 1068860 0
--------------------------------------
. distinct fundclassid
Observations|   total distinct

------------+----------------------
fundclassid | 1068860 5618
. distinct symbol
Observations| total distinct
------------+----------------------
symbol | 1068860 5618
. duplicates report symbol tradingdate
Duplicates in terms of symbol tradingdate
--------------------------------------
copies | observations surplus
-------+---------------------------
1 | 1068860 0
--------------------------------------
. isid fundclassid tradingdate
. isid symbol tradingdate
. browse
. compress
variable tradingdate was long now int
variable symbol was str10 now str6
variable currencycode was str4 now str3
variable currency was str50 now str4
variable frequency was str100 now str4
(159,260,140 bytes saved)
. save "Daily_NAV.dta", replace
(note: file Daily_NAV.dta not found)
file Daily_NAV.dta saved
Conclusion: Either fund class ID or symbol, when combined with trading date, can uniquely identify each observation of data in the file.
Future Directions:
Unfortunately, the research project is discontinued because of the inconsistency of the data which hinders the next stage of running regressions and devising models to predict Chinese mutual fund investors’ behavior. The new project will probably still investigate the Chinese Mutual Funds Market but with a focus on analysis of different data sets. Please stay tuned.
References:
1. Chen, H., & Chen, L. (2017). An Analysis of the Investment Concentration of Equity Mutual Funds in China. 53(3), 511-520. doi:10.1080/1540496X.2015.1093846
2. Hamacher, Theresa, and Robert C. Pozen. “In China, Big Opportunities for Investors, If Mutual Funds Can Find a Way In.” Brookings, Brookings, 28 July 2016, www.brookings.edu/opinions/in-china-big-opportunities-for-investors-if-mutual-funds-can-find-a-way-in/.
3. Bollen, N. P. B., and J. A. Busse. 2005. Short-term persistence in mutual fund performance. Review of Financial Studies 18 (2):569–97. doi:10.1093/rfs/hhi007.
4. Fama, E. F., and K. R. French. 1993. Common risk factors in the returns on stocks and bonds. Journal of Financial Economics 33 (1):3–56. doi:10.1016/0304-405X(93)90023-5.
To be honest, everybody should read this. I think you have the tone and style of academic writing spot on. I know nothing about Chinese mutual funds, so it’s hard to say if you are understanding your research perfectly but I suspect you are doing just fine.
I will point out there are a few slight typos scattered throughout the text. You can fix this next time but running your text through a spell checker program before posting.
In the introduction you state:
You should define these terms somehow, preferable numerically in some way. It isn’t clear what these categories mean (to me at least) and how I should be thinking about them.
It appears that, while this is true the ICI values are different from Risk level, the inverse relationship between the two (IVI or Risk Level vs NAV) remains. Then what is the real point of this statement? The conclusion you come to seems to be unchanged.
So this is clearly unaffected by the choice of ICI vs Risk Level. Am I correct?
Also you could elaborate a bit more (just a few words) on what style differences and performance measures you controlled for other than ICI vs Risk Level and the 5 categorizations.
So when picking a Chinese mutual fund I should stick with smaller investment managers who understand a handful of industries instead of going for the big diversified investment house, if I want to get the largest returns?
When you display code, you can display it as code by using the html tags ‘ ‘
$sudo example foo
I wrote as
(I have no idea until I submit if that worked, by the way)
Are you using stata to run your regressions or different software? It’s unfortunate that you have to discontinue the project after creating such a model. Is there a particular reason for why you suspect much of the data has been inconsistent?