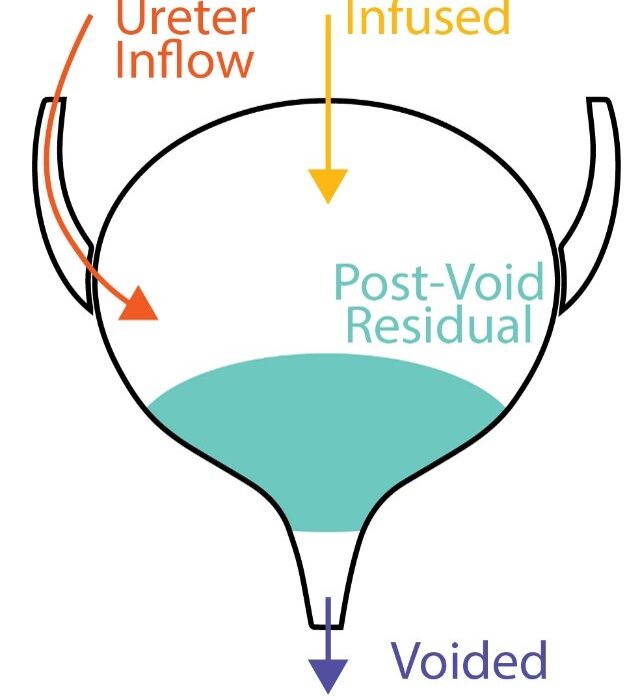
The most natural way to test how well the bladder and lower urinary tract (LUT) are working is to monitor what it does with urine in a process called cystometry (part of the perhaps more familiar battery of LUT health tests called urodynamics). Usually, the goal is to hold all the urine until the moment one wants to pee (i.e., voiding) then push out every last drop until empty, so we can make room for the next cup of coffee. We quantify this as the “Voiding Efficiency“, which expresses the fraction of the total urine we were able to void for any given attempt.
\(VE \equiv \frac{Voided}{Voided + Residual} = \frac{V_v}{V_v + V_r}\)The above equation gives the precise voiding efficiency (VE) definition, which is the ratio of the voided volume (Vv) to all the volume it was possible to void (which is represented in the denominator as everything that was voided (Vv) plus everything left over as residual (Vr)). From the equation it is clear that VE lives between zero (when nothing is voided – a total disaster) and one (when nothing is left over, Vr=0, and VE then equals Vv/Vv=1). Perfect: measure Vv, then measure Vr, then calculate VE, and we’re done.
Scientists run studies to test all sorts of different drugs, nerve stimulations, or other interventions to treat LUT problems (often in animal experiments); when an intervention is working well we get a VE near 1 and when it isn’t working we get a lower VE. This is how VE (and a host of other cystometric parameters) helps us decide what experimental therapies have promise.
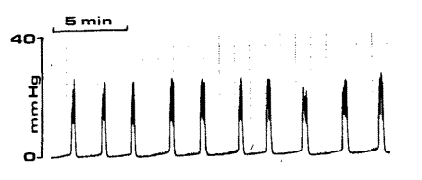
Now for the problem: when scientists run studies to test experimental interventions we need to test it many times (meet my friend, Central Limit Theorem) to get an idea of how effective it is on average, which prevents us from measuring Vr after each void. To see the problem, look at the plot below. The left graph shows bladder pressure (vertical) through time (horizontal) as the bladder experiences repeated filling (low pressure intervals) and voiding (high pressure “spikes”). The bladder is continuously filled with fluid to evoke these repeated cycles in quick succession. We can’t stop the study to measure the residual after every void, which means we are missing the Vr in our voiding efficiency equation, and we’re in the dark about that important parameter.
Aside: We don’t interrupt these cycles to measure Vr for many technical reasons reasons. Among them are 1) bladder trauma of repeated measurements that involve sucking out residual bladder fluid and 2) the fact that the bladder does not typically start empty in pathological situations we study, like underactive bladder, so repeated measurements breaks the model we are studying.
At first it may seem possible to infer the Vr because we know Vv and the infused volume (Vi), but this unfortunately doesn’t quite work. The thought is if we subtract what came out (Vv) from what we put in (Vi) then the remainder must be what got left behind in the bladder (Vr). Not so, because this overlooks another source of input that we typically cannot measure: urine entering the bladder through the ureters from the kidneys (Vu). In fact, we have shown that over even short periods neglecting this leads to big errors. The situation we’re really in for every void is as follows:
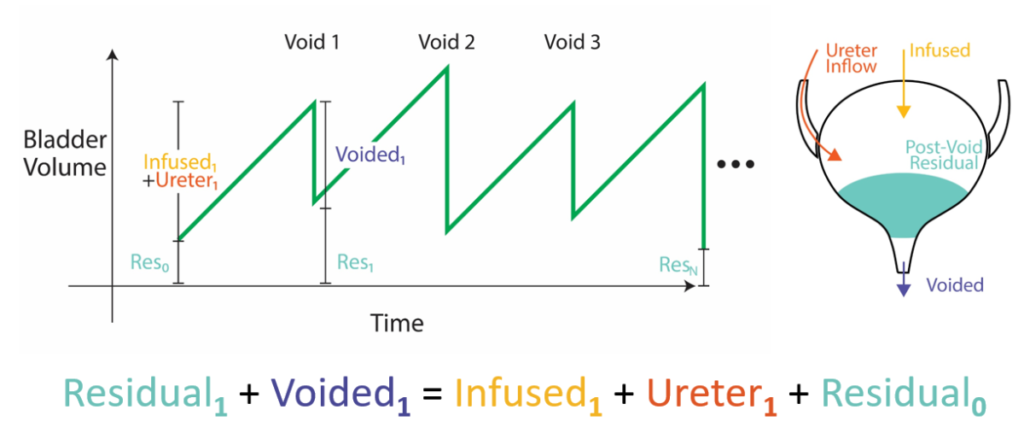
\(V_r^{k}=V_i^{k}+V_u^{k}-V_v^{k}+V_r^{k-1}\)Meaning the Vr for the kth void is everything that went in (Vi and Vu) minus what went out (Vv) and also plus whatever was left over from the previous void (the k-1th Vr), since we’re in a series of voids now. The equation is shown as a diagram below, where volume builds up in the bladder (green) over time and the contributing sources are broken down before and after each void. The problem is tricky since we don’t know either the previous Vr (after all, that’s what we’re trying to calculate in the first place) nor the unmeasured Vu.
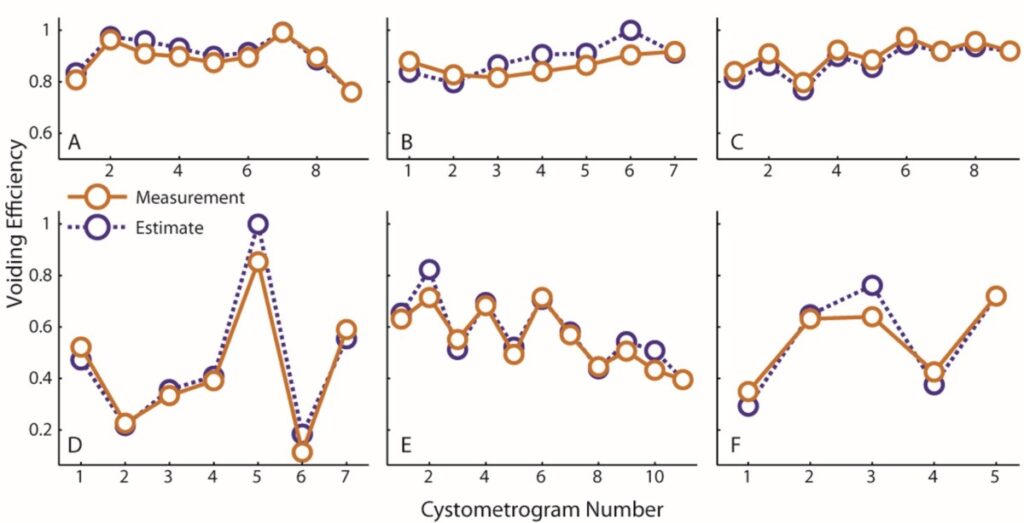
The solution: It turns out that if we assume that new volume enters via the ureters at a constant rate and we measure the Vr only once after the entire series of voids in the experiment is done, then we can get a very good estimate of all the Vr’s in the entire series of voids. The solution works by noticing that you can continually substitute expressions into the previous Vr term until you get all the way back to the start of the experiment when you know the bladder is empty (the full derivation is in the 2016 paper). We ran specialized studies where we compared the VE estimates we got from this method (purple) against actual measurements taken at every void (orange) and found very good agreement, effectively validating the procedure. That is, now we have a way to run many uninterrupted fill-to-void cycles and still get the voiding efficiency parameter we wanted, thus both having and eating our cake.
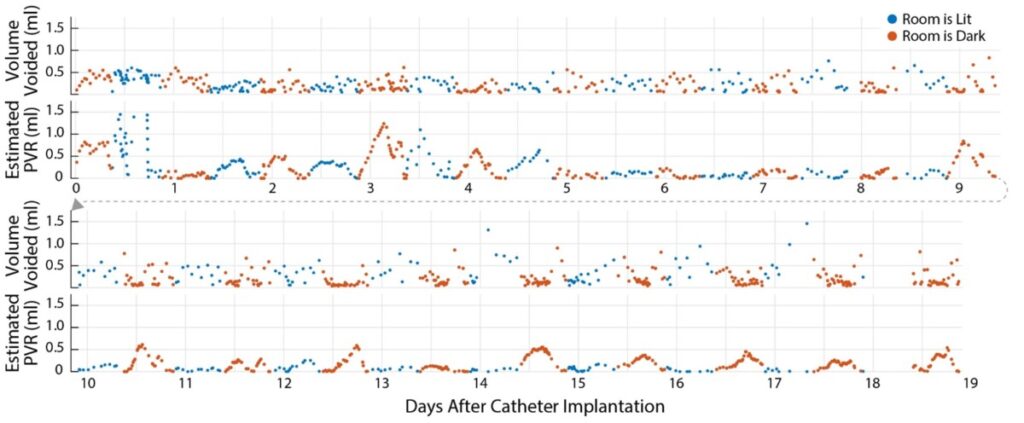
We pushed this solution to its limits when we allowed our animal cystometry fill-to-void series to run all day, rather than just the typical 5-8 in a row. In that work, we monitored animals continuously in their metabolic cages and were able to infer their residual volumes accurately across 12 hours at a time, under natural renal filling (i.e., we didn’t infuse anything into their bladders to increase the frequency of voiding).
The image below shows all the residual volumes (Vr, or equivalently PVR) for an animal over 19 days – a world first. It led us to, among other things, a detailed characterization of the diurnal patterns of the animals (i.e., rats do more with their urine than just try to get rid of it when they’re awake). The algorithm expansion that permitted this longer term accuracy was to try to get the ureter inflow as constant as possible (via optimization) rather than forcing them to be strictly equal.
The technique opens the door to more accurate, long-term assessments of experimental interventions for the treatment of LUT dysfunction.
Resources:
We call the algorithm that estimates Vu and VE the Automatic Monitoring for Efficient, Awake, Sensitive, Urine Residual Estimation algorithm, or AMEASURE. In the file archive below you will get the MATLAB code to run the AMEASURE algorithm, a script to walk you through working with the algorithm, and CMG data in Excel workbooks for an acute cystometry study and a weeks-long bladder monitoring study. The data are provided to get you started with using the algorithm and to demonstrate proper data formatting if you prefer to store date in Excel (rather than as variables in the MATLAB workspace).
Danziger, Z. C. and W. M. Grill (2016). “Estimating postvoid residual volume without measuring residual bladder volume during serial cystometrograms.” Am J Physiol Renal Physiol 311(2): F459-468.
Angoli, D., et al. (2020). “Validation of an efficient and continuous urodynamic monitoring system for awake, unrestrained, chronic rodent studies.” Am J Physiol Renal Physiol 318(1): F86-F95.