TRANSLATIONAL DIGITAL MEDICINE
The RTA team has been engaged in rapid development of applications to serve the Emory clinical community. These applications and dashboards have brought out the power of medical informatics and Real Time Analytics to provide interactive support to clinicians and streamline caregiving. The RTA system has also been used to improve clinical trials recruitment, particularly to screen for COVID-19 patients eligible for monoclonal antibodies where identifying the right patient at the right time is of paramount importance.
The successes have spurred the RTA team to propose the development of an enhanced and re-engineered Covid-19 application with the following goals:
- Present critical data on Covid-19 patients.
- Create ‘Power User’ role which will be assigned to clinicians in charge of care-giving.
- Enable clinical annotations to be entered and saved by power users of the application.
- Allow power users to designate events of interest/concern for patients.
- Enable messaging in the form of email alerts when events of interest occur.
CURRENT STATE OF THE COVID-19 APPLICATION
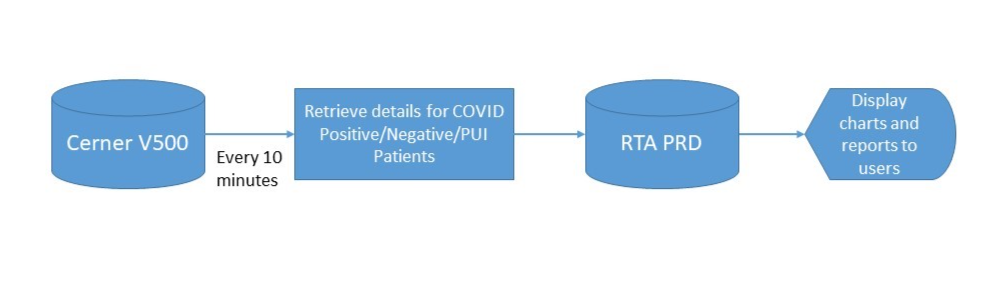
Patients who have been tested for Covid along with their test results and vitals are retrieved from the Cerner V500 database at 10-minute intervals. This data is presented in the form of charts and tables. Users can view the breakdown of the counts of positive, negative and persons under investigation by facility. In addition, MEWS data for patients with a MEWS score greater than 4 and ICU patients at risk for CRRT are displayed as tables. Ventilator monitoring charts are shown for each patient in the ICU. Time series charts in the application provide patient counts over time for the past 6 months. The current application is read-only, providing information to users in real time.
PROPOSED ENHANCED COVID-19 APPLICATION
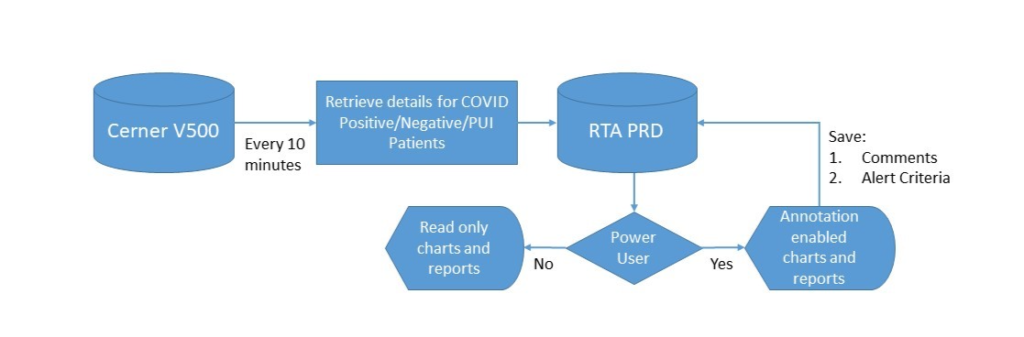
We propose to build a secure and robust application that will enable us to provide annotation capabilities to power users (Figure 2). Authorized users will be able to not just view the charts and tables but will also be enabled to annotate individual charts and patients, save the annotations and set up alerts when certain conditions/events transpire. This will make the application more useful, alerting the power users to changes in the conditions that they are interested in monitoring. We aim to develop this infrastructure such that we can deploy this system with data coming in from Cerner or Epic in the future.