Brief Overview
- The goal of our project is to gain a deeper understanding of how different cover cropping mixtures or single species can affect the microbial presence and nutrient cycling in the soil.
- In a recent study published this year, it was found that rather than composting regularly, the frequency of cover cropping on organic farmland was more important in improving soil food web and soil health (Brennen and Acosta-Martinez 2017). However, in the experiment, they lacked a control where no cover crop was planted to analyze the effects of cover crop presence on microbial diversity, soil fertility, and in turn, crop productivity.
- Symbiotic interactions between plants and bacterial communities are an integral part of the survival and success of both communities. In grassland communities with rhizobia communities in the soil, the plant productivity increased by 35%, the nitrogen content in the soil increased by 85% , and the community experienced a significant 34% increase in evenness (Marcel et al. 2006).
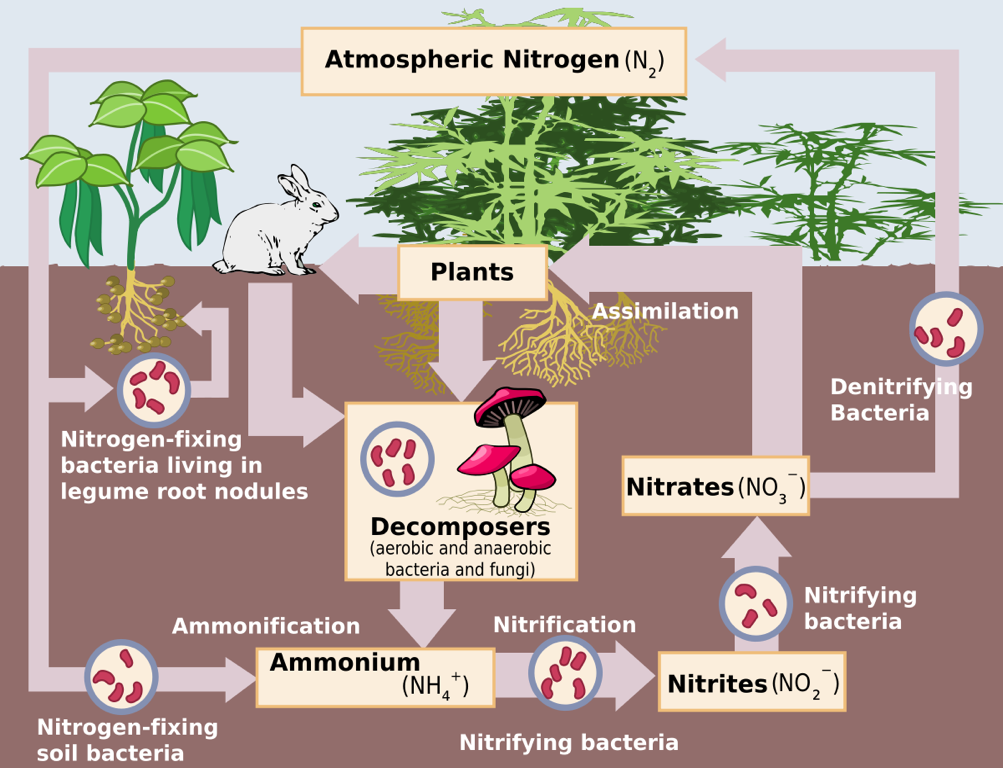
The Nitrogen Cycle – Source: https://upload.wikimedia.org/wikipedi/commons /thumb/f/fe/Nitrogen_Cycle.svg/1200px-Nitrogen_Cycle.svg.png
Our Research
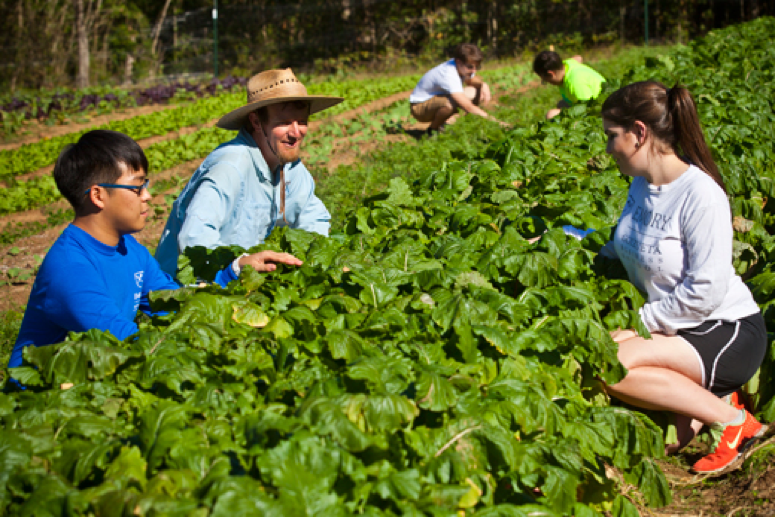
- This summer, we are focusing on the development of microbial diversity on the Oxford College Organic Farm through specific cover crop species and mixtures.
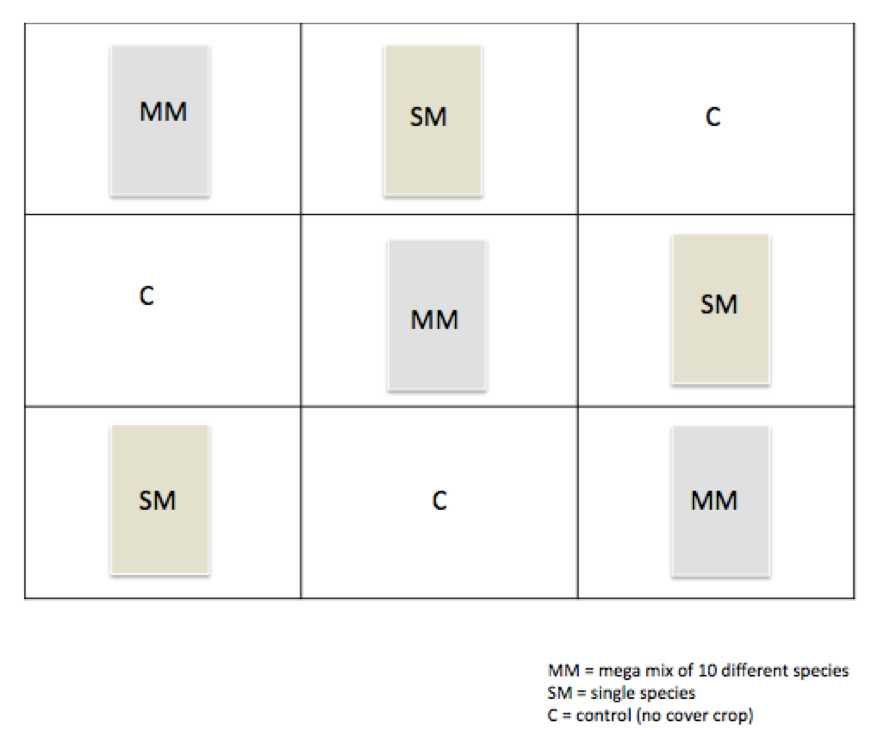
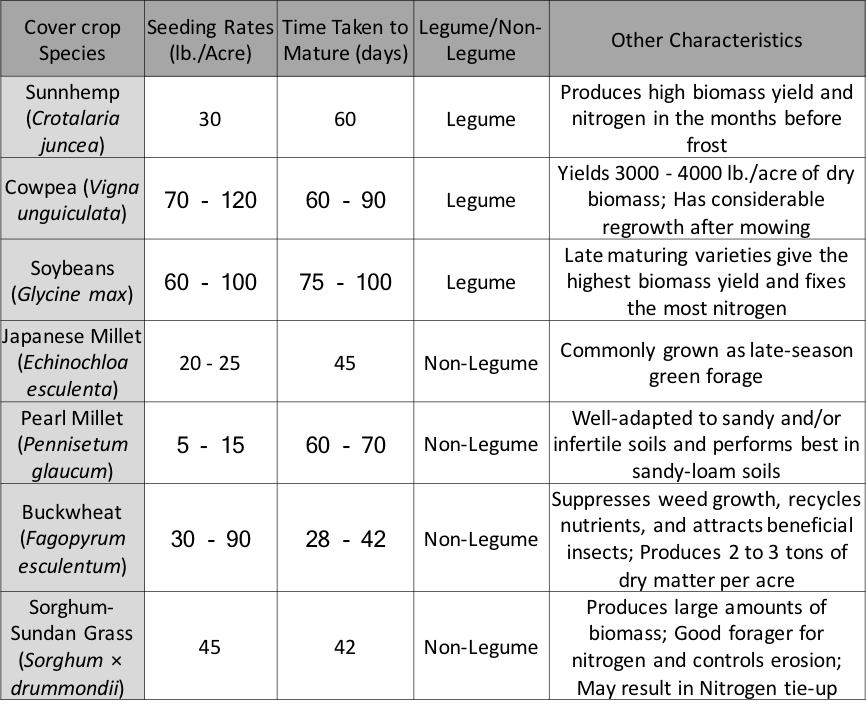
- To investigate this, we have taken an experimental plot and divided it into 9 sections, each section representing either a lone species of cover crop, a mega mix of 8 different species, or no cover crop.
- To observe change over time, we are collecting samples at 3 different time points, one is right after the cover crops are planted, another is right before the cover crops are mowed, and the last one is prior to the cash crop harvest.
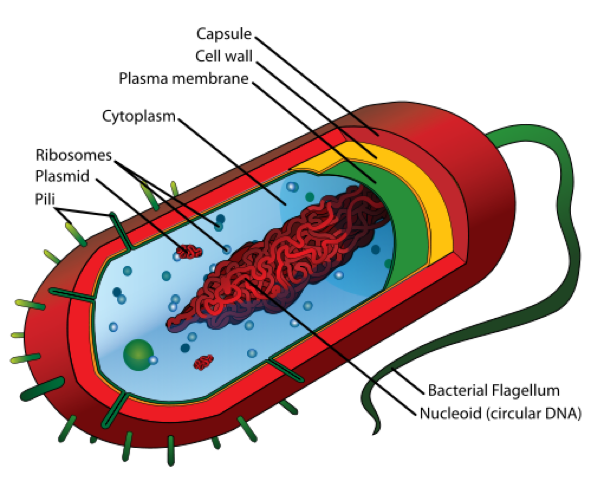
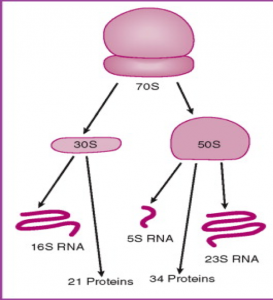
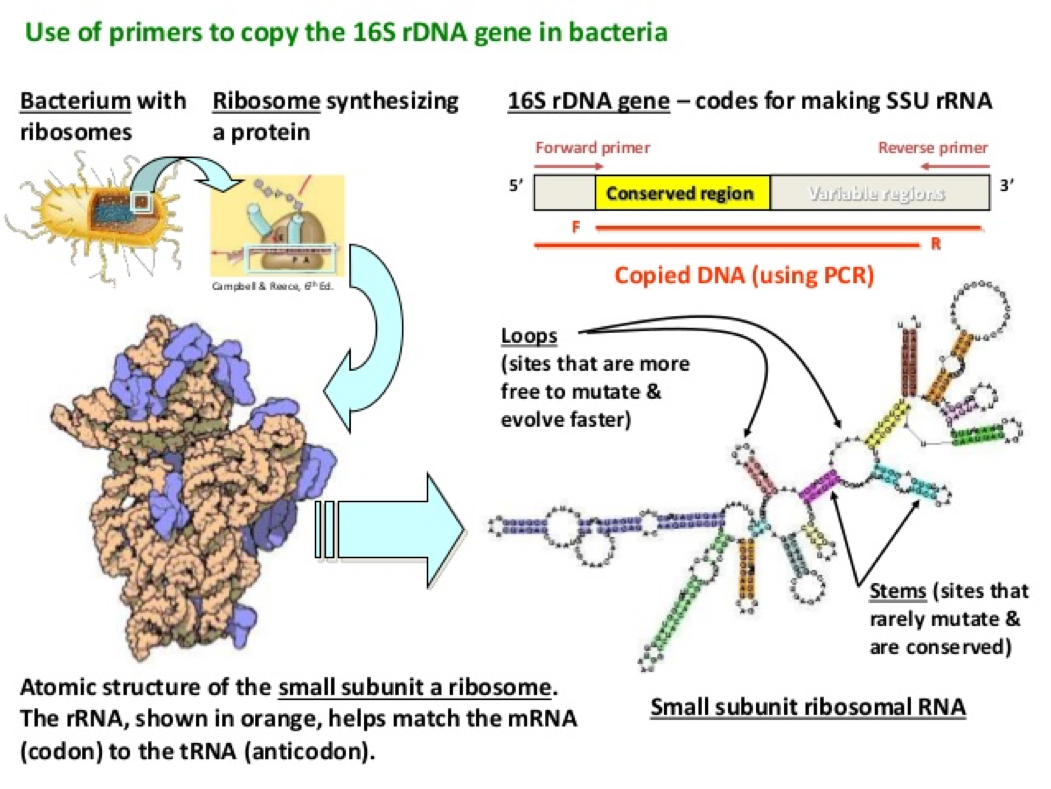
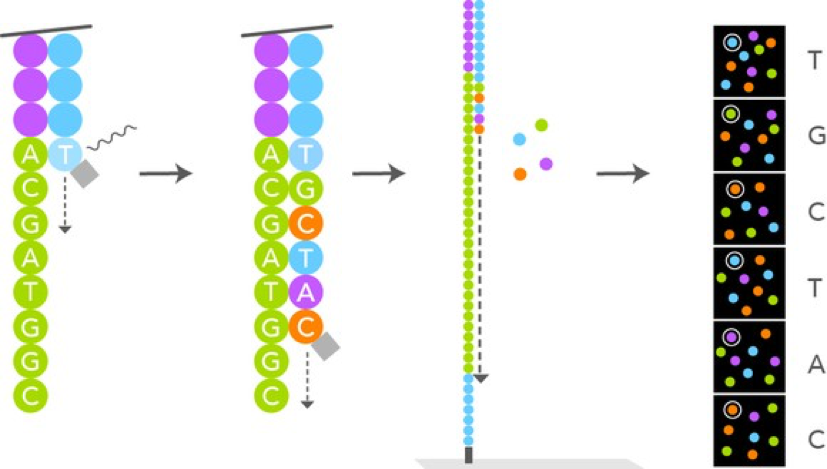
- In order to observe bacterial diversity, we are conducting DNA isolation and next-generation sequencing on the samples to amplify and identify bacterial species based on the 16s rDNA region.
- In order to observe changes in soil fertility, we are conducting soil tests to send to the UGA-AESL lab to determine organic matter content, nutrient availability, and total nitrogen content.
- In addition, we are also measuring the active carbon (Weil et al. 2003) and organic nitrogen (Gianello and Bremner 1986) within these samples using a developed protocol.
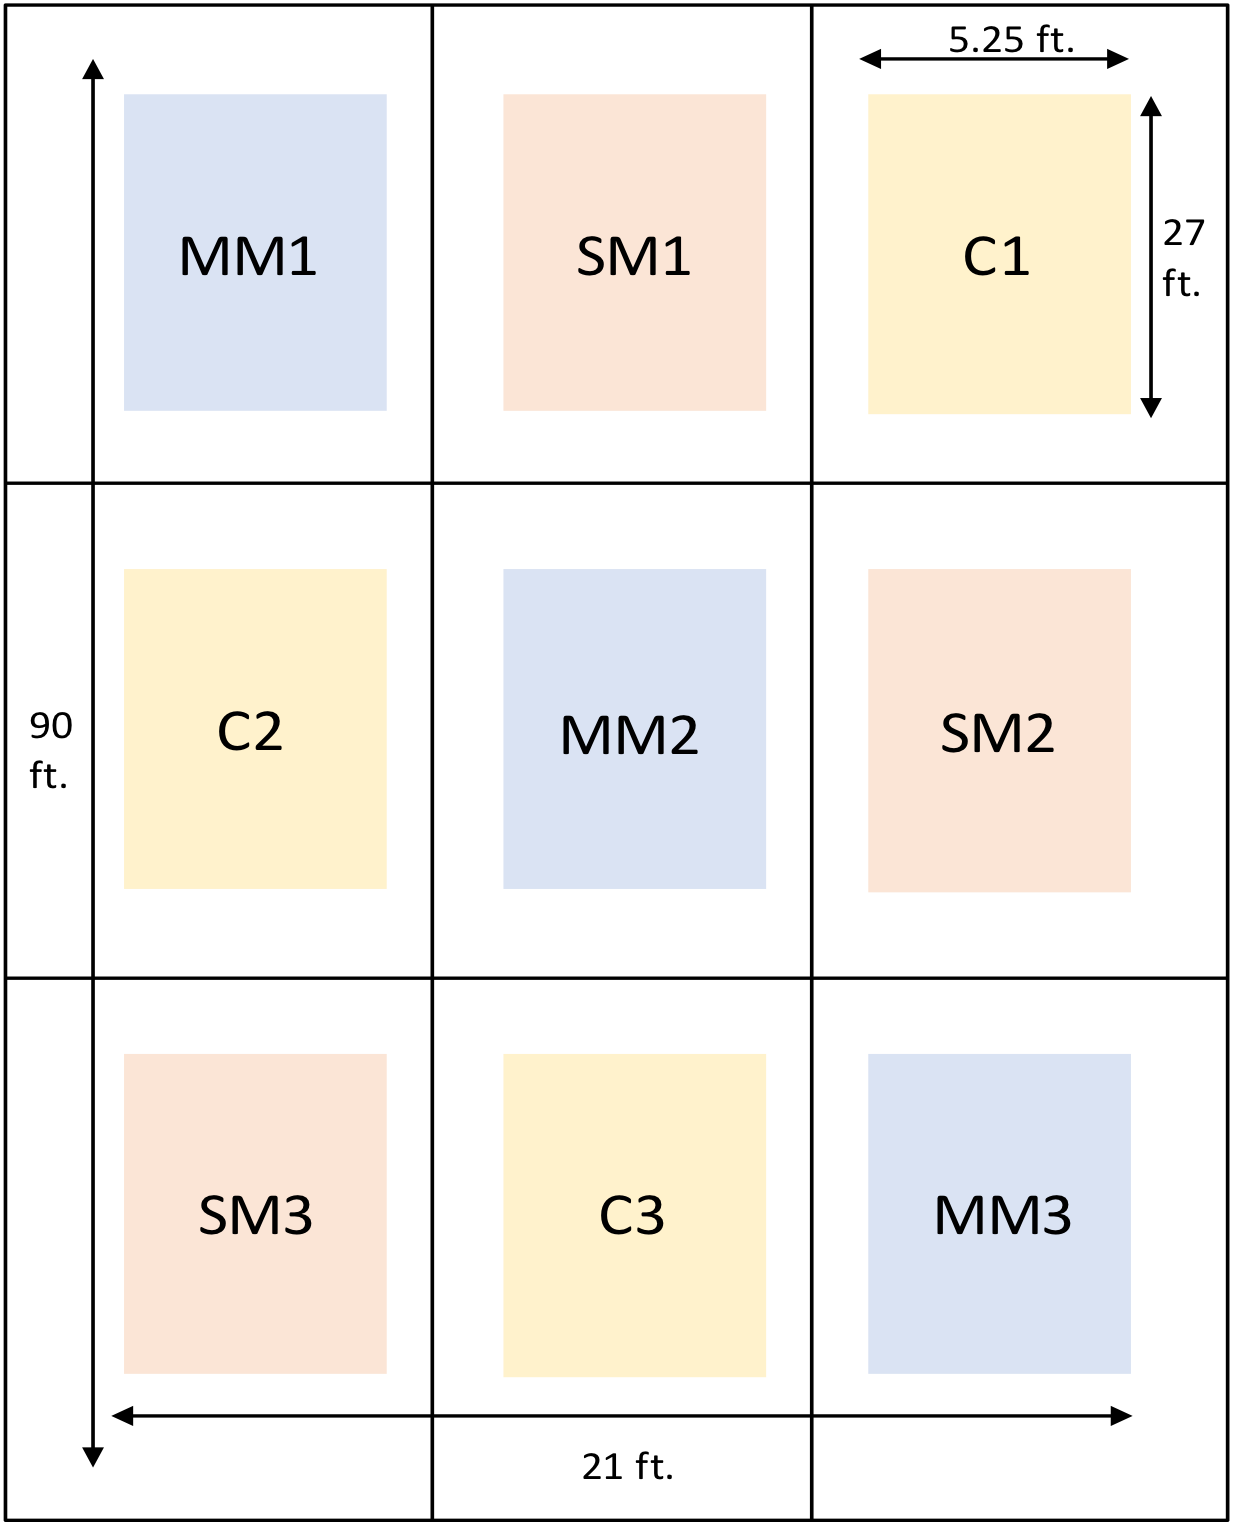
Outline of the Experimental Plot
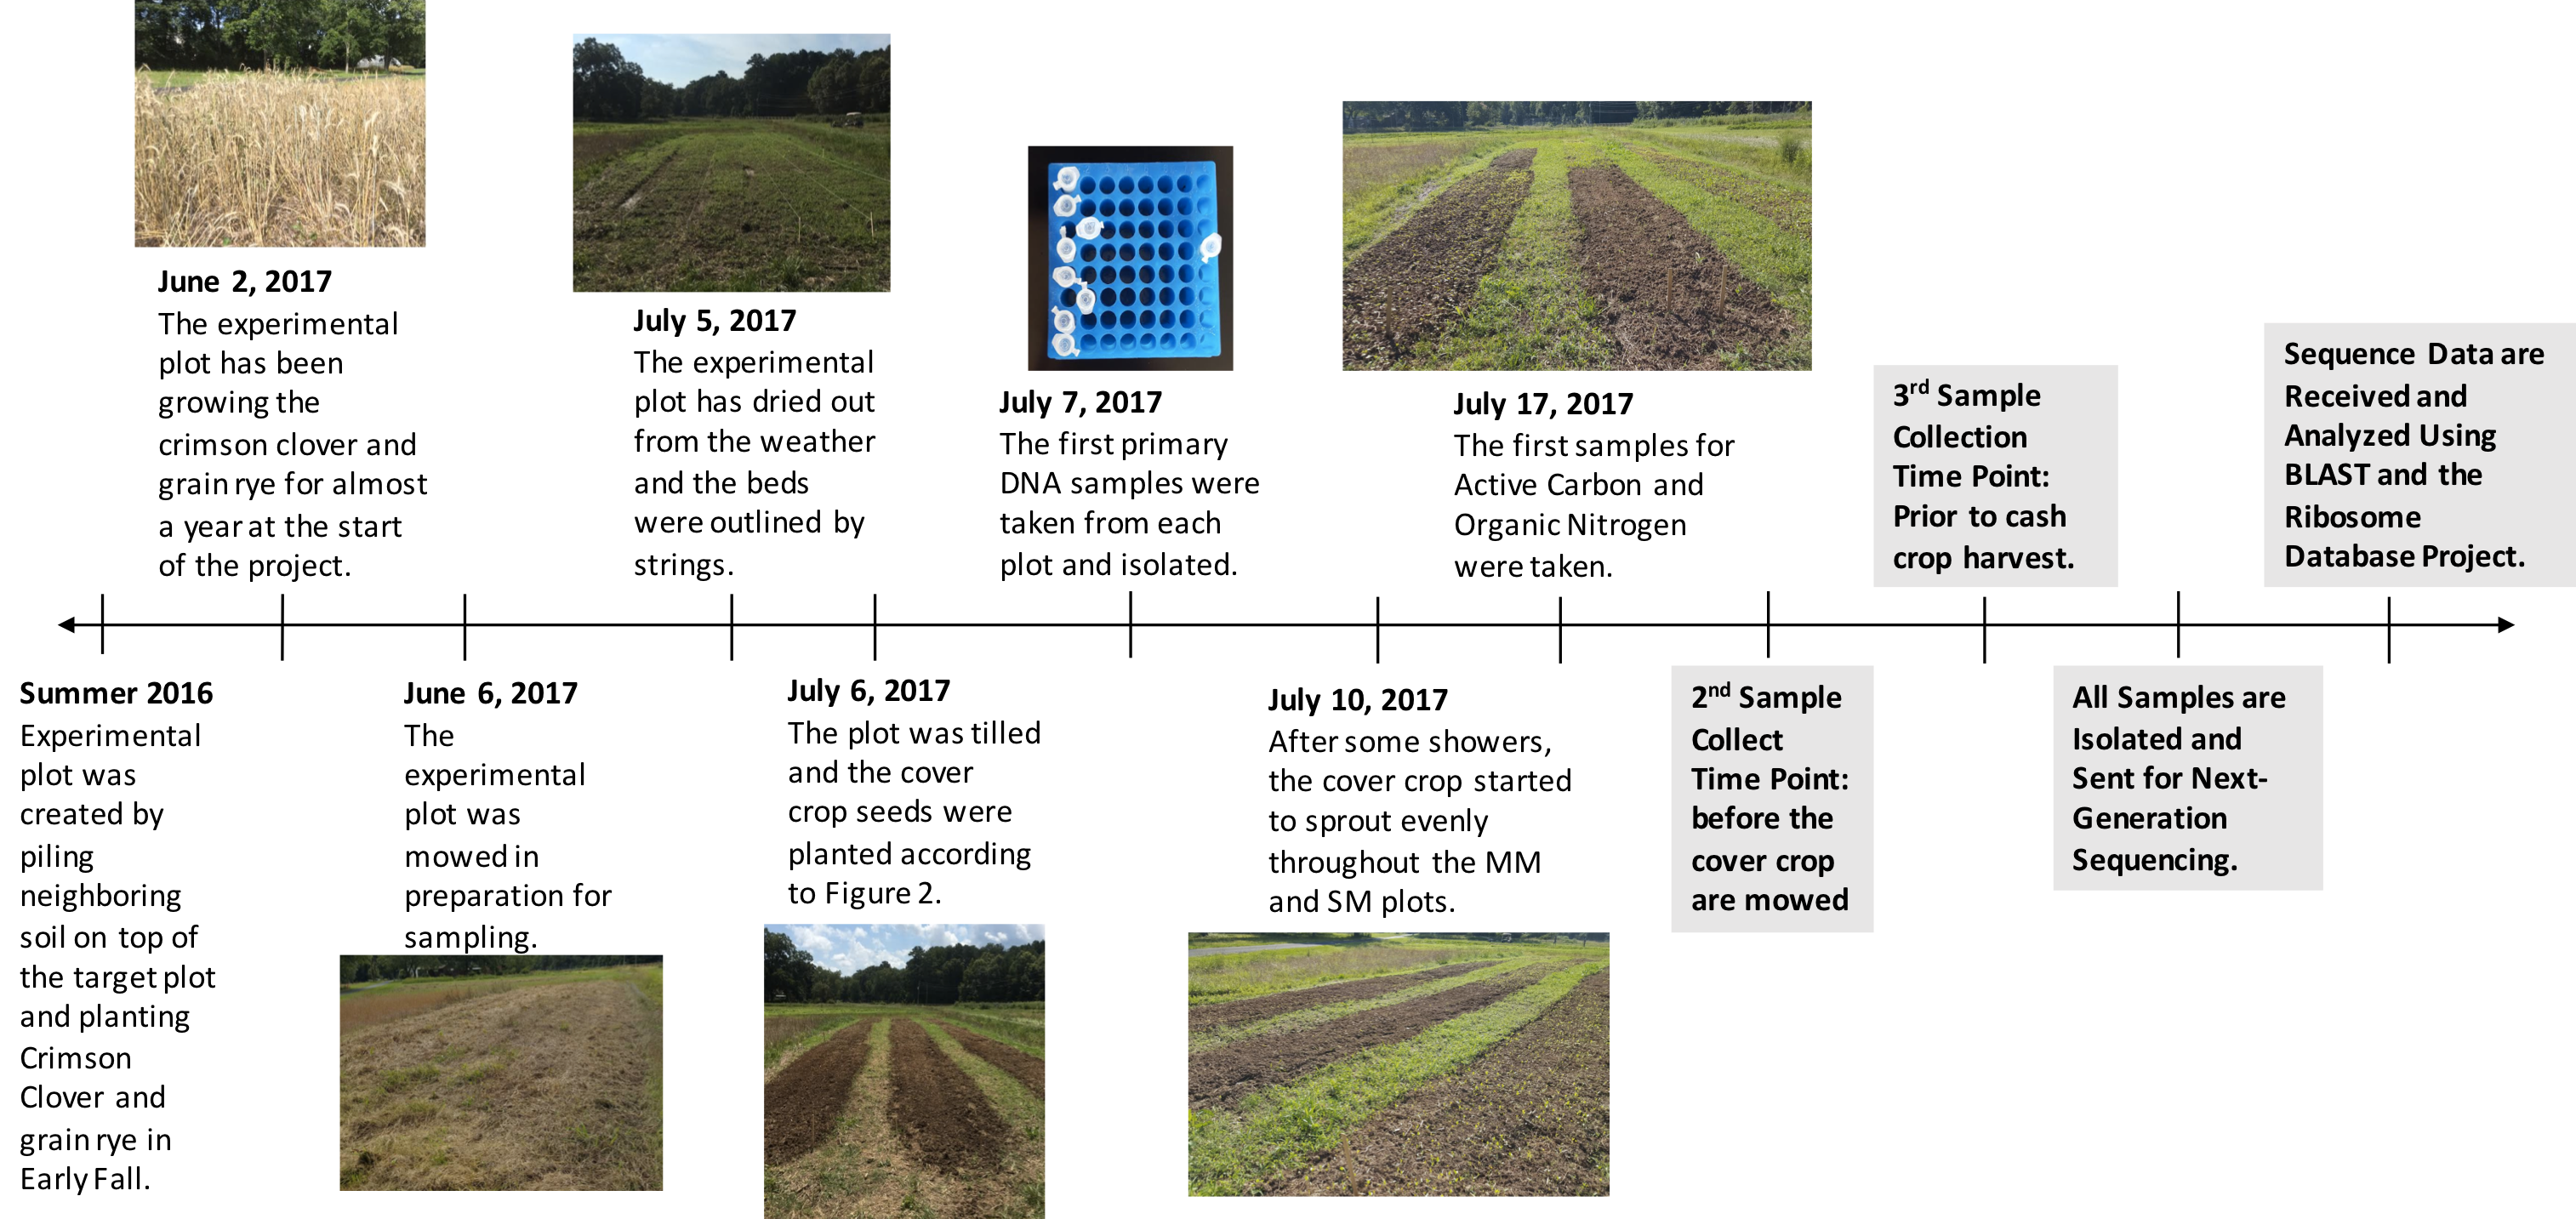
Timeline tracking the past plot history, current project progress, and future developments.
First Official Sampling
- On July 7, 2017, the day after the seeds were planted, the first soil samples were taken and DNA isolated. Upon isolating the DNA, concentrations and 260:280 values (indicates purity) were measured to ensure sufficient DNA and purity within the isolated samples.
- On July 11, 2017, PCR was conducted on two of the least pure samples to ensure that the other substances will not interfere with PCR or next-generation sequencing.
- The isolated samples will be stored in the freezer until all of the samples have been collected and isolated to be sent off for sequencing all together.
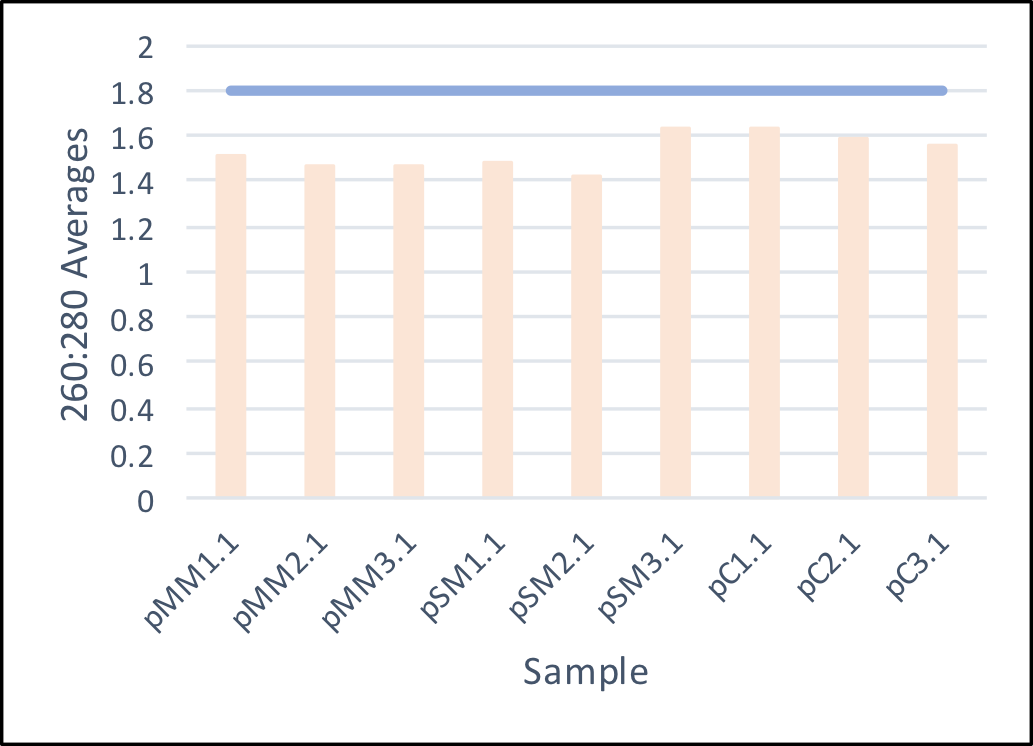
Average 260:280 values of the isolated soil samples. The ideal ratio of 1.8 is shown above to demonstrate a overall lower purity in the samples. To ensure the success of next-generation sequencing, PCR was conducted on sample pSM1.1 and 2.1.
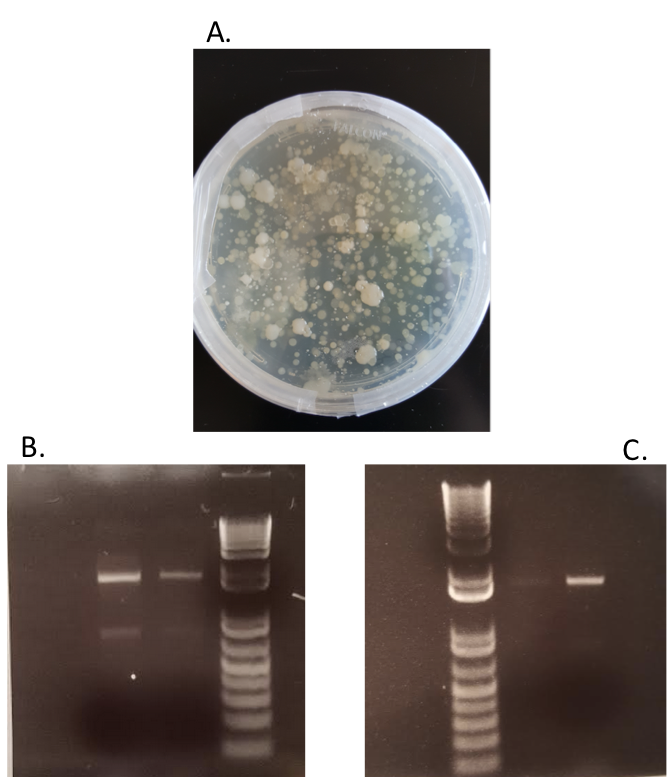
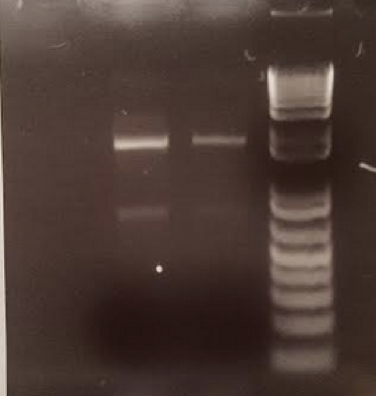
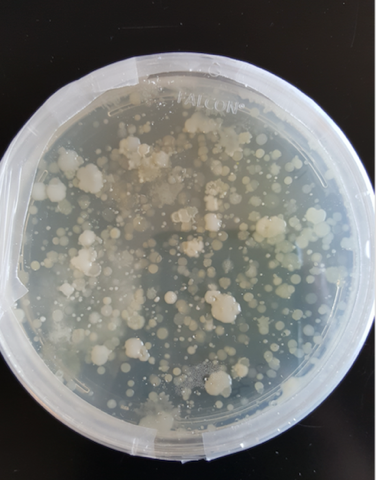
A. Soil samples were suspended in PBS buffer and plated on agar plates to ensure an abundance of bacteria in the samples. B. PCR was conducted based on isolated colonies in the plated bacteria samples to ensure that the bacterial 16s rDNA region could be amplified and purified for next-generation sequencing. C. PCR was conducted on isolated soil samples to ensure that a lack of purity would not interfere with downstream applications.
Establishing Baseline Fertility
- On July 17, 2017, samples were taken from the field and used to measure active carbon. Due to the variation within the calculated active carbon values, we decided to conduct the experiment in triplicates. The table on the right shows the triplicate sample values.
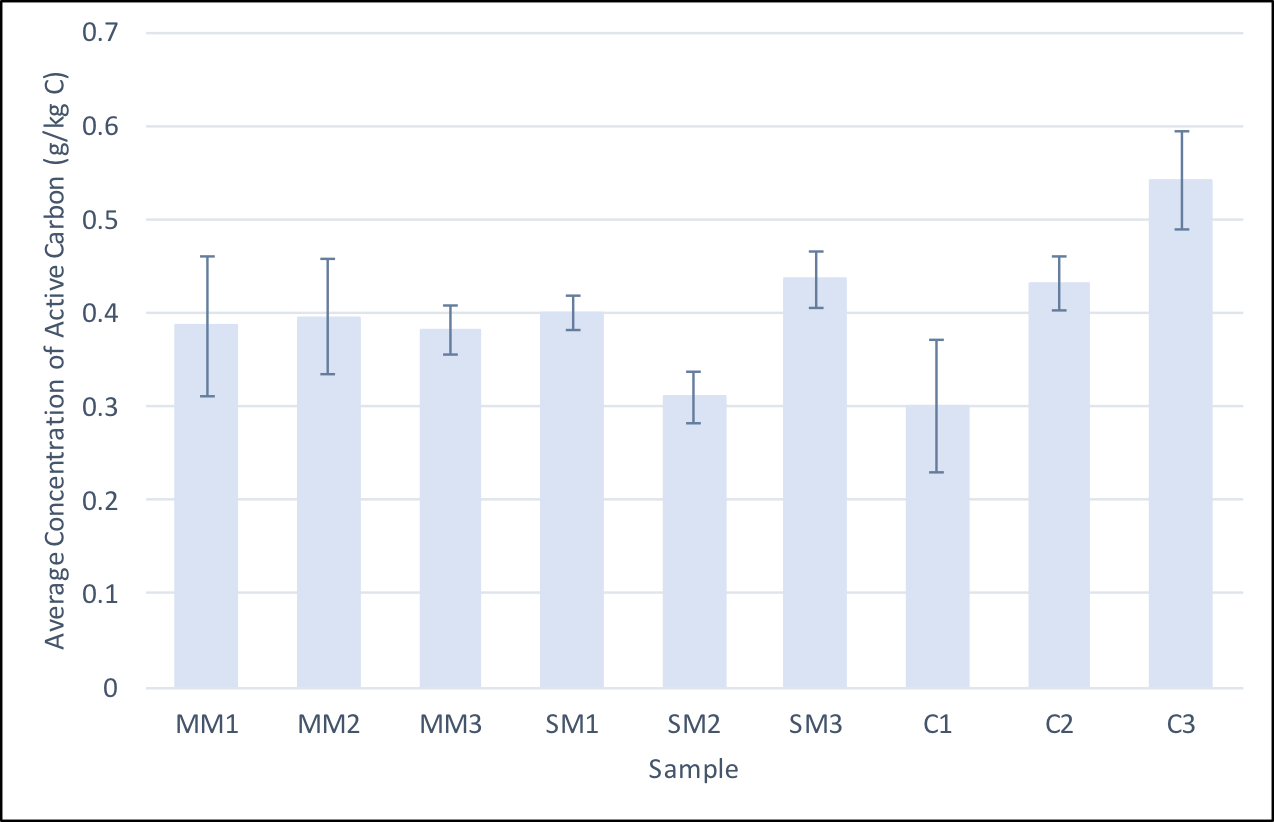
Average concentrations of active carbon in soil samples from each subplot. The procedure was repeated three times on each sample to account for variation. The standard variation of each replicate is shown and an ANOVA statistical test was performed to show that only sample C3 was statistically significantly different from the other samples.
Future Directions
- Our next sampling time point is after the cover crops are mowed and before the cash crops are grown. We will be taking triplicate samples and isolating DNA from all samples. At each time point, we will also be taking new samples for soil fertility measurements.
- Before then, we will optimize the organic nitrogen protocol and begin taking measurements.
- Our last time point is before the cash crops are harvested.
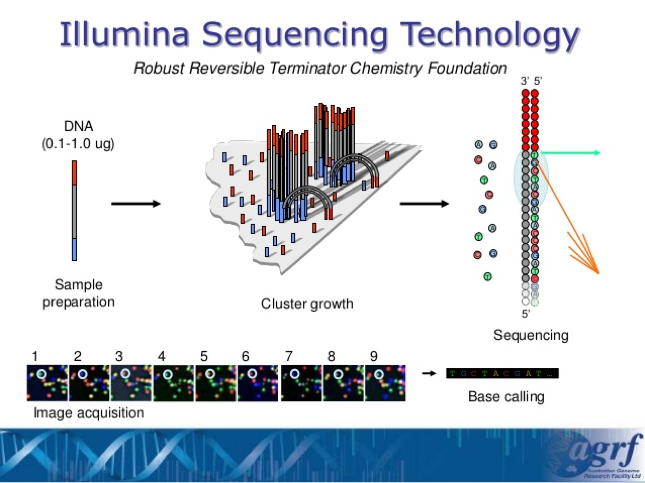
- After we have ensured that all of our samples have enough DNA concentration, we will be sending all of the results off at once to the UGA lab where the Illumina Sequencing Technology will take place and help analyze these DNA.
References
- Brennan, Eric B., and Veronica Acosta-Martinez. “Cover Cropping Frequency Is the Main Driver of Soil Microbial Changes during Six Years of Organic Vegetable Production.” Soil Biology and Biochemistry 109 (June 1, 2017): 188–204. doi:10.1016/j.soilbio.2017.01.014.
- Gianello, C., and J. M. Bremner. “Comparison of Chemical Methods of Assessing Potentially Available Organic Nitrogen in Soil.” Communications in Soil Science and Plant Analysis 17, no. 2 (February 1, 1986): 215–36. doi:10.1080/00103628609367709.
- R.r. Weil, Islam, K.r., M.a. Stine, J.b. Gruver, and S.e. Samson-Liebig. “Estimating active carbon for soil quality assessment: A simplified method for laboratory and field use.” American Journal of Alternative Agriculture18.1 (2003): 3-17.
Source: http://images.memes.com/meme/884368

Source: http://s.quickmeme.com/img/7b/7bedf2a43dbc53489cc46873eb4c562360b9b435287d8454f288461be669b02c.jpg