The basics:
If you work for a university library system, chances are you know about assessment groups and data collection. We send some our space usage data to the folks that like that kind of thing. Number of 3D prints, number of workshops we hold, and a few other things. One of those things we have tried to track is user interactions in our space.
Initially, we tried an iPad with a custom Google Form tied to a spreadsheet to track who came in and why they came to see us. Unfortunately that didn’t work well with our student staff. In addition, users felt it was intimidating to have to sign in. They viewed it as a barrier to entry and for “official users”. To help reduce that barrier and keep the environment friendly, we changed things up. The only absolutely must have data, are
- How many users?
- How many of those are quick answers? (“Where is the bathroom?”, “Who are you?”, “What are your hours?”)
- How many of those are in-depth or complex answers? (“How do I 3D print something?”, “What is 3D printing?”, “What is pi?”)
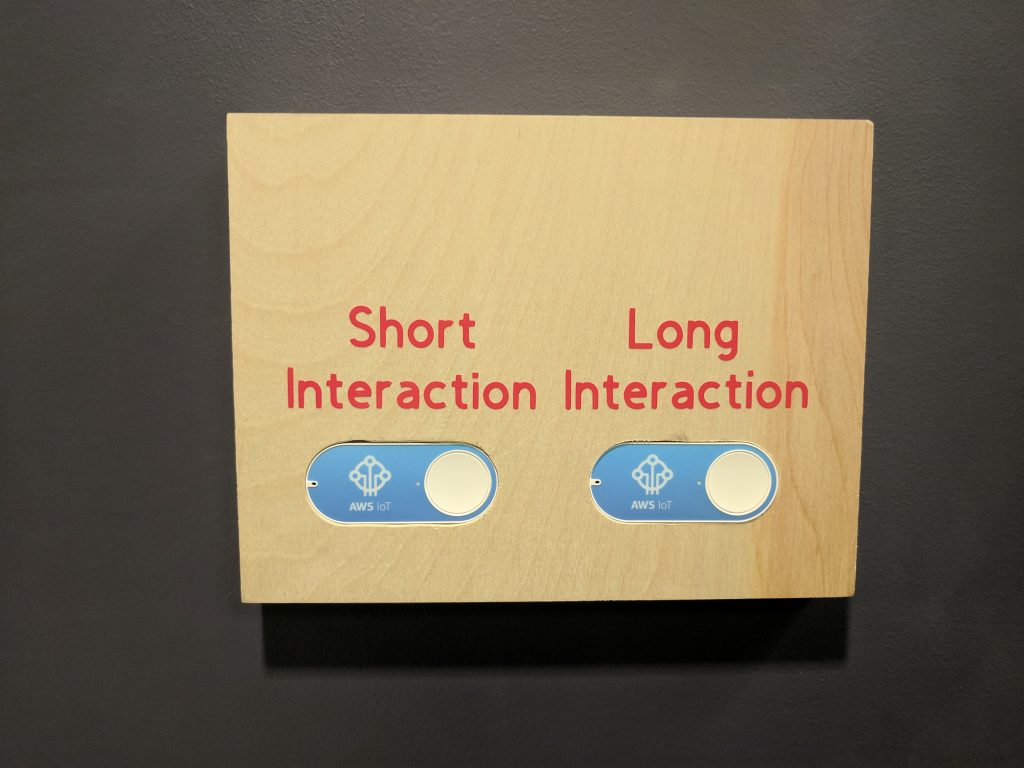
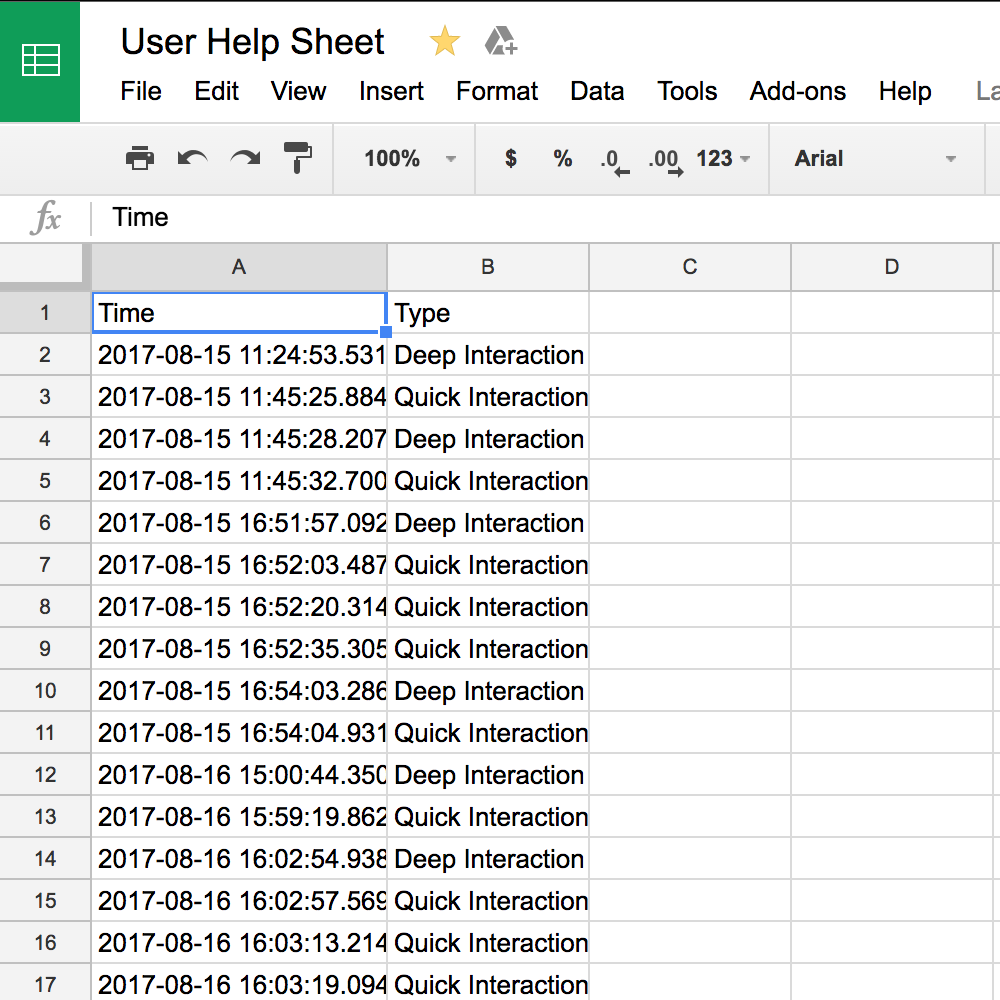
To collect this data in a simple way, we utilized Amazon’s AWS Lambda functions, IoT Device controller, and IoT Buttons (2nd gen if you care). Now, our staff can hit a quick button when they talk to someone and the data is put into a spreadsheet folks can access whenever they want.
To mount it, we cut our some spaces with a Carvey CNC machine from a bit of scrap wood and mounted it to the wall with GM Command Strips. A little bit of vinyl from the Cricut die-cutter and we had things setup in a pretty straight-forward manner. She may not look like much, but she’s got it where it counts, kid. Later we can add a couple custom modifications if needed.
Project in action:
What a user sees:

What our data hounds see:

- On Github: here
- Date: July 2017
- Lead Tech: Asher Mouat
- Tech Used: Python, AWS, Amazon IoT Buttons, Carvey CNC
