Monopsony Power as Evidenced by System-Joiners

As you may remember, I have been helping Dr. DePasquale develop her theory concerning the need for differentiation between hospital mergers and system-joiners. Because Dr. DePasquale coined the term “system-joiner” herself, she is soon putting out a new paper that elaborates on what exactly this specific type of consolidation looks like. Dr. DePasquale argues that within the realm of health system consolidation, a system joiner allows the joined health system to exercise monopsony power.

What is a Monopsony?

Even if you don’t study economics, you’ve probably at least heard of a monopoly, an economic system in which only one supplier of a good or service exists, and where the occurrence of unfair competition is highly likely. A monopsony is analogous to a monopoly, in that only one buyer of a good or service exists. Such a scenario is most often associated with a monopsonist employer that demands the labor of multiple workers.

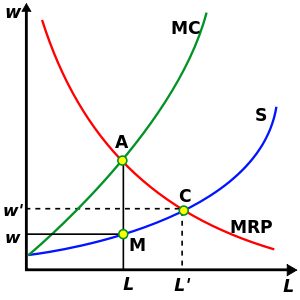
 We can look at the above graph to see how monopsony power is exercised. In a competitive market with multiple employers and multiple workers, the level of employment and wage would be determined by the supply and demand equilibrium, seen in the graph as L’ and w’. However, because in this case the monopsony is the only employer, the monopsony can maximize its revenue by choosing the level of employment consistent with where marginal cost is equal to marginal revenue, while also minimizing costs by setting the wage w equal to where our level of employment L intersects the supply curve. Thus, this monopsony is acting in an anticompetitive manner because it can lower wages so that they are less than its marginal revenue while still retaining a profit maximizing level of employment.

What Does Dr. DePasquale’s Research Show?  

While in theory the monopsony is a well known market structure, there is little to no empirical research that shows evidence of monopsony power taking place. Dr. DePasquale’s research could be the first of its kind to provide findings supporting the existence of a real life monopsony. Her paper examines situations in which one or more local hospitals are absorbed into a larger regional health system. After the consolidation takes place, only one major health employer remains. Dr. DePasquale found that this transformation allowed the system to lower wages across the board while simultaneously retaining a similar number of employees. This suggests that that the consolidation allowed for a monopsony to emerge.

What am I Doing to Help? 

After presenting her paper for other economists to critique, Dr. DePasquale was confronted with a number of new questions regarding her research. The most recurring question seemed to be: “How do you not know that the hospitals are substituting their current employees with less skilled workers to justify the lowering of wages?” i.e. replacing a nurse practitioner with a register nurse, replacing a physical worker with technology, replacing an American citizen with a foreign nurse, etc. Expanding on this question, some other economists said if the same thing could be true at the physician level. However, this drew notice to the fact that Dr. DePasquale was unable to find hardly any substantial data on the number of physicians by hospital or by market, as well as any information alluding to the wages of said physicians. I will be tackling both of these issues, so that the paper can be sent out with a more believable finding of a real life monopsony.

Running a Facial Motor Analysis for Deep Brain Stimulation (DBS)

Facial motor analysis is a type of scientific analysis used to analyze facial movements. It is one of the few chosen behavioral analysis techniques that we will be running for Deep Brain Stimulation study in the Mayberg Lab. Our goal is to show that electrical stimulation to the cingulum bundle has a significant effect on the facial movements, which, from a preliminary run of this analysis, is more than evident. This analysis also provides a way to scientifically show that stimulation to this area has a behavioral effect on patients, i.e. a patient is stimulated and cannot stop smiling and giggling.

Right now, we are in the pre-processing stage, which involves digging through run sheets from past experiments and locating the correct video files that correspond to these experiments. As I said in my last blog post, we have decided to run the facial motor analysis on the video from the affective bias task, which adds another level of complexity but also provides an opportunity for us to learn more about how the affective bias task really works. One hypothesis we have, backed by facial feedback hypothesis, is that we will see patients’ facial movements change depending on the block of the task- happy or sad.

For the past two weeks, I have been searching through video footage from the four DBS patients who we will be running this analysis on, and putting together a guide that details which video files match with which run of the affective bias task for a given patient on a given day. After I finish this, and we know which video files are missing, Kelly, my mentor, and I will reach out to another member of the Mayberg lab to try to locate the missing video files. Kelly, Sahar, the graduate student who wrote the algorithm for the facial analysis, Lydia, another member of the Mayberg lab, and I will meet to discuss how we will move forward. Below, I’ve listed a rough outline or procedure of the steps that need to be completed for the facial motor analysis.

  1. Locate, label, organize, and annotate all affective bias task runs for DBS905, DBS906, DBS907, and DBS908 for C4, C8, C12, C16, and C20. Check all run sheets for given patient and day to confirm.
  2. Meet with Lydia to locate missing video files.
  3. Meet with Sahar to go over any issues with video files, i.e. patient is wearing EEG during task, part of patient’s face is not visible, patient is eating during task, etc.
  4. Finish preprocessing – trim all video clips to only contain affective bias task
  5. Sahar will begin running her algorithm on the video files – I am hoping to be able to play a role in this as well.
  6. After all video files have been analyzed, we can begin interpreting the results. Build a figure that shows how facial movements correspond to different blocks of the task, i.e. happy block with no stim, sad block with stim, etc.

After we’ve completed these steps, I will be able to begin putting together my poster.

HR enforcement mechanism effectiveness: a regional comparison post 2

Over the past month, I have been working on the literature review and the sensitivity index I’d use to carry out the statistical analysis. The sensitivity index is a mathematical model that conditions the country’s response to international pressure such as shaming the country and implementing economic sanctions. Most of my efforts were devoted to developing and refining the equation for the sensitivity index. There are, of course, many variables that need to be controlled for to isolate the independent effect of region-specific variables. So far, the following region-specific elements are included in the index and most of them are controlled for in regression analysis: regional history of conflict, presence of authoritarian rule, the region’s agricultural history (e.g. the type of crop grown, the man-hour needed for one harvest), and level of freedom of press. The agriculture-related variables are the innovative part of my study since they were not previously considered relevant to the study of a repressive regime. But I was interested in testing a cultural theory which evaluates the people’s tolerance to hardship and to what extent they are used to looking up to authoritative figures. Gladwell, in his bestselling book Outliers, theorized about how endurance and perseverance became virtues in cultures that are shared by those living in regions that rely on slow-growing crops that requires long man-hours to harvest (e.g. rice).

Previous works on the topic of addressing violations have offered mixed results, suggesting that enforcement mechanisms must be applied discriminately in different cases with a careful combination of other methods to realize the maximum effect. Murdie & Davis (2012) offered insight on the use of “naming and shaming” (i.e. calling the perpetrator out internationally), suggesting that this method alone carries no significant effect but will facilitate human right development to some degree when being applied along with other international efforts. Hafner-Burton (2008), on the other hand, found that the same mechanism does not have a disproportionately positive effect on democratic countries, contrary to what has been hypothesized, and further suggests that perpetrating countries that have previously rectified human right treaties acted worse after being shamed.  In terms of the mechanism of the method “naming and shaming”, perhaps one of the most cited sources in human rights or even international relations in general, Keck & Sikkink (1998) illustrated the proper path of applying international pressure on violating countries through a “boomerang model”, which shows that transnational advocacy groups usually translate the grievance to another state and international organizations to which the perpetrating country may or may not be a member and direct the pressure through these outside players to the target state. Additionally, on economic sanction (trade linkage), both Spilker & Bohmelt (2013) and Dreher et al (2012) visited the various effect of economic actions to shape state behavior when it comes to human right violations, and found that only certain type of economic sanctions (e.g. Preferential Trade Agreements) have some positive effect in improving human right status in the target state. Even so, alternative explanations such as “rally-around-the-flag” effect (i.e. states exploit the fact that they are being sanctions as propaganda tools to rally domestic support) remain strong and plausible.

After looking at the literature, I’m really intrigued by the fact that there are substantiated results suggesting that most commonly thought of enforcement mechanisms carry limited effect. What might be the regional explanations behind this phenomenon? Although human right violations occur worldwide, some types of violations are indeed more prevalent in some regions than in others. For example, according to the Human Rights Risk Index, genocide is far more prevalent in Northern African countries than it is in South America, while the occurrence of empowerment right violations appears to be even across the globe. My study will focus on providing region-specific explanations on why some violations occur and how to address them properly using the mechanism or some combination of mechanisms that are “tailor-made for this region and the specific type of violations. My aim for the rest of the semester is to apply my current model to some datasets and further refine the structure of the equation. Fortunately, despite the fact that my advisor, Dr. Bowersox, did not specialize in human right enforcement, in particular, he had many experiences constructing indices and mathematical models for his sports politics research. I was able to get valuable advice from him to work out the details of my sensitivity index.

Looking ahead to next semester,  I will start gathering dataset and develop a testable hypothesis. I suspect that the model would require multivariate regression analysis so I will familiarize myself with some coding language over the winter break.

References:

Hafner-Burton, E. (2008). Sticks and Stones: Naming and Shaming the Human Rights Enforcement Problem. International Organization, 62(4), 689-716.

Keck, M., & Sikkink, K. (1998). Activists beyond Borders: Advocacy Networks in International Politics. Cornell University Press. Retrieved from http://www.jstor.org/stable/10.7591/j.ctt5hh13f

Murdie, . A. M. and Davis, . D. R. (2012), Shaming and Blaming: Using Events Data to Assess the Impact of Human Rights INGOs1. International Studies Quarterly, 56: 1–16.

Spilker, G. & Böhmelt, T. Rev Int Organ (2013) 8: 343.


Freesurfer Script Writing


An Introduction to Freesurfer

Freesurfer is a processing software commonly used for the purposes of neuroimaging processing and data analysis. It allows for the visualization of structural and functional areas of the brain, making it especially useful in my field of research, which explores the role of Gamma Amino Butyric Acid (GABA) as a biomarker in the prognosis and treatment trajectories in stroke patients. Processing through the Freesurfer pipeline is conducted through C shell, a Terminal shell which is used as an executive command interpreter.

This blog post is meant to document some of the procedural aspects of data analysis in my subset of neuroscience research, which mainly includes neuroimaging and topographical mapping of the brains of patients who have suffered from stroke. As an undergraduate, I have relatively little experience writing scripts and computer programming; this post is meant to be a guide to beginners on how to I utilized the Freesurfer pipeline as I peruse and attempt to solve the methodological complications that may arise while creating and editing scripts within the pipeline myself.


Methods and Directives I have Completed thus Far:

$Autoreconall-1, $Autoreconall-2, and $Autocreconall-3, are all a series of commands used in the reconstruction of cortical images based on post-stroke T1 MRI scans of patients. These co

mmands scan for topographical errors and are known as clustered directives. Clustered directives allowed me to perform a series of commands all at once, thus more efficient processing and correcting brain scans. Additionally commands such as $foreach allow one to process the scans for each subject all at once, thus minimizing the amount of script I had to input into Terminal, the MAC operating system that hosts C shell.


The processing of these images took about three days to complete, and one subject had to be thrown out due to an excess of topographical images found on the original T1 MRI. After these were complete, I was able to utilize Freeview, a visualization tool within the Freesurfer pipeline, to look at the final, reprocessed brain volumes and check for any abnormalities, such as whether regions of the brain were cutoff. An example of a sample scan visualized in Freeview can be seen below:

Image result for freeview brain

Finally after this has been completed, a stats script was used in order to extract statistical data. However, after attempting to input the script an error (shown in the image below) came up. Although, according to others working within C shell or BASH, this seems to be a fairly common error, none of the suggested corrections to the script (most of which came from this thread: https://askubuntu.com/questions/304999/not-able-to-execute-a-sh-file-bin-bashm-bad-interpreter) seemed to help resolve the issue.  Hopefully these will be resolved within the week.

/bin/bash^M: bad interpreter: No such file or directory

Carbon Monoxide Inhibition of Hydrogenase

Efficient energy production is important in today’s world where the stock of fossil fuel is limited and global warming is bringing devastating effects in certain parts of the world. There are many potential solutions to the energy crisis, solar and nuclear generators being the most well-known. However, there is another potential mechanism that can produce energy in high turnover rates that emits little to no CO2.

Hydrogenases catalyze the reversible 2H+ + 2e- —> H2 reaction in its active site. However, the active site can be inhibited by carbon monoxide (CO)  which halts the catalysis of the reaction. By studying the mechanism of how CO diffuses into the active site of hydrogenase, scientists could potentially synthesize “mimic” proteins that have little inhibition, high turnover rates of products, and are compatible with other molecules that are used in industrial production, thus producing energy efficiently (this is only one of many potential applications).

In order to study the inhibition mechanism, first I will be synthesizing a caged CO manganese complex– a manganese complex which contains carbon monoxide. I will put this into a solution with myoglobin and shine light at a specific wavelength to excise the CO from the manganese complex and watch it diffuse into the active site of myoglobin through kinetics tracing*. If the CO successfully diffuses into the myoglobin active site, I will go on to perform this experiment with hydrogenase. I will test it with myoglobin first because myoglobin is much smaller than hydrogenase and if the CO fails to diffuse into the smaller myoglobin, it will have no chance of diffusing into the hydrogenase. This will allow me to use myoglobin in lieu of hydrogenase which our lab has to obtain from the University of Georgia.

Prior to doing this experiment, we must synthesize the manganese complex. To do this, we have to synthesize the Tris(pyrazol-2-yl) methane ligand which is a major component of the manganese complex. We will be starting the synthesis process soon.

I am looking forward to doing my first project with the help of my graduate mentor Greg. I am eager to share the results in our poster presentations at the end of the year!

*Kinetics tracing is a method of monitoring the electron distribution in the hydrogenase active site upon CO binding. The hydrogenase changes conformation, which in turn changes the electron distribution.

Chronotype Research Update

In my previous post, I discussed the senior thesis of a former researcher in Dr. Rodman’s Lab, Eli Recht.  His work on “Chronotype and Facial Affect Processing” is directly related to what my lab is currently working on.  Our next experiment will essentially address Eli’s future directions as well as our own evolving research questions.

How does Eli’s research relate to the lab’s current work?

The lab’s main focus is still on the effect of chronotype (whether or not a person is more morning or evening-oriented) on facial affect processing and mood disorders.   However, we are planning to alter quite a few aspects of the experimental design this time around.  For instance, the lab discovered a time-of-day effect when analyzing the data from Eli’s experiment. Subjects tested in the evening consistently rated expressions more intensely than those tested in the morning, and the effect was found regardless of chronotype. Consequently, we are planning to test our subjects exclusively in the evening (rather than at different points in the day) because we are more likely to find an effect.  Moreover, we plan to test subjects under different lighting environments and observe the effects on mood, attention, and circadian rhythms.  Additionally, whereas Eli’s study focused on subjects rating the emotional intensity of faces, we are planning to focus on emotional identification. We are also planning to flash faces onto the computer screen for short durations of time and ask subjects for confidence ratings.  Perhaps these confidence ratings will give us new insights regarding which types of people are more confident about their assessments of emotional intensity.  We can ask questions such as: Will there be a chronotype effect? Will the presence of a mood disorder (such as depression) play a role in how confidently people identify emotions?  Other than a few more changes, the new experiment will be conducted in a similar manner to Eli’s, using many of the same questionnaires.

What am I currently working on?

In addition to helping my lab develop the future experiments, I have been reading scientific papers about chronotype and the Three Factor Eating Questionnaire (TFEQ).  The TFEQ is a 51 item questionnaire developed by Stunkard and Messick (1985) to examine three factors of restrained eating, which is intentionally restricting the amount of food consumed to control weight. The three factors are (1) cognitive restraint, (2) disinhibition, and (3) perceived hunger.  Cognitive restraint is further divided into rigid and flexible control.  Rigid control is an “all-or-nothing approach,” whereas flexible control is “a more graduated approach to eating and dieting” and is thus considered healthier (Schubert and Randler).  In their 2008 study entitled Association between chronotype and the constructs of the Three-Factor-Eating-Questionnaire, researchers Eva Schubert and Christoph Randler discovered a few interesting relationships.  They observed a positive association between morningness and cognitive restraint, as well as between morningness and flexible control. There was also a negative association between morningness and disinhibition, as well as morningness and perceived hunger. This all seems to support the claim that “morning people” tend to lead healthier lifestyles.

My P.I also recently had me read a paper entitled The Three-Factor Eating Questionnaire-R18 Is Able to Distinguish among Different Eating Patterns in a General Population by Blandine de Lauzon et al. (2004).  This paper discusses the validity of the shorter version of the TFEQ called the R-18; it has 18 items instead of 51.  Its sub-scales include (1) cognitive restraint (CR), (2) uncontrolled eating (UE), and (3) emotional eating.  Despite the fact that we only used the TFEQ-18 as a filler survey in Eli’s study, it may nonetheless provide us with important information.  I am currently working alongside a graduate student in my lab to analyze the data.  We are still in the beginning stages of this analysis, but we are curious to see if we will find similar associations between chronotype and eating behavior in our own data.  Moreover, we could look to see if there are any correlations with negative or positive facial expressions.

Lastly, I am personally interested in seeing whether or not there is a relationship between chronotype and creativity.  My hypothesis is that evening-oriented individuals will tend to be more creative.  (My rationale is based on the idea that there have been many instances of famous artists and composers furiously working on their projects throughout the night, in fits of inspiration. Perhaps this also has to do with overlaps with mood disorders.) Most creativity tests involve tasks of some sort (with physical objects or drawing pictures), but in order to include it as a part of the lab’s next study, I must devise an alternative method. I am in the process of developing this filler questionnaire that we can use in our next project to collect some pilot data. Additionally, I am still deciding whether I would like to ask questions about the Big Five personality characteristics, or if I want to focus on breaking down creativity into facets including musical, artistic, and literary creativity, among others.

To Dance Is Female?

Update

In the past few weeks, I have participated in the process of choreographing a piece which will be performed in early March 2018. In the process, I learned how choreographers put their ideas into physical movements. I also learned the moon phrase and did a movement profolio that I narrates how my female family members shape my gender identity while dancing. During the rehearsals, I observed how my dance mentor organized a movement phrase based on the use of space, as well as how another choreographer helped produce a phrase of two women dancers of color with a huge red band to tell the stories of women of color in the United States. Additionally, I and other dancers and choreographers played a guessing word game which is similar to the game TV show “Password Plus” in the 80’s. The idea of giving clues to another person and the receiver required to guess the word based on the association of the clue was incorporated into the dance piece to invoke audience’ association of clues regarding female, body and movement.

Analysis and Interpretation on Research Literature

After rehearsals, I was assigned a reading on “Where feminism has not disappeared” by Gwendolyn Alker. Since “feminism inherently uncovers and then mirrors the struggles of identity formation, or performing oneself to others,” then “the intersection of gender and performance allows for theoretical discussions to be mapped coherently and intellectually onto the bodies.” After some other discussions on relative daily experiences or exposure to gender and body issues, my mentor asked me to form my own research question that is related to her research question.

Future Plan

I am thinking about doing my research on what cultural and historical aspects that shape the gender expression through body and movement among Taiwanese indigenous people and Han Taiwanese. I plan to investigate histories of both Taiwanese indigenous people and Han Taiwanese and identify cultural factors that impact how gender identity forms and how gender is expressed through behaviors, body images, and movements.

Reference

1. Alker, Gwendolyn. “Where feminism has not disappeared.” Women & Performance: A Journal of Feminist Theory, vol. 14, no. 2, 2005, pp. 39-41.

Christian-Jewish Polemics in Commentaries on the Psalms

A 16th-Century woodcut of Rashi (1040-1105)

I visited the Society for Biblical Literature, which is right by the Emory alumni building, about a month ago. There, I met one of the employees and he told me about what they do. They are a huge conference, with a main annual conference in addition to regional conferences. I will be looking further into this as our research progresses.

Interestingly, around the same time Jerome translated his Psalterium Gallicanum, Jews translated the Psalms into Aramaic, a translation known as the Targum Psalms. Both translations were loose translations, and both arguably bent words in the direction of their respective interpretations. These translations, though they happened in the 4th Century, colored many of the commentaries of the middle ages.

I’ve been looking at some examples of Christian-Jewish controversies over the Psalms in the Middle Ages. Christians took every chance possible to interpret the Psalms as Messianic prophecies, especially Messianic prophecies referring to the person of first-century Jesus. At the same time, Andrew St. Victor and Hugh St. Victor worked hard not to mistranslate texts, so that Jewish commentators could not make arguments about Christian mistranslations (which were rife in the Latin Vulgate). In doing so, Andrew and Hugh often consulted with Jewish scholars.

I’m focusing especially on commentators based in France, because these commentators had the most influence on English translators and glossers. Jewish commentators include: Rashi (and his grandson, Rashbam), Joseph Kimhi (and his two sons, Moses and David Kimhi), and Jacob ben Reuben. Although I am taking my focus off Spain and the Muslim territories of the time, a number of rabbis in Southern France migrated there from Spain after being expelled. Thus, a good amount of Sephardic influence came into France.

Some Psalms I am focusing my reading on include: Psalms 1, 2, and 137.

Although many polemics were being passed back and forth between the two religions, the polemics on the Jewish end were generally used for internal purposes, to teach Jews and keep them from falling for Christian arguments for Jesus’ Messiahship.

At the same time, in the passing around of these polemics, the use of peshat (literal interpretation of the text) became a focus, and both Jewish and Christian sides eventually were forced to focus on the text and the language itself. This focus on the text (as opposed to interpretations loosely based on the text) ended up, in my opinion, leading (centuries later) to ideas like Sola Scriptura, which obviously led to the Reformation.

For this study, I’ve mostly been reading Susan Gillingham’s books, but also an essay on Medieval rabbis by Adele Berlin.

The Chinese Mutual Funds Market Research Updates

Data Source and Implication

The research project is devised to study the assest management industry, and research the industrial organization implications of trend chasing by mutual fund investors. All the data from Wharton Research Data Services (WRDS) website were obtained from the data system of the Shenzhen Guo Tai An Education Tech Ltd. (GTA), a leading database company in China. The GTA database contains information on 966 Chinese mutual funds, including currency type funds, bond funds, index funds, and equity funds. Historical data and financial statements on China’s listed companies have been relatively complete since 1998.  Although returns of mutual funds were calculated in different time frames such quaterly, daily, or semiannually, the data were organized and standardized into annualised returns.

The data suggest that Chinese mutual funds market has become an increasingly crucial emerging market for international investors who seek to capture investment opportunities in China. 1 Given the expanding size of the country’s economy and its growing aging population needing to save for retirement, China’s mutual fund market has enormous potential for growth. However, Chinese regulations thwart all attempts by foreign fund managers to export mutual funds into China, requiring that all funds register with regulators in the country and comply with local rules. 2 Furthermore, the Chinese market requires that all fund sponsors must include Chinese-based companies. As a result, only through a joint venture with a Chinese company can foreign fund managers enter the Chinese mutual funds market. 2

Historical Descriptive Statistics

Table 1 shows the descriptive statistics used in a previous study published by Chen, H. & Chen, L.(2017). 1The mutual fund portfolio samples were categorized into five investment concentration levels per quarter: most concentrated, concentrated, common, diversified, and most diversified. When investors buy mutual funds in dollar amounts, the fund converts their investment into the exact number of shares based on the NAV at the time of their investment, even if that results in an odd number of shares. The unit of the net asset value (NAV) of mutual funds is one million Ren Min Bi (RMB). Net asset value (NAV) represents a fund’s per unit market value1. This is the price at which investors buy fund units from a fund company or sell it back to the fund. Net asset value is the daily value of a mutual fund that includes all the assets minus the fund’s liabilities converted to a per-share price. The NAV of each mutual fund share is calculated by dividing the net asset value of a mutual fund by the number of shares outstanding.

The result shown in Table 1 indicates that, the investment concentration level is inversely related to the NAV of equity mutual funds. The managers of equity mutual funds with a low NAV tend to be aggressive and take more investment risks 1. However, the portfolios classified by the industry concentration index are different from the portfolios classified by the risk level 1.


Notes: This table presents the descriptive statistics of portfolios under the evaluative criteria of the industry concentration index (ICI) and risk level. 1The industry concentration index (ICI) refers to the model proposed by Bollen and Busse (2005). 3 Risk level is obtained from the standard deviation of the residuals of the three-factor model of Fama and French (1993). 4 The study by Chen, H. & Chen, L.(2017) categorized the mutual fund sample objects into five investment concentration levels, quarter by quarter: most concentrated, concentrated, common, diversified, and most diversified portfolios. The unit of the net asset value (NAV) of mutual funds is million RMB. 1


The study published by Chen, H. & Chen, L.(2017) suggests that mutual fund managers prefer concentrating their holdings in industries where they have informational advantages over a well-diversified portfolio. The industry concentration index (ICI) is used as an essential indicator of this trend chasing by mutual fund investors. The result shown in Table 1 implies that, on average, more concentrated funds perform better after controlling for risk and style differences using various performance measures. Nevertheless, the study by Bollen and Busse (2005) discloses that superior performance is a temporary phenomenon that is observable only when funds are evaluated several times a year. 3 On the other hand, the result shown in Table 1 is buttressed by the three-factor model of Fama and French (1993), which is an asset pricing model that takes the size, value, and market risk factors into account to better measure market returns. 4 The model indicates that a security of a small firm with fewer capital assets tends to outperform that of a big-cap firm. On the other hand, a value stock, which is a security of a matured firm trading at a lower price, is likely to outperform a growth stock of a startup firm. In terms of market risk, small-cap stocks and value stocks are more susceptible to higher market risk and therefore they yield higher returns. As a conclusion, investment ability is more evident among managers who hold portfolios concentrated in a few industries.

Create Unique Identifier Example

(1) Use the data from File 1 “Daily_NAV.dta” and base the duplicate count solely on the variable “millionachievereturn“. Start by running the duplicates report command to see the number of duplicate rows in the dataset. This is followed by duplicate reports id, which gives the number of replicate rows by the variables specified; in this instance we have just “millionachievereturn.  We could have used the duplicates examples command instead of the duplicates report command.  The duplicates examples command lists one example of each duplicated set.

. use "Daily_NAV.dta", clear
. duplicates report millionachievereturn

Duplicates in terms of millionachievereturn


copies | observations surplus
-------+---------------------------
     1 |     1886      0
     2 |      966      483
     3 |      486      324
     4 |      156      117
     5 |      115      92
     6 |       18      15
     7 |        7      6
     8 |        8      7
    10 |       20      18
    11 |       11      10
1065187|  1065187      1065186
--------------------------------------

(2)To create a new variable nvalsnav from the existing variables symbol&millionachievereturn, whether each existing variable is string or numeric, type

. by symbol millionachievereturn, sort: gen nvalsnav = _n==1

This command creates a new variable nvalsnav that is 1 for the first observation for each individual and missing otherwise. _n is the Stata way of referring to the observation number; in a 10-observation dataset, _n takes on the values 1, 2, …, 10. When _n is combined with by, however, _n is the observation number within by-group, in this case, the existing variables symbol&millionachievereturn. If there were three existing variables symbol&millionachievereturn==1 observations followed by two existing variables symbol&millionachievereturn==2 observations in the dataset, _n would take on the values 1, 2, 3, 1, 2. Thus, by:if _n==1 is a way to refer to the first observation in each by-group.

. by symbol: replace nvalsnav = sum(nvalsnav)
(1,063,242 real changes made)

. by symbol: replace nvalsnav = nvalsnav[_N]
(3,661 real changes made)
. su nvalsnav

Variable | Obs         Mean   Std. Dev. Min Max
---------+-------------------------------------------------
nvalsnav | 1,068,860 1.950879 16.18818   1  286

. merge 1:m returnminusbenchmark using "/Users/yfeng47/Downloads/Daily NAV.dta"

(3)Execute one-to-many merge on variable returnminusbenchmark. The command merge joins corresponding observations from the dataset currently in memory (called the master dataset) with those from File 1 “Daily_NAV.dta” and File 2 “Fund NAV Performance.dta”, matching on the variable returnminusbenchmark.

. * merge Daily NAV.dta with Fund NAV Performance.dta

. use "Daily NAV.dta", clear

. browse

(4) Use the command isid to check whether the specified variables uniquely identify the observations.

. isid fundclassid tradingdate

. duplicates report fundclassid tradingdate

Duplicates in terms of fundclassid tradingdate

--------------------------------------
copies | observations surplus
-------+---------------------------
     1 |      1068860   0
--------------------------------------

. distinct fundclassid

Observations|   total distinct
------------+----------------------
fundclassid | 1068860 5618

. distinct symbol

Observations|   total distinct
------------+----------------------

    symbol  | 1068860  5618

. duplicates report symbol tradingdate

Duplicates in terms of symbol tradingdate

--------------------------------------
copies | observations surplus
-------+---------------------------
     1 |     1068860    0
--------------------------------------

. isid fundclassid tradingdate

. isid symbol tradingdate

. browse

. compress
variable tradingdate was long now int
variable symbol was str10 now str6
variable currencycode was str4 now str3
variable currency was str50 now str4
variable frequency was str100 now str4
(159,260,140 bytes saved)

. save "Daily_NAV.dta", replace
(note: file Daily_NAV.dta not found)
file Daily_NAV.dta saved

Conclusion: Either fund class ID or symbol, when combined with trading date, can uniquely identify each observation of data in the file.

Future Directions:

Unfortunately, the research project is discontinued because of the inconsistency of the data which hinders the next stage of running regressions and devising models to predict Chinese mutual fund investors’ behavior.  The new project will probably still investigate the Chinese Mutual Funds Market but with a focus on analysis of different data sets. Please stay tuned.


References:

1. Chen, H., & Chen, L. (2017). An Analysis of the Investment Concentration of Equity Mutual Funds in China. 53(3), 511-520. doi:10.1080/1540496X.2015.1093846

2. Hamacher, Theresa, and Robert C. Pozen. “In China, Big Opportunities for Investors, If Mutual Funds Can Find a Way In.” Brookings, Brookings, 28 July 2016, www.brookings.edu/opinions/in-china-big-opportunities-for-investors-if-mutual-funds-can-find-a-way-in/.

3. Bollen, N. P. B., and J. A. Busse. 2005. Short-term persistence in mutual fund performance. Review of Financial Studies 18 (2):569–97. doi:10.1093/rfs/hhi007.

4. Fama, E. F., and K. R. French. 1993. Common risk factors in the returns on stocks and bonds. Journal of Financial Economics 33 (1):3–56. doi:10.1016/0304-405X(93)90023-5.


The Nucleus Accumbens – The Pleasure Center of the Brain?

Danial Arslan – 11/07/17

RESEARCH UPDATE: I am currently learning about the current and past research being conducted in my lab and in other similar labs at Emory by attending talks held on campus as well as through weekly lab meetings where graduate students in the lab share articles they find interesting and discuss their recent findings. I am also going through the long, arduous process of gaining clearance at Yerkes to work on prairie voles, which includes learning how to operate on them in the most humane way while following aseptic techniques. However, to completely understand the complexity and significance of the research being pursued in the lab, my graduate mentor assigns a review paper to me on a weekly basis to bolster my basic understanding of Neuroscience. We then get together and discuss the paper after the weekly lab meeting. This week I read about the Nucleus Accumbens and the following blog is a brief introduction into the role and significance of this portion of the brain. To view my previous blog to read more about my research and goals click here.

To access the paper, I was assigned to read and from which the information below is taken, click here.


Since the discovery of the nucleus accumbens (NAc) in 1975, there has been extensive research on this compartment of the brain, especially in terms of the role this portion plays in providing motivation behind actions and ascribing ‘rewards’ to certain behaviours, such as after consuming drugs or food or after indulging in sexual acts. (Mogenson et al., 1993) As a result, this portion of the brain is colloquially referred to as the ‘pleasure center’ of the brain.

However, recently there has been a shift in the understanding of the role of the NAc in the brain, and with it there has been a shift in the research being done on this sector. This is what my assignment for this week was. To understand how the NAc worked and what had brought about the changes in its’ understanding.

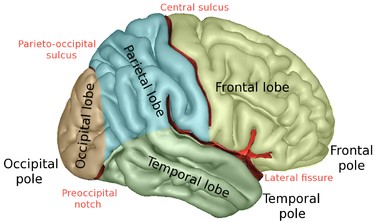
The brain is divided into 3 portions. The cerebrum, which is the largest part of the brain, is responsible for controlling all voluntary actions, and is broken down into a series of lobes. Each lobe has a different brain function. (Picture adopted from Wikipedia).

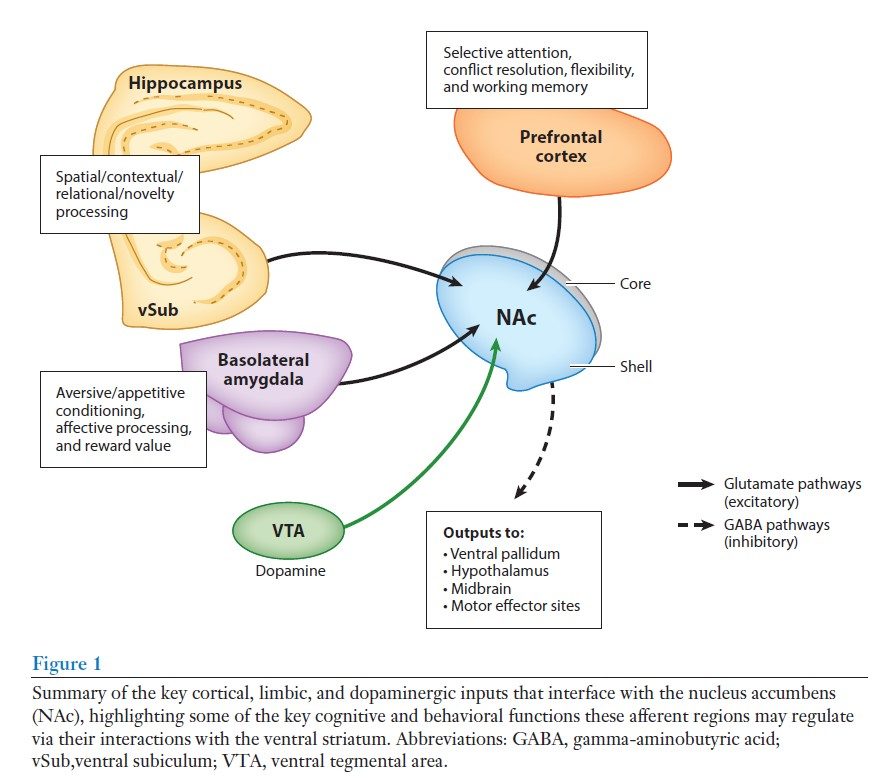
The nucleus accumbens is extremely interconnected with the limbic system of the brain. behavior. It is proposed that the NAc receives mnemonic and emotional cues from nodes in the frontal and temporal lobes of the brain and relays the nervous impulses it receives to particular motor neurons to stimulate a set of responses. Since the NAc can prioritize the sequence of responses, therefore, it can influence the type and intensity of behaviour an organism expresses to a certain cue.

The limbic system of the brain. The parts of this system play a role in motivation, emotion, learning, and memory. (Picture adopted from Pearson.com)

The NAc can be broken down into two components based on its connectivity to other regions, namely the inner ‘shell’ and the outer ‘core.’ Impulses from various regions of the limbic region enter the NAc in particular sub regions leading scientists to speculate that the two portions play distinct roles. Within each region, there is an assemblage of cellular clusters, each of which receives impulses related to a particular type of input signal.

The impulses received by the NAc involve the excitatory neurotransmitter dopamine whereas the impulses which subsequently leave the NAc make use of the gamma-aminobutyric acid (GABA) neurotransmitter. By using this inhibitory GABA neurotransmitter, the cells in the NAc cannot stimulate the same motor neurons for prolonged periods of time (Pennartz et al. 1994, Uchimura et al. 1989). This means motivationally developed patterns of behaviour could not be formed by the activation of the neurons leaving the NAc and therefore changes in behavioural patterns must be formed due to changes in the excitation of the NAc by the incoming neural impulses transmitted from the temporal and frontal lobes through the glutamine neurotransmitter.

Therefore, it can be argued that the NAc is analogous to a messenger which passes information from the receiving end to the outgoing ‘motor’ end and that which outgoing pathway it conveys the message to or how many times it conveys the message is based on the suggestions or commands from the cortical and limbic regions of the brain rather than it being based on the judgement and determination of the NAc itself. One could say that the NAc acts like a ‘servant to many systems’ rather than acting like a decision-making center where it would ascribe responses on its own.

Figure adopted from the review paper.

Research findings also show that the reward-related actions which have been previously attributed to the NAc do not appear to in fact require the NAc at all. Reynolds & Berridge (1998), for example, showed that inactivating the NAc did not reduce food consumption by rats, but instead seemed to increase their appetite signifying that they were finding food consumption to be more rewarding when the neural activity of the NAc was suppressed.  Moreover, Berridge KC (2007) found that hedonic reactions exhibited after consuming food seemed to be independent of whether the NAc was suppressed or not. In conclusion, the pattern of actions done by individuals, related to gaining a ‘reward’ seems to be independent of the functioning of the NAc.

Therefore, the persistence to show that the neural accumbens as the ‘pleasure and reward system’ of the brain, might actually be a gross simplification and exaggeration of what the function and role of the neural accumbens in our brain really is. As a result, this particular portion of the brain continues to garner vast interest within the Neurobiology community, even 40 years after its discovery.

REFERENCES:

  • Berridge KC. 2007. The debate over dopamine’s role in reward: the case for incentive salience. Psychopharmacology 191(3):391–431
  • Berridge KC, Robinson TE. 1998. What is the role of dopamine in reward: hedonic impact, reward learning, or incentive salience? Brain Res. Rev. 28(3):309–69
  • Pennartz CMA, Groenewegen HJ, Lopes Da Silva FH. 1994. The nucleus accumbens as a complex of functionally distinct neuronal ensembles: an integration of behavioural, electrophysiological and anatomical data. Prog. Neurobiol. 42(6):719–61
  • Uchimura N, Cherubini E, North RA. 1989. Inward rectification in rat nucleus accumbens neurons. J. Neurophysiol. 62(6):1280–86
  • Mogenson GJ, Brudzynski SM, Wu M, Yang CR, Yim CY. 1993. From motivation to action: a review of dopaminergic regulation of limbic→nucleus accumbens→ventral pallidum→pedunculopontine nucleus circuitries involved with limbic-motor integration. In Limbic-Motor Circuits and Neuropsychiatry, ed. PW Kalivas, CD Barnes, pp. 193–263. Boca Raton, FL: CRC Press
  • Floresco, S.B., 2015. The nucleus accumbens: an interface between cognition, emotion, and action. Annual review of psychology66, pp.25-52.

A 2 minute recap on the  nucleus accumbens and what was discussed in this blog.