SimplyAnalytics is now offering COVID-19 data at the national, state, and county levels, updated daily. The data is sourced from USAFacts.org.
Data variables included are:
- Confirmed COVID-19 Cases by date
- Prevalence of confirmed COVID-19 cases (per 100,000 individuals) by date
- Deaths from COVID-19 by date
- Prevalence of deaths from COVID-19 (per 100,000 individuals) by data
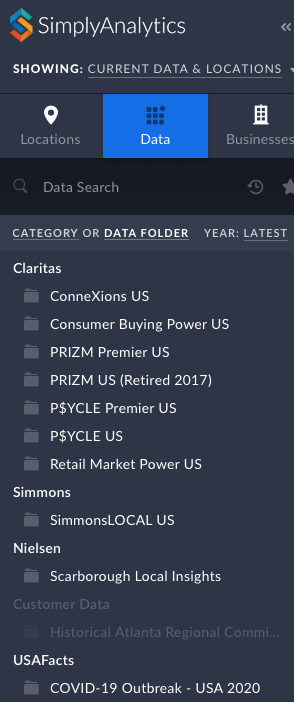 The easiest way to locate and search the COVID-19 data is:
Choose the Data tab
Click on the Data Folder view (located just below the data search box)
Scroll to the list of data folders where you’ll see the USAFacts data.
This data can be combined with demographic and health data variables to identify areas with vulnerable residents, such as the elderly, people with respiratory illnesses, and smokers.
Some of the best ways to view this data in SimplyAnalytics:
- Map View: map the COVID-19 data by County or State
- Ranking View: rank all counties in the United States to identify areas with the highest counts or rates of COVID-19
- Comparison Table View: add your counties and states and any COVID-19 variables to this report to compare rates over time
- Related Data Table View: add one variable from a folder to this view and the rest will be added automatically
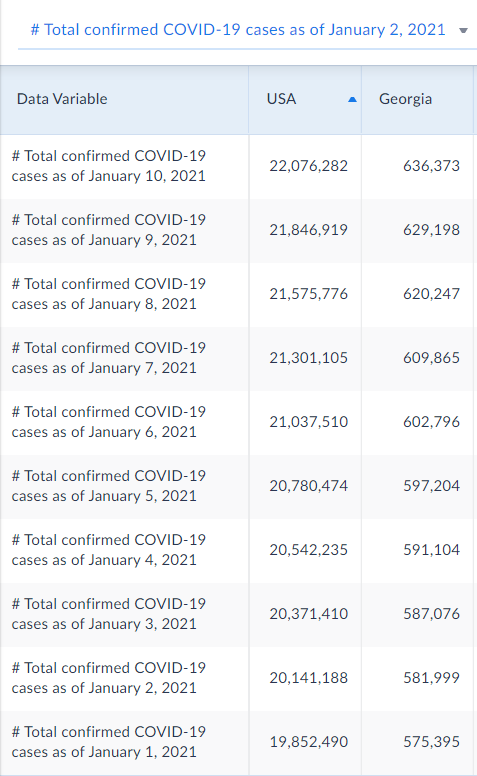
For example, if you choose the variable, # Total confirmed COVID-19 cases as of January 2, and then choose the Related Data Table view, you’ll pull data for all the additional days in January that are available. In the sample search below, I added Georgia in the Location tab.