Category Archives: Uncategorized

Love In Paris!

If you know me, you’ll know that one of my favorite films is the French movie, “Amélie” (2001). Set in none other than the charming French village of Montmartre, “Amélie” tells a whimsical story of attraction and love. Once a hub for working-class citizens, Montmartre drew many artists with its liberal reputation. Renowned painters van Gogh, Renoir, and Toulouse-Lautrec were among the many to call the village home (Myers, 2007).

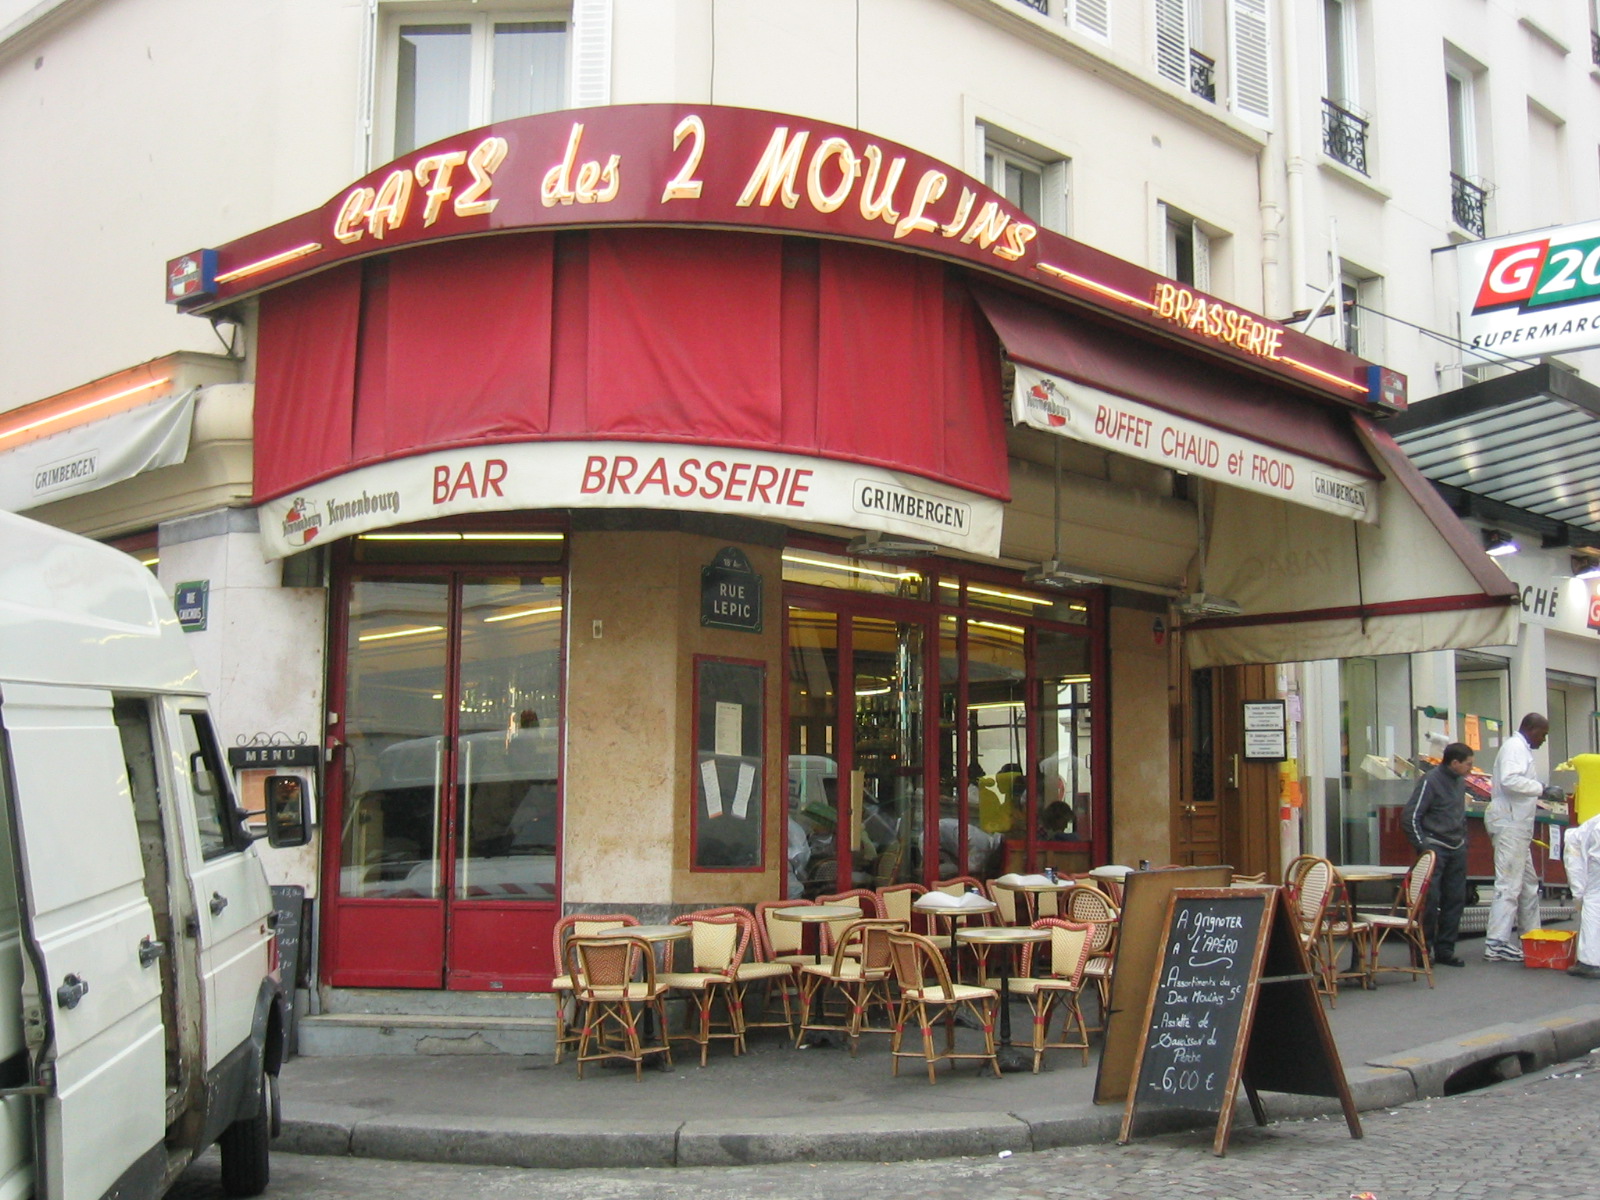
In the film, Amélie works for the Monsieur Collignon at the Café des 2 Moulins, a real location in Montmartre.

I was thrilled to visit the village with a group of my friends. After a few hours exploring, one particular sight remained with me. A gate heavy with love locks — a common sight in the so-called city of love and a symbol of couples’ eternal love. Between the love locks, the cobbled streets, and Le Mur des Je T’aime, my Montmartre, like Amélie’s, spoke of whimsy and love.

Spanning 40 square meters, Le Mur des Je T’aime was created in 2000 and features the phrase “I love you” in 250 different languages. The red fragments represent pieces of a broken heart, and the wall itself represents the capacity for healing through love.

Theories of love have evolved and developed constantly for centuries. Some of us believe in love at first sight. Others, like those who hang their locks upon gates, believe in eternal love. All of us have experienced love in some form or another, whether it be companionate, romantic, or maternal.

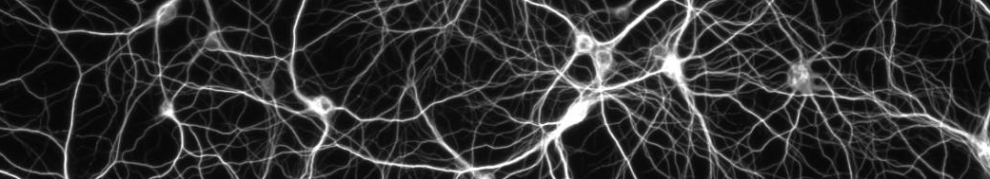
One study aiming to answer the question of whether romantic love lasts, observed through functional magnetic resonance imaging (fMRI) that the test subjects, 10 women and 7 men in reported long-term romantic relationships,  exhibited significant brain activity in dopamine-rich areas and areas associated with maternal love when shown images specific to their romantic partners (Acevedo et al., 2012). Responses to long-term partners’ images were measured alongside control images of close friends, familiar acquaintances, and low-familiar acquaintances. Researchers gave participants questionnaires measuring romantic love, obsession, IOS (closeness with one’s partner), friendship-based love, sexual frequency, and relationship length. In short, activation patterns in patients’ brain regions suggested that subjects experienced pleasure when presented with stimuli related to their long-term romantic partners. The ventral tegmental area (VTA), an area of the brain often generally associated with romantic love, showed activation in long-term relationships as well. Interestingly, among activated regions was the posterior hippocampus, an area that seems to activate in response to hunger or cravings (LaBar et al., 2001; Pelchat et al., 2004) — which makes me feel a tiny bit better about my love for ice cream.

While signifiers of romantic love activated dopamine-rich brain areas related to desire, those related to friendship largely activated opiate-rich ones related to pleasure. The study cites a key distinction previously established by researchers Berridge and Robinson, between  “wanting” and “liking,” that positions the two as mutually exclusive. While wanting someone is related to the reward that long-term romantic bonds connote, liking someone is more so an aspect of attachment and pair-bonds. Acevedo and her team wrote that, as a drive, romantic desire is unlike basic emotions in that it is comparatively goal-driven and “hard to control” (Acevedo et al., 2012). They observed that the brains of those in long-term romantic relationships also exhibited significant activity in the opiate- and serotonin-rich areas associated with friendly attachment — activity that is absent from early-stage romance.

Romantic partners attach their locks to this gate in Montmartre to eternalize their love. Love locks are a common sight across Paris.

An article published by Song et al. in 2015 focuses on a similar study that supports the role of romantic love in altering brain architecture, results which align with those of previous fMRI studies (Song et al., 2015). Song et al. acknowledges the work of Acevedo et al. in using fMRI to propose brain regions related and unrelated to romantic love, as well as the work of later researchers (Cacioppo et al., 2012) in dividing these identified regions into those responsible for emotion, reward, and memory, and those responsible for social cues and memory. One weakness of the present study is its longitudinal approach, a model which often resists laboratory control. Song et al. suggest that future research conducted on the topic implement cognitive and behavioral tasks to directly test the hypothesis that love-related alterations of resting brain function reflect an evolutionary drive to select the most fit partner (de Boer et al., 2012). Still, despite its limitations, the study by Song et al. is ultimately valuable because it highlights the function of romantic love.

Ultimately, the study by Acevedo et al. posits that long-term relationships can sustain reward- and value-based brain signals similar to those typically observed during the beginning stages of love, while also fostering the type of “liking” associated with friendly attachment and bonding. In other words, long-term romantic love is possible, and one can love their partner and be their best friend, too.

Of the hundreds and thousands of Parisians and tourists who’ve eternalized their romances on locks upon the fences of Paris, maybe some will succeed. All of us will find love in Paris, whether it be with the city, other people, or life itself. And I can’t wait to find out what comes my way!


References

Acevedo BP, Aron A, Fisher HE, Brown LL (2012) Neural correlates of long-term intense romantic love. Social Cognitive and Affective Neuroscience 7:145-159. https://doi.org/10.1093/scan/nsq092.

Cacioppo S, Bianchi-Demicheli F, Frum C, Pfaus JG, Lewis JW (2012) The common neural bases between sexual desire and love: a multilevel kernel density fMRI analysis. The Journal of Sexual Medicine 9:1048-1054. https://doi.org/10.1111/j.1743-6109.2012.02651.x.

de Boer A, Van Buel EM, Ter Horst GJ (2012) Love is more than just a kiss: a neurobiological perspective on love and affection. Neuroscience 201:114-124. https://doi.org/10.1016/j.neuroscience.2011.11.017.

LaBar KS, Gitelman DR, Mesulam MM, Parrish TB (2001). Impact of signal-to-noise on functional MRI of the human amygdala. Neuroreport 12:3461–4.

Myers N (2007) The Lure of Montmartre, 1880–1900. Heilbrunn Timeline of Art History.

Paris Convention and Visitors Bureau (n.d.) Le mur des je t’aime. Paris.

Pelchat ML, Johnson A, Chan R, Valdez J, Ragland JD (2004) Images of desire: food-craving activation during fMRI. Neuroimage 23:1486–93.

Song H, Zou Z, Kou J, Liu Y, Yang L, Zilverstand A, Uquillas Fd,  Zhang X (2015) Love-related changes in the brain: a resting state functional magnetic resonance imaging study. Frontiers in Human Neuroscience. https://doi.org/10.3389/fnhum.2015.00071.

Image 1, Café des 2 Moulins from “Amélie” (2001): Wikimedia Commons.

Images 2-3 were taken by myself.

my bubble has been popped

It’s 9 AM – rush hour on the metro. The platform is packed and the people of France know very little regarding personal space. As the offensive warning of door closure sounds, it’s as if the lid to a tightly packed sardine tin is being jammed shut. Looking around, the only person that might give you a smile is the baby in the stroller, the rest adorn deadpan expressions, chatter is low, and the screech of the metro rings through my ears. As a man stands on my foot and the hair of the woman in front of me grazes across my lips, the words “excusez-moi” or “pardon” fail to be uttered. It is a way of life and, honestly, I was probably in the way.

A typical platform of the RER after a full ride.

This unapologetic lack of personal space can be attributed to the amygdala based on an fMRI study done by Kennedy et al. (2009). A bilateral lesion of the amygdala resulted in very little regard to personal space. The amygdala plays a role in strong emotional responses and in this case, in regards to the proximity to others. In this experiment, a patient with bilateral lesions of the amygdala felt comfortable with an individual at a significantly closer distance than a healthy individual reported. Given my experience on the metro, I predict that my amygdala activity was quite high.

In another study done by Graziano and Cooke (2006), it was found that the ventral intraparietal area (VIP) and a polysensory zone in the precentral gyrus (PZ) both respond to objects that are touching or looming toward the body’s surface. These areas give rise to the ‘personal space bubble’ that most of us cherish in the United States. In fact, stimulation of these areas can result in defensive behavior such as avoidance or blocking maneuvers (Graziano and Cooke, 2006). My New Englander mentality reports that a quick elbow nudge or jerk of my foot from beneath my fellow passenger’s may send the message of my discontent but, apparently not.

In a different context, in a study of Borderline Personality Disorder patients, amygdala and parietal cortex activation of patients was lower than baseline when in close proximity to others (Schienle et al., 2015). Invasion into the subject’s ‘personal bubble’ was simulated by zooming in on pictures of facial expressions. Borderline Personality Disorder patients only showed increased activation in these areas if the facial expression showed disgust. Otherwise, there was very little concern with a lack of personal space in comparison to the control patients.

An average metro ride.

Perhaps the French have evolved to have lower activation in the amygdala and parietal cortex? Just food for thought. Either way, I know that I’m certainly not used to it and for about 35 minutes on the metro (and many other places) I feel like my bubble has been popped. Everything and everyone is about 5 inches closer to my body than it should be…but maybe my amygdala and parietal cortex will adapt as the weeks go on!


Graziano MSA, Cooke DF (2006) Parieto-frontal interactions, personal space, and defensive behavior. Neuropsychologia 44: 845-859. doi: 10.1016/j.neuropsychologia.2005.09.009

Kennedy DP, Gläscher J, Tyszka JM, Adolphs R (2009) Personal space regulation by the human amygdala. Nature Neuroscience 12: 1226-1227. doi: 10.1038/nn.2381

Schienle A, Wabnegger A, Schöngassner F, Leutgeb L (2015) Effects of personal space intrusion in affective contexts: an fMRI investigation with women suffering from borderline personality disorder. Social Cognitive and Affective Neuroscience 10(10): 1424–1428. doi: 10.1093/scan/nsv034


Fake v. Authentic Paintings

I can’t believe time has flown so fast! It feels like not so long ago I was looking for my sketchbook to pack into my bag (which I totally forgot last minute), and now I’m sitting at my last French café before departing. As an artist, one of the things I was looking forward to the most before my trip was the art. The creativity surrounding every corner, from paintings in a museum to music in your every corner to that little pastel house around the corner you last remember turning at, Paris itself is truly a work of art. As I first wrote on my Facebook wall after my first day in the city:

“He who contemplates the depths of Paris is seized with vertigo. Nothing is more fantastic. Nothing is more tragic. Nothing is more sublime.”

-Victor Hugo

While my group and I were touring the Chateau D’Amboise, I was legitimately blown away to get to see da Vinci’s bury place inside the royal chapel. He is my greatest inspiration as both a scientist and an artist. I have grown up not only watching documentaries about him but also reading copies of his notebooks. I wanted to scream, shake, and cry all at once.

The royal chapel inside the Chateau D’Amboise.


Leonardo da Vinci’s tomb.

I’m a bit embarrassed to admit that I couldn’t tell which ones were replicas and which ones were real. So I had to ask the tour guide every now to verify my predictions. That brought to mind a study I had previously read about how our brain responds differently when we think we are viewing authentic paintings v. replicas.

In this study, participants were familiar with Rembrandt (an Amsterdam-based artist famous for his portraits), but had no formal art instruction. Participants were shown pictures of authentic paintings or replicas for 15 seconds each. Before each painting, a voice recording told the participants whether the painting they were about to see was a fake or an authentic Rembrandt painting. For half of each paintings shown (authentic or replicas), participants were mislead into thinking an authentic was a fake or vice versa. Participants were not told how to view the paintings, but rather were just given 15s to view them as they pleased.

Figure 1A-B. Sample images researchers used. Which one do you think is the fake? (Huang, Bridge, Kemp, & Parker, 2011).


Figure 1C. Shows the timing of pause (9s), the audio telling if the paint will be real/fake (6s), and the painting (15s). (Huang et al., 2011).

While viewing, participants were in a scanner. Researchers used functional Magnetic Resonance Imaging (fMRI) to view brain activity. An fMRI does not really view brain activity but changes in oxygenation levels, or the Blood Oxygenation Level Dependency (BOLD) signal (Oxford Centre for Functional MRI of the Brain, n.d.). Since neurons that are more active need more oxygen, it is a good measure to estimate brain activity. To the researchers surprise, more brain activation occurred while participants were viewing fake paintings.

Areas known to be involved with vision in the occipital and temporal lobe such as the fusiform gyrus (involved in face processing) did NOT show a difference in activation in real v. fake.

Occipital (purple) and temporal (green) lobes of the brain. (Vidal, Perrone-Bertolotti, Kahane, & Lachaux, 2015).


However, researchers did find differences in activations in other non-visual brain areas such as the frontopolar cortex (FPC) in visual-spatial memory (Costa et al., 2013) and decision-making (Laureiro-Martínez et al., 2014). The right precuneus was also more active, which is involved in visuo-spatial imagery and self-referential (or tasks involving thinking about oneself) (Cavanna & Trimble, 2006). Lastly, the researchers also found greater activation in the middle frontal gyrus in response to when participants were told the paintings were copies. The middle frontal gyrus is involved in attention (Japee, Holiday, Satyshur, Mukai, & Ungerleider, 2015). The orbitofrontal cortex is associated with memory (Frey & Petrides, 2000) and regulating emotions (like how you react to them) (Frey & Petrides, 2000).

Figure 2A. Shows the areas found to be activated higher when participants were told to view fake v. authentic paintings (Huang et al., 2011). Gray (less) – Yellow (more activated).

The researchers discuss these findings by suggesting that the FPC could be active in response to them recalling visual memories and ‘hypothesizing’ whether the artwork shown is authentic or fake (Huang et al., 2011). The precuneus is active when viewing things and visual imagery, so this area could be active in response to seeing the artwork. The orbitofrontal cortex (OFC), aside from memory and emotion regulation, the researchers mention is involved in reward. Therefore, researchers suggest that this area became active in response to thinking about how the price of the artwork would change if the artwork is a fake (Huang et al., 2011).

In all, these findings suggest that, like me, people build hypotheses about whether an artwork is real or a fake while they view them. And whether we think they are fake or real change how our brains respond to it, bringing in different memory processes (FPC) to maybe compare across different real or fake artworks we have previously seen. Maybe thinking about whether it is real or not affects how we feel (OFC) about it. This study suggests that thinking something is a copy of someone else’s work changes how we think about them, possibly changing how we feel and how much we value the work.

Works Cited

Cavanna, A. E., & Trimble, M. R. (2006). The precuneus: a review of its functional anatomy and behavioural correlates. Brain, 129(3), 564–583. https://doi.org/10.1093/brain/awl004

Costa, A., Oliveri, M., Barban, F., Bonn?, S., Koch, G., Caltagirone, C., & Carlesimo, G. A. (2013). The Right Frontopolar Cortex Is Involved in Visual-Spatial Prospective Memory. PLoS ONE, 8(2), e56039. https://doi.org/10.1371/journal.pone.0056039

Frey, S., & Petrides, M. (2000). Orbitofrontal cortex: A key prefrontal region for encoding information. Proceedings of the National Academy of Sciences of the United States of America, 97(15), 8723–7. https://doi.org/10.1073/pnas.140543497

Huang, M., Bridge, H., Kemp, M. J., & Parker, A. J. (2011). Human cortical activity evoked by the assignment of authenticity when viewing works of art. Frontiers in Human Neuroscience, 5, 134. https://doi.org/10.3389/fnhum.2011.00134

Japee, S., Holiday, K., Satyshur, M. D., Mukai, I., & Ungerleider, L. G. (2015). A role of right middle frontal gyrus in reorienting of attention: a case study. Frontiers in Systems Neuroscience, 9, 23. https://doi.org/10.3389/fnsys.2015.00023

Laureiro-Martínez, D., Canessa, N., Brusoni, S., Zollo, M., Hare, T., Alemanno, F., & Cappa, S. F. (2014). Frontopolar cortex and decision-making efficiency: comparing brain activity of experts with different professional background during an exploration-exploitation task. Frontiers in Human Neuroscience, 7, 927. https://doi.org/10.3389/fnhum.2013.00927

Oxford Centre for Functional MRI of the Brain. (n.d.). Introduction to FMRI — Nuffield Department of Clinical Neurosciences. Retrieved July 5, 2017, from https://www.ndcn.ox.ac.uk/divisions/fmrib/what-is-fmri/introduction-to-fmri

Vidal, J. R., Perrone-Bertolotti, M., Kahane, P., & Lachaux, J.-P. (2015). Intracranial spectral amplitude dynamics of perceptual suppression in fronto-insular, occipito-temporal, and primary visual cortex. Frontiers in Psychology, 5. https://doi.org/10.3389/fpsyg.2014.01545

Does Marijuana REALLY relieve stress?

Hello everyone! I’m back (:

Well, this is now the end of my fourth week in Paris. There’s only one more week left, HOLY COW! Since I’ve been here, I think I have pretty much adjusted to the culture. I still smile when I see strangers, but I’ve just accepted the fact that they probably will not smile back.

However, there is one part of the culture I haven’t quite adjusted to yet… SMOKING! I heard before traveling here that smoking cigarettes is very common in Paris, and these rumors were not false. In Paris, you will literally see people smoking absolutely anywhere… at the train station, sitting at a restaurant, and I have even seen workers smoking while on duty. In America, smoking is much more moderated. There are designated areas for smoking and non-smoking. Here, smoking is the norm. I am pretty sure I have not seen one “non-smoking” sign since I have been here.

I expected that majority of people would smoke cigarettes, which is true. However, I was surprised by the vast amount of people I have seen smoking marijuana. I have seen multiple people on the train rolling up a joint, or even people walking down the street smoking it with no concerns whatsoever.

One day, a couple of my friends and I decided to head out for dinner. We were going to get Thai food at some restaurant we found on google (yep, still an avid google user).

As we were looking for the restaurant, the navigation led us down some weird side street. On  that street, we walked past a group of young girls sitting on the porch SMOKING MARIJUANA. Honestly, the girls looked no more than 13-14 years old. I was completely shocked. It was basically babies smoking weed.

The babies smoking on the porch. (Not actually, but this is how I perceived it.)

Okay, so this got me thinking. I knew marijuana had become increasingly prevalent in America just from my own experience. Marijuana references can be found all over social media, in music, television… it has really become a major part of pop culture. If you don’t want to take my word for it, The National Institute on Drug Abuse reports that, “Marijuana is the most commonly used illicit drug (22.2 million people have used it in the past month).” They also state that marijuana use is widespread among adolescents and young adults, specifically 8th-12th graders. WHY ARE SO MANY CHILDREN SMOKING!!!

In my experience, any time I have asked someone why they smoke marijuana, they claim that it helps relieve stress. Even in popular music, artists sing/rap lyrics about getting high to relax. I’m sure you all are familiar with Drake, one of the most popular music icons of the decade (I loveeee Drake, so I’m bias. But he really is extremely popular). In his song “Fear”, which has over 6 million plays on youtube, he says, “I been getting high just to balance out the lows.” I personally have seen this one line quoted several times on twitter by tons of people. Also, New Frontier Data’s 2017 Cannabis Perceptions Survey reports that of users, 55% say they use it for relaxation purposes, and 40% say they use it to relieve stress.

This made me wonder, how true is this? And if it is really true, what part does our brain play in making marijuana relaxing?

It was already well known that there are areas in the brain called receptors that are specifically for cannabis (another common name for marijuana) to bind to and create an effect in the body. However, a study by Ramikie et al. (2014) found for the first time that there are cannabis receptors in the Central Amygdala. This was a HUGE deal because the amygdala is the structure in the brain that is involved in regulating anxiety and the stress response. Having cannabis receptors in that specific region could help explain why marijuana users say they take the drug mainly to relieve stress and anxiety.

These receptors in the brain weren’t created intentionally to bind marijuana, though. Our body has its own natural form of cannabis, called endo-cannabinoids, that it releases to bind to these receptors. The receptors are located in various regions of the brain, so when the endo-cannabinoids bind there can be a multitude of effects on pleasure, memory, thinking, concentration, movement, coordination, and sensory and time perception. THC is the major chemical in marijuana, and according to the National Institute of Drug Abuse, it has a very similar chemical structure to one of the body’s natural endo-cannabinoids, anandamide. This similarity in structure allows the THC to trick the cannabis receptors into thinking it is an endo-cannabinoid. The THC binds to the receptors in place of the endo-cannabinoids,  and thus, marijuana can also have similar effects on the body.

Anandamide vs THC

This image shows how THC can bind to the cannabis receptors in place of the endo-cannabinoids, thus regulating many body functions.

Similar to humans, mice also have these cannabis receptors and natural endo-cannabinoids in their brains. Ramikie et al. (2014) wanted to understand the role of endo-cannabinoids, and their effect on the central amygdala. To do this experiment, they used a mouse model and fluorescently labelled the cannabis receptors so that they could be easily visualized using special microscopy techniques. They specifically observed the amygdala, and found that there actually were a significant number of cannabis receptors present in this area. They also found that the amygdala creates and releases its own natural endo-cannibinoids.

So what exactly does all of this mean? By finding cannabis receptors in the amygdala, and knowing that THC can bind to these receptors, researchers have potentially identified exactly how marijuana regulates stress and anxiety. However, there are down sides to this. When a person smokes marijuana, THC overwhelms the cannabis receptors by quickly attaching to them in place of the endo-cannabinoids. This interferes with the ability of the natural cannabinoids to do their job of regulating bodily functions, which can throw the entire system off balance (Scholastic 2011). So yes, while marijuana’s THC can reduce anxiety, chronic use of the drug down-regulates the receptors, which will actually increase anxiety. Down regulation occurs because over-activation of the receptors causes them to become less sensitive to the cannabis or endo-cannabinoids binding to them, which causes the receptors to need more cannabis in order to regulate natural bodily functions. This can lead to a habitual cycle of increasing marijuana use that, in some cases, leads to addiction.

What is great about this article is that the researchers used a relatively common imaging technique to understand a popular phenomenon. By finding the cannabis receptors within the amygdala, this study introduced ground breaking research that demonstrated how exactly marijuana can potentially regulate stress and anxiety, when used in moderation.  However, this study was limited because it only set out to locate the receptors and see their activity. There should have been a behavioral aspect to the study to determine how activation of the cannabinoid receptors changes behavior. The amygdala has a multitude of functions, and by including a behavioral aspect to the study, we would have been able to see exactly which functions the endo-cannabinoids play a part in.  Going forward, it would be interesting to test the effects of THC on these receptors in mice, and actually observe the effects of different amounts during a stressful situation.

So to answer my earlier question– yes, I guess it is true that marijuana really does relieve stress (when used in moderation). Neuroscience really does have the answer for everything!

Thanks for reading!

-Janet


References:

Ramikie T, Nyilas R, Bluett R, Gamble-George J, Hartley N, Mackie K, Watana M, Katona I, Patel S (2014) Multiple Mechanistically Distinct Modes of Endocannabinoid Mobilization at Central Amygdala Glutamatergic Synapses. Neuron 81(5): 1111-1125.

“The Science of the Endocannabinoid System: How THC Affects the Brain and the Body” (2011) Scholastic.

Map from Google Maps.

Children Smoking: https://www.dhushara.com/book/twelve/tw2.htm

National Institute on Drug Abuse: https://www.drugabuse.gov/publications/research-reports/marijuana/what-scope-marijuana-use-in-united-states

Drake youtube reference: https://www.youtube.com/watch?v=DcQzATCJpBA

New Frontier Data’s 2017 Cannabis Perceptions Survey: https://newfrontierdata.com/marijuana-insights/people-use-cannabis/

THC & anandamide: https://www.drugabuse.gov/publications/research-reports/marijuana/how-does-marijuana-produce-its-effects

THC & Cannabis receptor: http://headsup.scholastic.com/students/endocannabinoid

More Macarons, Please!

Bonjour tout le monde! Our time in Paris is wrapping up, and I can’t decide exactly how that makes me feel. One the one hand, I’m so ready to be home and see friend and family that I’ve missed dearly. But, on the other hand, there a few things that I will miss about Paris. I’ll miss the gorgeous architecture that can be found down every street, the fresh baguettes that I’ve been eating for lunch almost every day, and lots of other aspects of Paris that make this city so special. The one thing that I’ll miss most of all, though, is being able to grab a classic French macaron whenever I want.

France has a plethora of staple foods and sweet treats, but macarons are my favorite by far. They’re sweet meringue-based sandwich cookies that have some sort of crème or jelly in the middle. If you’ve never tried one before, then you’re missing out. If you’re ever visiting Paris and looking for a high quality French macaron, I would wholeheartedly recommend trying a few from Christophe Roussel’s shop near Sacred Coeur.

Christophe Roussel’s street window

By using flavor combinations that range from classic vanilla to more intricate passion tarragon, Christophe Roussel has designed a fantastic dessert that pleases most palates. There’s not a single flavor that I have tried that I don’t like, but, in my opinion, their dark chocolate-coated caramel macaron is the best. I

Wide range of delicious flavors

have visited their shop a few times and gotten an assorted box during each visit that I have intended to share with all of my classmates, but I never have. This isn’t because I’m selfish or greedy, though. It’s because, even when I’m trying to eat healthier, I can’t control myself from eating most, if not all, of them in one sitting! It makes me feel like a weak-willed foodie with little self-control, but I’d like to think that a lot of people can relate to me. Sometimes it seems almost impossible to just eat one sweet! Other people, though, find self-control a much easier concept and can resist macaron binge-eating sessions. What makes them different from me? Why does it seem like macarons have such power over my willpower? Interestingly enough, one of our classes recently analyzed a paper that explained the impact that reward systems in the brain have over regular hunger feeding behaviors in mice (Denis et al. 2015).  Although this study was super intriguing, I wanted to learn more about this phenomenon specifically in humans, so I did some PubMed searching. Here’s what I found…

Who can resist these?!

The overconsumption of foods with high levels of sugar and fat overrides thenormal mechanisms that regulate appetite, which leads to people with these diets eating for pleasure rather than nourishment alone (Wiss et al. 2016). To explain this process, researchers have created a “food hypothesis” which proposes that exposure to higher calorie foods alters the brains reward circuitry, leading to people eating these foods not because they’re hungry, but because it feels rewarding (Leigh and Morris 2016). This rewarding feeling that results from eating higher levels of sugar and fat can lead to binge-eating, and possibly even food addiction. There are some people who aren’t as susceptible to this addictive power of sugar, though. What makes them different from me, who can’t seem to eat one macaron at a time? 

Ely and colleagues conducted a study to understand if there’s a difference in activation of brain regions that are involved in different people’s vulnerability of overeating sweet foods (2014). They compared brain activation in response to food cues by taking fMRI images of females who never dieted, females who had previously dieted sometime in their life, and females who were currently on a diet. These fMRI images measure the amount of blood flow in the brain when performing certain tasks, and researchers can infer that this change in blood flow means that a certain area of the brain is activated when performing that task. Their results showed that females with histories of dieting had increased activation in reward circuitry areas when showed tastier foods compared to both females currently on a diet as well as females who never diet. This relationship between groups suggests that when dieting, the vulnerability to high sugar and fat foods is temporarily reversed.

My cute little Christophe Roussel package

I was surprised by the results of this study. I expected the rewarding effects of higher caloric food to be more powerful in women that were dieting, but I guess it makes sense that they’re less vulnerable to the temptations of sweets because they’ve made a conscious choice to eat healthier. I think this study was strongly conducted, as well. Their choice of fMRI methods of imaging allowed the activation of specific areas of the brain to be measured while at the same time being stimulated by different foods. One thing I wish they would have done differently, though, is controlled for menstrual cycle. It has been shown in multiple studies that phases of women’s menstrual cycle affect their food cravings, so I’m not sure if that may have swayed the data at all.

As my time in Paris is coming to an end, I don’t think I’m going to want to go on a diet to prevent myself from succumbing to the temptation of the macaron. I’ll allow myself maybe one more indulgence so I can remember the sweetness of my time here. Hopefully I can learn a little bit of self-control, though, because I’m hoping to bring back a few as souvenirs for my family. They probably wouldn’t appreciate an empty macaron box. 🙂

If you ever make a trip to Paris, you really should buy a few macarons from Christophe Roussel’s shop. I promise that you won’t regret it!

Christophe Roussel’s location


References:

Denis RP, Joly-Amado A, Webber E, Guler AD, Magnan C, Luquet S (2015) Palatability can drive feeding independent of AgRP neurons CellPress 22: 646-657.

Ely AV, Childress AR, Jagannathan K, Lowe MR (2014) Differential reward response to palatable food cues in past and current dieters: an fMRI study Obesity 22: E38-45.

Leigh SJ and Morris MJ (2016) The role of reward circuitry and food addiction in the obesity epidemic: an update Bio Psychol 16: 30376-3.

Wiss DA, Criscitelli K, Gold M, Avena N (2017) Preclinical evidence for the addition potential of highly palatable foods: current developments related to maternal influence Appetite 115: 19-27.

All of the pictures included in this post were taken by myself.

The screenshot of the Map was taken from GoogleMaps.


Speaking Without Words

Hello family and friends,

As my time in Paris comes to a close, I look back on everything I have learned during these speedy four weeks. From analyzing primary articles to visiting the libraries of famous French neurologists, it has truly been an enlightening experience. Nevertheless, one of the hardest aspects of studying abroad has been the language barrier. Knowing only a handful of French phrases, I have had to use alternative methods of communication in a variety of social contexts. After spending ample time interacting with Parisians, I find myself growing less anxious in my daily exchanges with non-English speakers. Instead, I take comfort in the fact that nonverbal communication can be as effective, if not more effective, than verbal communication. Interested in the broad category of nonverbal communication, I took it upon myself to do a little more research. As it turns out, what I found relates to the grand field of neuroscience.

First off, let me start by asking what you think of when you hear the phrase “nonverbal communication”. Personally, I imagine someone using a simple combination of facial expressions and bodily gestures to convey meaning. However, after reading a new study on the phenomenon, I realize that the cognitive processes involved in nonverbal exchanges are quite complex. Let me explain.

In a study led by Alexandra Georgescu from the University Hospital of Cologne in Germany, researchers delved into two types of perceived human motion, movement fluency and movement contingency, and their relationship to nonverbal interactions (Georgescu et al., 2014). For reference, movement fluency is the quality of one’s motions. Movement contingency is coordinated patterns of movement between two people. Thus, fluency deals more with the individual while contingency depends on the interactive dynamic between two people. What is the importance of these terms? Well, through their experimental design, Georgescu et al. found that manipulating movement fluency and contingency changes our perception of the “naturalness” of a nonverbal social interaction. Looking into the neural correlates involved with this perception, Georgescu et al. hoped to learn more about the processes occurring in the brain during nonverbal social interactions.

Figure 1. The four experimental video conditions.

In order to study movement fluency and contingency in the context of nonverbal social interactions, researchers measured the brain activity of study participants as they watched virtual dyadic interactions, or interactions between a pair. By virtual, I mean experimenters presented a silent video showing two mannequins interacting with one another (Figure 1). The goal here was to evaluate the brain’s response to natural and unnatural movements committed by the mannequins during their interactions. By doing this, researchers hoped to determine the neural networks involved in perceiving motion during nonverbal exchanges. Two kinds of motional manipulations were used during presentation of videos. The first targeted motion fluency by altering the smoothness of each mannequin’s movements. Here, alterations resulted in mannequins making rigid, robot-like movements. The second targeted motion contingency by eliminating one of the mannequins and having a mirror image of the remaining mannequin take its place. Here, Georgescu et al. reasoned that mirrored movements of the one mannequin would be interactively meaningless and thus non-contingent. Four 10-second videos were used, each presenting a different combination of manipulated and non-manipulated movements (refer back to Figure 1). Participants watched the videos while their brain activity was monitored by a functional magnetic resonance imaging (fMRI) machine. After presentation of each video, participants were instructed to quickly rate the “naturalness” of the clip on a scale from 1 to 4, 1 being “very unnatural” and 4 being “very natural”. Georgescu et al. ran many trials with 28 participants to gather sufficient data.

So… what were the results?

Figure 2. AON activation in response to visualizing contingent movement patterns.

Georgescu et al. found that participants were sensitive to changes in both movement contingency and fluency, and that participants considered the interactions to be most “natural” when movement was both contingent and fluid. From the imaging results, researchers concluded that visualizing movement contingency engages a network known as the “action observation network”, or AON (Figure 2). The AON includes several brain regions including bilateral posterior superior temporal sulcus (pSTS), the inferior parietal lobe (IPL), the inferior frontal gyrus (IFG), the adjacent ventral as well as dorsal premotor cortices (PMv, PMd), and the supplementary motor area (Wow, those are pretty overwhelming names!). In contrast, visualizing rigid movements (manipulated movement fluency) activated a different network known as the “social neural network”, or SNN (Figure 3). The SNN comprises of the medial prefrontal cortex (mPFC), the posterior cingulate cortex (PCC), the temporoparietal junction (TPJ), and the adjacent pSTS (I promise there are no more scary words). Thus, these results suggest that the AON may be a key neural network in the understanding of social interactions. Meanwhile, the SNN might play a role in interpreting incongruences during social interactions. Relating back to my daily experiences here in Paris, it would seem that my AON is activated as I coordinate my movements with a French speaker in a nonverbal exchange. If he or she makes a movement I fail to interpret, my SNN most likely activates as I try to sort out the ambiguity. Voila! Science.

Figure 3. SNN activation in response to visualizing rigid movement fluency.

Although I had difficulty interpreting the study’s imaging data due to poorly labeled figures, I found this article to be extremely interesting. It considered the processes of nonverbal communication in a novel fashion while providing solid evidence for the differential roles of the AON and SNN in nonverbal social exchanges. It would be exciting to perform similar experiments using videos displaying specific social contexts. That way, we might learn if social context leads to differential brain activity.


Always a pleasure,

Christian


References

Georgescu AL, Kuzmanovic B, Santos NS, Tepest R, Bente G, Tittgemeyer M, Vogeley K (2014) Perceiving nonverbal behavior: neural correlates of processing movement fluency and contingency in dyadic interactions. Hum Brain Mapp.35(4):1362-78

Figures 1-3 are from Georgescu et al., 2014.

“Welcome” image was obtained using a Creative Commons search:

Pixabay

Turn Up the Bass!

If you really knew me, you would know that a huge slice of my life is devoted to music. To me, music is another language, another culture, and another lifestyle. There’s so many things you can do with music: play, listen, learn, write, and produce. You can even relate to, dance and communicate with, or supplement action-packed movie scenes with music. The possibilities with music are endless. That’s why I decided on pursuing a minor in music – while I wanted to mainly focus on neuroscience and pre-med, there was no way I was just going to stop my progression of music.

A little more than one week remains in our Parisian stay, and our main objective this week was to keep cool in the immense heat. However, the heat didn’t keep me from going out on June 21, 2017.

DJ playing reggae in a tree!

On this day, France celebrated “Fête de la Musique,” or “Music Day.” I couldn’t believe it – it was a whole day devoted to making music. A group of us went out to explore and we found our first venue at Parc Montsouris where a DJ was set up in a TREE playing reggae music. Afterwards, we ventured towards Denfert Rochereau, the Luxembourg Gardens, and the Latin Quarter to see tons of bands playing music wherever we turned. Now whenever I listen to music, I pay a lot of attention to each instrument/voice and their role in creating the structure and musicality of the song. So when listening to these French bands, the one instrument/voice I particularly listened for was the bass.

Taiko Drumming at Le Jardin du Luxembourg

Whether it’s the electric bass guitar of a rock band, a tuba in a wind ensemble, an upright bass in a jazz band, or the electronic 808 bass lines that can blow out your speakers heard in many chart-topping songs today, having a bass is critical when creating music. The bass lays a tonic and rhythmic foundation for the other instruments/voices to play off of. Without the bass, the music would fall apart.

Parc Montsouris

Luxembourg Gardens

To prove to you just how important the bass is, I found a study by Hove et al. (2014) that looked into how our brain detects lower musical pitches as a foundation for musical rhythm. The researchers repeatedly played low-pitched (G3) and high-pitched (B-flat4) piano tones every 500 ms, but the catch is that 10% of the time, the tone would be played 50 ms too early. Subjects were hooked up to an electroencephalogram (EEG), which detects electrical signals in your brain using metal electrodes attached to your head, and were tasked to tap their finger to the rhythm of the piano tones. With the EEG, the researchers looked for mismatch negativity (MMN) amplitudes, which are electrical responses set off by the auditory cortex (a brain region that processes auditory information) whenever it detects something unexpected when listening to a stream of sounds (Picton et al., 2000).

Electroencephalogram (EEG)

Results showed that these MMN amplitudes were greater when the subjects heard the early low-pitched tone than when they heard the early high-pitched tone. When finger tapping, subjects shifted the timing of their taps significantly more after hearing the early low-pitched tone than when the early high-pitched tone was heard. These results support the idea that: 1. our brain, at the auditory cortex, is better at processing the timing of lower-pitched tones than higher-pitched tones, and that 2. we are better at synchronizing body movements to the rhythms we hear when listening to lower-pitched tones than higher-pitched tones (Hove et al., 2014).

The Auditory Cortex

In this study, I believe it may have been noteworthy (no pun intended) to also include piano tones that are played 50 ms too late as well. This could show whether our brain can tell a difference in detecting an early or late beat in these low-pitched tones. Regardless, I really appreciated the musical application of their study. For example, they related these findings to the importance of bass notes in complex rhythms, such as ragtime piano syncopation (off-beats) or waltzes played in segments of 3 beats. This study shows us the relevance of bass in music and its importance in rhythmically keeping all the other aspects of a song together as one unit of sound. So whether it’s the music heard around every corner in Paris during “Fête de la Musique” or the heavy EDM music I just casually listen to back at home, you’ll probably see me grooving, especially to the bass of the music.


References:

Hove MJ, Marie C, Bruce IC, Trainer LJ (2014) Superior time perception for lower musical pitch explains why bass-ranged instruments lay down musical rhythms. PNAS 111(28): 10383-10388.

Picton TW, Alain C, Otten L, Ritter W, Achim A (2000) Mismatch negativity: Different water in the same river. Audiol Neurootol 5(3-4): 111-139.

Pictures of the DJ and drumming were personally taken.

The EEG and auditory cortex pictures are credited to Creative Commons.


It’s Not Just a Phase, Mom- How Sad Music is More Enjoyable than Happy Music

In light of the recent music festival and the fact that music can be heard regularly throughout the Métro and streets of Paris, I decided to look into the effects of music on the brain. In my experience I’ve always found that, in a public setting such as the Métro, I prefer to hear people playing calming instrumental music, like an acoustic guitar, rather than an entire band playing an upbeat song. While this may just be based on personal opinion, I wanted to know if there was a neurobiological process that governed this reaction. Obviously, examining every sentiment or bias towards music is beyond the scope of one or two studies, so I refined my question: what brain processes drive us to form opinions of music that is perceptually happy or sad?

Figure 1: Map of all the Fête de la Musique major events in Paris- there’s music for all tastes!

My first inquiry led me to an article by Brattico et al. (2011) that aimed to show the difference in activity of certain brain regions from music that is happy or sad, and with or without lyrics. They hypothesized that songs with lyrics will activate the left fronto-temporal language network, while songs without lyrics would activate right-hemispheric brain structures. Also, they expected to observe activation of left-hemispheric auditory areas by happy music (which is richer in fast transitions) and of right-hemispheric areas by sad music (with slower “attacks” and tempos). They used fifteen subjects who were told to bring in 16 familiar music pieces: four sad and four happy pieces from favorite music, and four sad and four happy pieces from disliked or even hated music. The music, within the four categories, was then computer-analyzed to average the attack slope (sharpness of musical events, for example, most percussion would result in a high attack slope) and spectral centroid (brightness and frequency balance of the music, similar to timbre), as well as tempo and mode (major or minor chord quality) (Figure 2).

Figure 2: Differences of attacks slope, spectral centroid, tempo, and mode in the four music categories.

The subjects listened to 18 second excerpts of the music they brought while their brain activity was monitored. After the excerpts, they were asked if they liked or disliked the music, as well as if they thought the music was happy or sad. Their findings of the difference in activated areas between categories are shown in Figure 3. Although the researchers described in detail what each activated brain region meant in correlation with its usual information processing, I’ll only mention a few interesting points that relate to my original question:

  • Sad music induced activity in the right caudate head and the left thalamus. Interestingly, the left thalamus is one of only a few brain structures that is involved in processing sadness in faces, suggesting a link between emotions evoked by visual or auditory stimuli.
  • Also, sad music led to activity in both the subcortical stratial region, which is involved in judging musical and physical beauty.
  • Happy music without lyrics more strongly activated structures associated with perception and recognition of basic emotions, like the left anterior cingulate cortex and the right insula, than happy music with lyrics.
  • However, sad music led to wider brain activity during music with lyrics than without, such as emotion-related areas like the right claustrum and left medial frontal gyrus.

Figure 3: Differences in activation of brain regions due to music emotion and presence of lyrics. For example, “Lyrics > Instrumental” signifies the regions that were activated in lyrical music, but not in intrumental. ITG stands for inferior temporal gyrus, ACC stands for anterior cingulate cortex, Cau for caudate, Cun for cuneus, CG for cingulate gyrus, Dec for cerebellar declive, ITG stands for inferior temporal gyrus, Put for putamen, STG for superior temporal gyrus, TTG for transverse temporal gyrus, and Thal for thalamus.

Based off these results, the researchers concluded that instrumental music is efficient in conveying positive emotions, while sad emotions are reinforced when lyrics are present. They suggest that vocal cues in sad music activate deep emotion-related structures which produce mental associations with negative emotional experiences, as shown in activation of limbic and paralimbic regions. This activation causes people to have “moving” experiences.

Below are two pieces of music I think Brattico et al. would suggest have high emotional impact- a familiar sad song with vocals and a familiar instrumental happy song. How do they make you feel? (Songs are Hallelujah by Jeff Buckley and Canon in D by Pachelbel, I own no rights to these)

Overall, I thought the study provides a thorough analysis of the brain regions that are differentially activated during happy or sad music, and even considers the effect of lyrics. The only aspect of the experimental procedure that confused me was their decision to have the subjects bring in their own music. Although the researchers say that the subjects had similar familiarity with the music, there was probably some differing in familiarity throughout the categories. I, for one, would probably have a more difficult time finding four sad songs that I hate but know well, than I would in finding four happy songs that I like.

Something that I still didn’t understand fully was their mention of the underlying feelings of being “moved” from music. So, I looked at another article, this time by Vuoskoski and Eerola (2017), that examined the effect of perceptions of music, such as beauty, on this sentiment. They hypothesized that sadness in music has a positive association with beauty, and mediates the feeling of being moved, which in turn causes a sense of enjoyment or pleasure.

The experimental procedure consisted of having 19 music students listen to 27 short film excerpts. The participants then rated the perceived emotion of the music based on six scales: sad/melancholic, moving/touching, tender/warm, peaceful/relaxing, scary/distressing, and happy/joyful, as well as if they liked it or not. The correlation between the qualities is shown in Figure 4. As the table shows, beauty was shown to have a positive correlation with sadness and a high correlation with liking. Also, the perception of being moved was the most highly correlated with beauty and sadness. Overall, Vuoskoski and Eerola found that the indirect effect via movingness on liking was twice the magnitude of that via beauty, which suggests that perceived movingness acts as the largest link between sadness and liking. In other words, the sadder a song is, the more you will be “moved”, and the more you will enjoy it. It is important to point out that this is not saying that happy songs are unlikeable- there was still a positive correlation between happiness and liking, but it was slightly lower than that of sadness.

Figure 4: Correlation values between different emotional qualities of music and liking.

This study gives convincing, albeit initially difficult to understand, connections between sadness and enjoyment of music through the sentiment of “being moved”. The only downside of the study is that the participants were asked about how they thought the music sounded, not how it made them feel. Although it might only be a slight difference in wording, it could play a larger role in terms in relating the feelings to regional activation in the brain, like in the study by Brattico et al. However, by accepting that perception and feeling are inherently linked, we can conclude that the largest enjoyment can be obtained from sad music with vocals, as it strongly activates the regions of the brain that cause the listeners to be emotionally moved. I think an interesting future direction would be to see the effect of human interaction on enjoyment from sad music- I would assume that there would be less enjoyment out of listening to sad music in a group setting, as cultural norms would start to play a larger role.

Even though the findings indicate that sadness gives a higher level of enjoyment, I find it hard to believe that this would not differ between people. What do you think? Do you find that you have a more emotional or pleasurable experience when listening to sad music than happy music?

References:

Brattico E, Alluri V, Bogert B, Jacobsen T, Vartiainen N, Nieminen S, Mari Tervaniemi M (2011) A Functional MRI Study of Happy and Sad Emotions in Music with and without Lyrics. Frontiers in Psychology. 2:308.

Vuoskoski JK, Eerola T (2017) The Pleasure Evoked by Sad Music Is Mediated by Feelings of Being Moved. Frontiers in Psychology. 8:439.

Figure 1 was found through Creative Commons

Figure 2 and 3 were taken from the article by Brattico et al.

Figure 4 was taken from the article by Vuoskoski  and Eerola

Videos were taken from YouTube

If the Heat waved, would you wave back?

  1. Salut!

If you’ve read my first post, you already know I am not your common happy blogger… But don’t get me wrong, I LOVE PARIS and I’m having the time of my life!!!

So lets get started…

I landed in Paris a day before the start of the program, and stayed with my dad’s friend for a day. When I entered their house, I was shocked to see no central air conditioning unit, but I assumed they obviously have ACs in the bedrooms because isn’t it a necessity? Little did I know, ACs are not common in Paris, in fact, they are not “needed” because the weather is so pleasant. Coming from America, I guess you can say I am spoiled because I am used to being surrounded by air conditioning all day, everyday. From my home, to my car, to my school – it’s everywhere. Hence, I wasn’t consciously thinking of it as luxury but rather as a necessity.

Honestly, this is so relatable…

At Cite Universitaire, my room has a huge window that I normally keep open so that the temperature stays moderate, but even then I could not adjust to this non-AC lifestyle. After a few sleepless and irritated nights, I went and bought a fan; this was no doubt one of my best investments. That night, I slept like a baby.

The peaceful nights did not last very long though… This week, my third week in Paris, has been incredibly hot. The temperature went up the roof – about 35°C (95°F) average for the week. The authorities in France officially laid out precautions and plans to minimize the affects of this heatwave (thelocal.fr).

The temperature spiked around the 17th of June and returned to bearable temperatures on Friday!


As a person who already doesn’t like summer because of the unbearable heat, this was a very tragic week. I was sweaty, upset, annoyed, stressed, and tired all the time.

Those few moments of air conditioning or fan in some metros or restaurants were the moments I cherished. Coming back to my room everyday wasn’t something I looked forward to. Even my incredible fan wasn’t of much help with this heat.

With all these emotions and feelings I was going through, I wondered how this is affecting my brain (mainly because I needed a scapegoat to blame my unproductivity on – don’t judge).

As I dug deeper into the literature, I stumbled upon this article by Jiang et al. (2013) that investigated the effects of hyperthermia on human cognitive performance, using functional magnetic resonance imaging (fMRI), which is a technology used to detect changes in the brain activity during a specific task. Hyperthermia (HT) is defined as a condition in which the body temperature rises above normal. They wanted to see if cognitive performance would deteriorate in the HT condition compared to the control and how brain activity will be different in both groups.

The participants were divided into two groups; the HT group and the control group. To stimulate effects of hyperthermia, the HT group was in a hot chamber (50°C) with a thermal heated suit on for 30 minutes prior to the fMRI scanning. In the control group, the participants followed the same procedure but the chamber temperature was kept normal (21.5°C). The researchers precisely looked at brain activity during a visual short-term memory (VSTM) task to examine the participants’ cognitive performance. Previous research has shown three brain regions, dorsolateral prefrontal cortex (DLPFC), inferior intra-parietal sulcus (IPS), and intra-occipital sulcus (IOS), are involved in maintaining visual information for a short period of time (Todd et al. 2004, Grimault et al. 2009), hence, the researchers in the current study looked specifically at changes in activity in these three brain regions during the VSTM task.

In this task, the participants were presented with 60 trials of probe and target images, alternatively. Their task was to press “yes”, if the probe and target images were identical, or press “no” if the probe and target images were not identical. The participants in both the groups, control and HT, were in the fMRI scanner while they performed this task. Analyzing the behavioral results, they found that even though the HT group did not differ in accuracy compared to the control, they took much longer to answer the questions. On the neural side, fMRI results indicated increased brain activity in areas that are involved in visual memory task, as mentioned earlier (DLPFC and IPS). They saw that the brain was much more active during the heat exposure condition even though the participants were slow in the task, which shows that their visual short-term memory function was weakened. The researchers suggest that the increased brain activity could be due to more attention and cognition being used to do the same task compared to the control condition.

This study shows that exposure to very high temperatures, even for 30 minutes, can actually affect your cognitive performance. Your brain will need to use more energy and require longer time to perform a basic task. This study does an amazing job connecting the behavioral aspect with the neural aspect under heat stress in humans. It also uses well-defined brain regions, which makes it clearer to identify the changes in brain activity. However, they fail to discuss why they did not see changes in activity in IOS, one of the regions they evaluated during the tasks, even though previous research had shown that the IOS is involved in the visual memory task. More research needs to be done to identify how other cognitive activities may be affected due to heat, because global warming is a real problem and we see more and more incidents of heat waves occurring all over the world. If we better understand the impacts of heat on human brain and function, we can probably identify ways to prevent or rescue the damage caused by heat exposure.

Stay cool 🙂

Mehtab Manji


References:

Grimault S, Robitaille N, Grova C, Lina JM, Dubarry AS, Jolicoeur P (2009) Oscillatory activity in parietal and dorsolateral prefrontal cortex during retention in visual short-term memory: Additive effects of spatial attention and memory load. Hum Brain Mapp 30: 3378–92.

Jiang Q, Yang X, Liu K, Li B, Li L, LI M, Qian S, Zhao L, Zhou Z, Sun G (2013) Hyperthermia impaired human visual short-term memory: An fMRI study. Int J hyperthermia 29(3): 219-24

Local, The. “Paris: Authorities Trigger Emergency Heatwave Plan as Capital Continues to Sizzle.” The Local. The Local, 20 June 2017.

Todd JJ, Marois R (2004) Capacity limit of visual short-term memory in human posterior parietal cortex. Nature 428:751–4.

Images:

1, 4) http://www.welikela.com/heat-wave-memes-about-los-angeles/

2) http://www.funnycaptions.com/tag/summer-heat-jokes/4/

3) https://www.timeanddate.com/weather/france/paris/historic


Répétez-vous?

I knew from the minute I set foot into the French customs line at the Charles de Gaulle airport that perhaps I didn’t know French as well as I thought I did. Every conversation around me—except for the Americans’ I followed off the plane—sounded oddly like gibberish. In keeping with my nosy personality, I sidled a little closer to the French couple behind me to see if I could eavesdrop on a word or two—nada. One would think that five years of taking French classes would have gotten me a little farther than that.

Image Courtesy of Google Maps

I still remember my reaction in the first few minutes of French 201 at Emory. My professor greeted all the students in French when we walked in the door. Oh, that’s cute, I thought. But when 11:30 hit, class officially started, and she continued to speak in French, my mouth actually dropped open. How was I supposed to understand her? I could barely understand a word of spoken French. The nerve of my French professor to actually speak in French! Initially, the biggest thing on my mind was finding out a way to get the biggest bang for my buck in returning my newly purchased French textbooks.

Fortunately, a mix of procrastination in dropping the course and unyielding determination—a quitter I was not—led me to eventually decide to tough it out in French for the year. Good thing I did, because a few months later I would find myself in the largest French-speaking city in the world.

Setting foot in Paris a few weeks ago brought me right back to the feelings I felt the first day of French 201. As the weeks went by, I practiced, spoke to a few French natives, and most importantly, I listened. I started getting lost in the raw melodies of the French language—often I would find myself listening to the intonations of the speech rather than actually paying attention to what was said. I started comparing French to other languages, like English. Would a foreigner to the English language appreciate the melodies that are simply words to us? How does the brain process it? I know that there are some languages that have totally different basic sound units—can a person who is not native to the language even process those units? The budding neuroscientist in me had so many questions.

I looked up this super cool graphic from medical daily that basically told me that yes—language changes the way we think* For example, because there are more words for colors from dark to light blue in the Japanese language than in English, the Japanese perceive more colors than we do. Conversely, languages with fewer terms have the opposite effect—those native speakers perceive even less colors (Medical Daily). The ball doesn’t just stop at color perception—there are nearly infinite differences between languages that could change the way we think. Do these differences mean that the brain of one native language speaker is set up a little differently from the next? I wondered: Do differences in language between native speakers have any effect on the brain?

An article by Ge et al. (2015) asks how native speakers of different languages process that language—specifically Mandarin Chinese and English. Why did experimenters compare English with Chinese and not, say, the second best language on Earth—French? A part from English and Chinese being the two most widely used languages in the world, the Chinese language is a tonal language, meaning that the intonation used determines the meanings of the words. English, on the other hand, is atonal (hence the reason why high school geography teachers could get away with fully monotone class sessions). Researchers placed 30 native Chinese speakers and 26 native English speakers in fMRIs and used dynamic causal modeling (DCM)—which is essentially a way to construct a model on how brain regions interact. Our lovely subjects were presented with either intelligible or unintelligible speech in their native languages while being scanned, then data was compared between the two groups.

Classic language areas

Now, before we delve into the scintillating results of this study, let’s talk a little about how brain areas relating to language actually work. Most of language is processed in the left hemisphere of the brain. In this classic language area are structures like Broca’s area and Wernicke’s area, which are big names to the brain language nerds. Perhaps more relevant to this article is the pathway associated with the sound-meaning map, which assumes language-processing starts from the temporal lobe, goes to its anterior reaches, and ends up in the frontal lobe. In this paper, researchers think that this sound-meaning area will be more highly activated in native Chinese speakers, since their language relies so heavily on sounds and intonations for understanding speech.

Now for the exciting part: were the researchers right? They found that while the regions themselves that process speech are mostly the same across languages, the pathways through which these regions interact may be different. The brain areas commonly associated with language are the left posterior part of the superior temporal gyrus (pSTG), the anterior part of the superior temporal gyrus (aSTG), and the inferior frontal gyrus (IFG), which—for the purposes of this study—were named regions P, A, and F, respectively.

Essentially, data showed that when hearing intelligible speech, both the Chinese (tonal) and English (atonal) brain showed increased speech in the P to A areas—that’s shown by the green arrow on the first brain in the diagram below. Chinese speakers showed more activation than English speakers when listening to intelligible speech in both of the pathways coming out of the A area (red arrows in the middle brain). This may be due to further semantic processing that is needed for word identification in Chinese. This also happens to be one of the pathways for the sound-meaning map that we talked about before. So yes, the researchers were right in their hypothesis (big surprise)— the Chinese brain had more activation in this particular pathway than the English brain did. Finally, good ole’ English speakers showed more activation than Chinese when listening to intelligible speech in the P to F pathway (the red arrow on the final brain). This pathway is usually implicated in phonological speech processing (Obleser et al., 2007), where the first phonological features are usually enough to be able to identify words in atonal languages. Long story short, this data tells us that while there are common pathways used in understanding speech in both languages, some of the pathways between the brain regions are also different. To the big language nerds—and now to us—that’s pretty exciting stuff.

Figure 2A from Ge et al (2015)


What’s great about this paper is that it uses two languages that have really clear differences—tonal Chinese vs. atonal English. Scientific experiments are usually best with wide and clear-cut variables like those seen between English and Chinese, so the languages they tested for in this study were great. However, because of the way that this experiment was designed, we don’t know whether their main question—how is language processed in the brain by native speakers of a different language—really has anything to do with whether the subject was a native speaker or not. We don’t know if the pathway activation that we saw was due to a different general functioning of the brain in a given subject, or if it was due to the subject simply understanding a language that required certain pathways to be activated. In other words, is the difference in activated pathways due to the inherent way a native speaker’s brain works, or is it due to the pathways required to understand the language—regardless of the brain that’s doing the processing? In defense of the article, their question may not have been this complex. Maybe in the future, researchers could do a further experiment with native English speakers who also understood Chinese (or vice versa), and compare activated pathways when they heard intelligible Chinese to the pathways activated in a native Chinese speaker.

Either way, it’s definitely interesting to know that different languages require different brain pathways for processing. Maybe one day—preferably after an especially delicious Nutella crepe—the language pathways in my brain used for understanding French will become activated, and I can finally eavesdrop on all the airport conversations I want.

-Ngozi


*http://www.medicaldaily.com/pulse/how-learning-new-language-changes-your-brain-and-your-perception-362872

Image #2 from: thebrain.mcgill.ca

References

Crinion JT, et al. (2009) Neuroanatomical markers of speaking Chinese. Hum Brain Mapp 30(12):4108–4115.

Ge J, Peng G, Lyu B, Wang Y, Zhuo Y, Niu Z, Tan LH, Leff A, Gao J (2015) Cross-language differences in the brain network subserving intelligible speech. PNAS 112(10):2972-2977.

Obleser J, Wise RJ, Dresner MA, Scott SK (2007) Functional integration across brain regions improves speech perception under adverse listening conditions. J Neurosci 27(9):2283–2289.


SaveSaveSaveSave