Category Archives: Neuroscience

Can You Feel the Music Tonight?

The Rite of Spring, a ballet and orchestral assemble created by Igor Stravinsky, elicited such a strong reaction from the people who witness it; riots and fights broke out all over the concert hall from experiencing a piece of art that we now revere in modern culture. I had the completely opposite experience at Fete de la Musique in which various musical performances of numerous genres were given a microphone and a setting for everyone to enjoy. From electronic to Caribbean music, there was no telling what would arise around the corner; I loved just walking and exploring the area with surprises at any time.

First performance of the Rite of Spring in 20th century

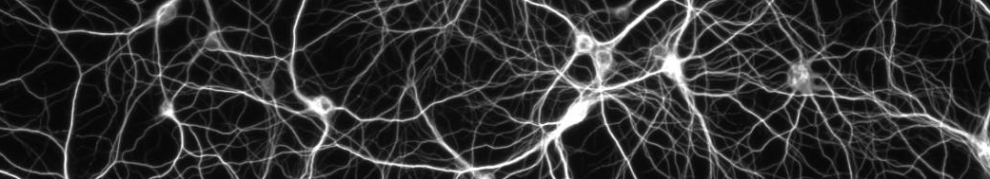
When thinking about music broadly cannot blame the concertgoers for having such a strong reaction to the music. Music, in the ways it has manifested in my life, has been the break point for some my biggest breakthroughs in learning more about myself. In addition to kickstarting some revelations about myself, music has also helped me calm down, stay focused, and relive emotions that I once forgotten about until I listen to a song again.

Music is an amazing trigger for latent memories that we often forget about. As soon as we hear just the beat of a song, we can pinpoint a feeling or a moment that a song defined for us. One study found that music caused participants to indicate a higher rating of joy and strength where memory induction leaded to a higher correlation between the emotion and the music they listened to (Maksimainen et al., 2018). This makes sense though; the amount of music we encounter on a daily basis is massive, whether self-induced or not, and plays a large role in our life. And as a big part of our lives, they will connect to our various scenarios and emotions as we experience them.

Here are a few of my own examples. “Energy” by Drake will forever remind me of when I first felt like my first-year group of college friends started feeling like family. The entire ABBA “Gold” album reminds me of my mom without fail and how she just comes alive with the right type of music. And now, “Love on the Brain” by Rihanna will forever remind me of Paris and a sense of camaraderie I felt with my study aboard group while we walked along the Seine during the Fete de la Musique.

A drumming band that was absolutely amazing during Fete de la Musique

It made me wonder how we associate such pleasant experiences in our lives with something as arbitrary as music; a song that reminds me of a great experience could trigger a huge negative response in another person. What brain system are present that leads to difference from person to person and modulate a negative, neutral, or positive association?

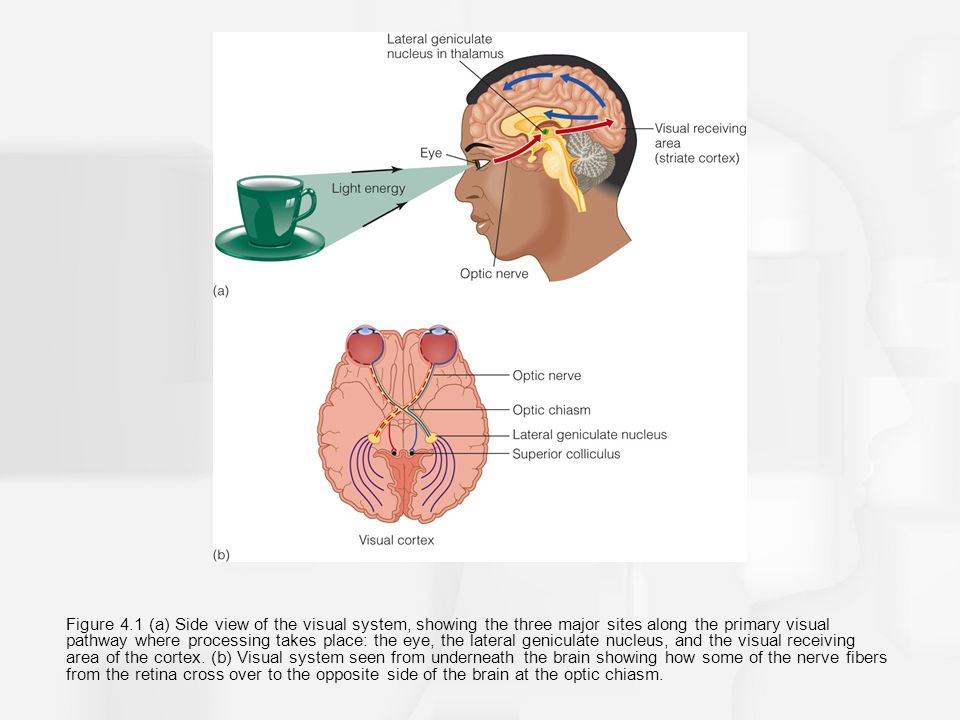
A 2019 study found that dopamine plays a role in the positive responses we feel when we listen to music (Ferreri et al., 2019). The researchers took 27 participants in which they listened to 5 self-selected and 10 experimenter-selected musical excerpts before taking a dopamine agonist, dopamine antagonist, or a placebo pill with each pill administration separated by a week. After each administration, the researchers measured the pleasure response by looking at amplitude changes in electrodermal activity (EDA) and qualitative pleasurable experience ratings taken after every song. Electrodermal activity (EDA) is created by the sweat glands and the associated epidermis (“Electrodermal Activity,” n.d.) often used in behavioral medicine as a measure of emotional responsiveness (Critchley & Nagai, 2013). Participants who regularly experience chills when listening to music had a higher number of reported chills after dopamine agonist administration compared to dopamine antagonist administration as well as a higher EDA change under the dopamine agonist that was significantly different compared to the dopamine antagonist administration when experiencing pleasurable music. The amplitude of EDA did not change while the participants were listening to any random type of music. There was only a change in dopamine modulation when the participants were listening to self-reported pleasurable music supporting the researchers’ hypothesis that dopamine has a specific effect how we respond to pleasurable music (Ferreri et al., 2019).

Figure showing a higher liking ratings and pleasure EDA after dopamine agonist (levodopa) administration compared to dopamine antagonist administration (risperidone).

There were many pluses with the Ferreri et al. study, but there were some aspects that would have helped me align with their conclusions more. I would want the research to explain the validity of electrodermal activity as opposed to using other physiological changes such as heart rate or blood pressure as well as brain imaging to make sure there is activation in the mesolimbic system and not anything else. However, the authors set up their experience design thoroughly by covering various types of dopamine effects on the brain to make sure they have comparable results to see if dopamine levels can modulate could have a role in the pleasurable experiences we have with music; they were thorough in setting up the experiment for the research question. Their thoughts on defining what exactly “pleasurable” means is also fascinating because pleasure is so subjective so the fact is a big plus in how thorough the researcher were in determining how we perceive what we personally hear as pleasurable music.

Nevertheless, the study strongly suggests that pleasurable emotions we associate with music could have a relationship with the rewarding effects of dopamine. This is why relistening to reminds us of good feelings and scenarios we previously had.  The possible of the opposite happening with the Rite of Spring is plausible, but the take home message from the riot starting symphony to the soothing ballad along the Seine is clear. Music has the ability to bubble emotions to the surface in such a way that all you can do is lean into it and let it take over.

References

Critchley, H., & Nagai, Y. (2013). Electrodermal Activity (EDA). Encyclopedia of Behavioral Medicine, 666–669. https://doi.org/10.1007/978-1-4419-1005-9_13

Did The Rite of Spring really spark a riot? – BBC News. (n.d.). Retrieved June 27, 2019, from https://www.bbc.com/news/magazine-22691267

Electrodermal Activity – an overview | ScienceDirect Topics. (n.d.). Retrieved June 27, 2019, from https://www.sciencedirect.com/topics/medicine-and-dentistry/electrodermal-activity

Ferreri, L., Mas-Herrero, E., Zatorre, R. J., Ripollés, P., Gomez-Andres, A., Alicart, H., … Rodriguez-Fornells, A. (2019). Dopamine modulates the reward experiences elicited by music. Proceedings of the National Academy of Sciences, 116(9), 3793–3798. https://doi.org/10.1073/pnas.1811878116

London Symphony Orchestra. (n.d.). Stravinsky The Rite of Spring // London Symphony Orchestra/Sir Simon Rattle. Retrieved from https://www.youtube.com/watch?v=EkwqPJZe8ms

Maksimainen, J., Wikgren, J., Eerola, T., & Saarikallio, S. (2018). The Effect of Memory in Inducing Pleasant Emotions with Musical and Pictorial Stimuli. Scientific Reports, 8(1), 17638. https://doi.org/10.1038/s41598-018-35899-y

Image #1: [Screenshot of first performance of the Rite of Spring]. Retrieved from https://www.bbc.com/news/magazine-22691267

Image #2: Image taken by me

Image #3: [Screenshot of Figure #1 from study] Ferreri, L., Mas-Herrero, E., Zatorre, R. J., Ripollés, P., Gomez-Andres, A., Alicart, H., … Rodriguez-Fornells, A. (2019). Dopamine modulates the reward experiences elicited by music. Proceedings of the National Academy of Sciences, 116(9), 3793–3798. https://doi.org/10.1073/pnas.1811878116

A Glimpse Through Monet’s Eyes

Standing in Monet’s Garden in Giverny, I donned a pair of scratched, plastic-covered, yellowed glasses and watched the once-breathtaking view in front of me melt into a muddied and obscured version of its former beauty. As a class, we had taken a day-trip to explore the place that Monet painted his famous water lilies. Monet is thought to have had worsening cataracts as he aged, which

Monet’s garden (Personal image)

impacted his vision and therefore his artwork. To simulate his experience, in class we had made “cataract glasses” by altering a pair of safety glasses, and we wore them for part of our time in the garden. I sketched the scene, noting how the vibrant, defined foliage lost its form and beauty. Certainly, this distortion altered my perception and gave me a unique perspective. However, at the time, I did not consider my final product a very appealing result.

My Monet-inspired glasses, meant to imitate vision with cataracts (Personal image)

But, this representation of the scene wasn’t inherently bad, and being impaired didn’t necessarily make my depiction worse for its lack of accuracy! It may even be that “impairments” enhance creative ability: even with the failing functionality of his own vision, Monet was able to transform any scene into a masterpiece.

My sketch of the same scene without (left) and with (right) the glasses (Personal Image)

In other realms as well, what may be deemed an impairment may turn out to be neutral or even beneficial to an individual’s creativity or artistry! Perhaps surprisingly, recent research suggests that this may be the case for some dementia patients.

One study by Midorikawa et al. (2016) involved analyzing new or increased positive abilities that appeared in patients with behavior-variant frontotemporal lobe dementia (bvFTD) or Alzheimer’s Disease (AD). These types of dementia are the ones in which enhanced abilities—such as new or improved drawing, singing, or painting skills—are most commonly reported after disease onset, leading to an apparent boost in creativity or artistry.

First, to briefly introduce the diseases of interest: FTD and AD are both types of

The different brain regions affected by FTD and AD. (Image from ElderlyCareAssistance.info)

dementias, diseases in which brain cells begin to die. FTD is a rather rare type of dementia that begins early in life. Cells die in parts of the brain that deal with social skills, decision-making, and emotion—especially the front and the side (What is Frontotemporal Dementia?). The specific type called behavior-variant FTD (bvFTD) is characterized by changes in personality such as disinhibition, inappropriate behavior, and loss of empathy. (Kurz et al., 2014). AD, which is one of the most common types of dementia, usually begins later in life. A lot of the initial cell death happens in the hippocampus, a structure associated with memory, so memory problems are often some of first symptoms (Miller and Hou, 2004).

Some of the items from the questionnaire (Image from Midorikawa et al., 2016)

In this study, caregivers of people with FTD and AD filled out a questionnaire, ranking the patients on a variety of positive behaviors in three different categories: sensory processing, cognitive skills, and social/emotional processing. On a four-point scale, caregivers indicated the frequency of the listed behaviors in each category for their patient “before the illness” and “at the present time.” Prior to the study, each patient was also diagnosed by a neurologist and assigned a clinical dementia rating, or CDR. (Higher CDR numbers indicate a more advanced or severe stage of disease.) This would allow the researchers to see if there were differences in ability between various stages and types of dementia.

Study results: y-axis indicates the average score. X-axis indicates clinical dementia rating (CDR) for Alzheimer’s Disease or frontotemporal dementia. (Image from Midorikawa et al., 2016)

Subtracting the “before” score from the “present” score, the researchers obtained a representative value, where a positive number indicates more of the behavior since diagnosis. Averaging these values for each diagnostic rating, Midorikawa et al. (2016) performed a statistical test to assess the magnitude of change in that behavior. What they found was that some of these positive behaviors significantly increased after disease onset! In particular, they found that (as can be seen in the graphs below) both AD and bvFTD patients actually exhibited more language-related activities–meaning creativity in self-expression through language–in the earliest stages of the disease. Additionally, a small portion of patients of both dementias experienced an increase in visuospatial activities, which includes things like being able to depict scenes through painting or drawing!

Although patients at later stages of the disease experienced decreases in these behaviors, it is a very intriguing finding that patients’ creative expression actually increased after disease onset. Moreover, there have also been many case reports documenting increased artistic output following neurological damage due to other causes, such as traumatic brain injury, Parkinson’s Disease, and semantic dementia (Midorikawa and Kawamura, 2015; Canesi et al., 2016; Hamauchi et al., 2019). Just like with Monet, it appears that what appears to be a deficit may in reality not be quite so detrimental to the creative process!

One strength of this study was how all patients underwent a comprehensive neurological evaluation by the same experienced neurologist. This was effective to confirm the diagnoses of the patients using consistent parameters and to assess disease severity. However, being survey-based, these measures were quite subjective and may not be entirely accurate. What it contributes to the field, though, is that it is one of the first studies to systematically analyze these changes in artistic ability: others have primarily been case studies of individuals. The study also offers a unique perspective: most work on dementia serves to analyze the deficits that occur due to cell death. This study, however, highlights

Painting by one AD patient without previous artistic training or ability before disease onset (Image from Schott, 2012).

some positive aspects of the disease, contributing to a rather new initiative that is working to change the dynamic around mental impairments. Rather than viewing perceptual differences as incorrect or indicative of pathology, maybe we should allow ourselves to appreciate the creativity.

In sum, even though I felt a bit ridiculous in the moment, wearing my cataract glasses in Monet’s garden taught me a powerful lesson: A change in perspective is not necessarily bad, even when the conventionally beautiful scene undergoes some alterations in the process. Perhaps if more people would be willing to look a bit silly and try on some Monet cataract glasses, we could all come to appreciate those with neurological damage and perceptual differences a little bit more, valuing them for the unique perspectives they bring to the world.


References:

Canesi, M., Rusconi, M.L., Moroni, F., Ranghetti, A., Cereda, E., Pezzoli, G. (2016). Creative Thinking, Professional Artists, and Parkinson’s Disease. J Parkinsons Dis. 6:239-246. doi: 10.3233/JPD-150681.

Frontotemporal Dementia- Signs and Symptoms. (n.d.). Retrieved from https://www.ucsfhealth.org/conditions/frontotemporal_dementia/signs_and_symptoms.html

Hamauchi, A., Hidaki, Y., Kitamura, I., Yatabe, Y., Hashimoto, M., Yonehara, T., Fukuhara, R., Ikeda, M. (2019). Emergence of artistic talent in progressive nonfluent aphasia: a case report. Psychogeriatrics. 10.1111/psyg.12437.

Kurz, A., Kurz, C., Ellis, K., Lautenschlager, N.T. (2014). What is frontotemporal dementia? Maturitas. 79:216-219. doi: 10.1016/j.maturitas.2014.07.001.

Midorikawa, A., Cristian, L.E., Foxe, D., Landin-Romero, R., Hodges, J. R., Piguet, O. (2016). All is not lost: positive behaviors in Alzheimer’s Disease and Behavioral-Variant Frontotemporal Dementia with disease severity. Journal of Alzheimer’s Disease. 54:549-558. doi: 10.3233/JAD-160440.

Midorikawa, A., Kawamura, M. (2015). The emergence of artistic ability following traumatic brain injury. Neurocase. 21:90-94. doi: 10.1080/13554794.2013.873058.

Miller BL, Hou CE. (2004). Portraits of Artists: Emergence of Visual Creativity in Dementia. Arch Neurol. 61:842–844. doi:10.1001/archneur.61.6.842.

Schott, G. D. (2012). Pictures as a neurological tool: lessons from enhanced and emergent artistry in brain disease. Brain. 135:1947-1963. doi: 10.1093/brain/awr314.


Images:

http://www.elderlycareassistance.info/care-for-elderly-own-home/

https://academic.oup.com/brain/article/135/6/1947/327597

https://content.iospress.com/articles/journal-of-alzheimers-disease/jad160440

Hyperlinked videos and sites:

https://www.youtube.com/watch?v=fmaEql66gB0

https://www.google.com/maps/place/Fondation+Monet+in+Giverny/@48.9878008,1.6779037,9.68z/data=!4m5!3m4!1s0x0:0x77c5b6296865dff6!8m2!3d49.0753898!4d1.5337022

https://www.youtube.com/watch?v=yJXTXN4xrI8

https://www.youtube.com/watch?v=QuJFLr5Ib9k

From Cheese to Brain Structures

Four weeks into the NBB Paris program, I now know my friends in our apartment very well. In our apartment (maybe this applies to the others too), neither neuroscience nor soccer is the most discussed topic. This conversation is by far the most frequent. “What are we getting for dinner?” “I don’t know!” All of us are from different parts of the United States and even different parts of the world, which makes our restaurant selection processes a bit tricky. Nick Maamari, an Emory NBB senior from Dubai, thinks that cheese is the most disgusting food in the world. On the other hand, Daniel Son, a Korean-American student from Portland, Oregon, enjoys eating cheese so much that he bought a slice of gouda cheese from Monoprix on the first day we arrived in Paris.

France is a country known for its cheeses. In 1962, President Charles de Gaulle said, “how can you govern a country which has two hundred and forty-six varieties of cheese?” (Mignon, 1962) Being a neuroscience student, I ask, “what happened in Nick’s brain when he ate these French cheeses?”

Nick: “Eww*1,000”

Daniel: “the more it stinks, the better it tastes!”

Disgust has been identified as a basic emotion since Charles Darwin (Rozin and Fallon, 1987). Like other emotions, disgust has a characteristic facial expression (like the one shown in Nick’s photo), an appropriate action (Nick would definitely leave a restaurant if all available food has cheese), a distinctive physiological manifestation (nausea), and a characteristic feeling state (revulsion) (Rozin and Fallon, 1987). Research has found two brain structures that are considered as neural sites for processing disgust: insular cortex and basal ganglia (Sprengelmeyer, 2007). First, let’s start with some neuroanatomy.

(Byrne & Dafny, Eds.)

The insula cortex (or insula) lies deep within the lateral sulcus (as shown above) and it sits on an island (hence the name insular) covered with frontal, parietal and temporal opercula (“the lid”). It is interconnected with many cortical regions and subcortical structures, placing it at an ideal position to integrate homeostatic information with information about the physical and external environment (Sprengelmeyer, 2007).

(Henkel, 1998)

Basal ganglia is a group of subcortical nuclei responsible primarily for motor control and other roles such as executive functions, reward and emotions (Lanciego et al.). Two major neurodegenerative disorders, Huntington’s disease, and Parkinson’s disease are caused by the hyperactivation or hypoactivation of this structure, respectively (Cepeda et al., 2014). Previous research has identified cases where patients with Huntington’s disease were unable to recognize disgust (Sprengelmeyer et al., 1998).

Numerous research has shown the role of insula and basal ganglia in mediating disgust (Sprengelmeyer, 2007). However, most previous studies have focused on the recognition of facial expressions of disgust. The reason for the lack of research on food aversion is mainly due to a great variation between how each individual perceive what food is disgusting and also due to ethical issues associated with invoking uncomfortable feelings in experiments (Royet et al., 2016). A group of French researchers narrowed down their experimental food to … guess what, cheese (Royet et al., 2016). Cheese is loved by people like Daniel and hated by people like Nick, therefore, making it a great model to study the cerebral processes of food disgust.

In the first part of the study, the authors conducted a survey of the French population (this may be a biased sample and results do not apply to the rest of the world), to evaluate individual preferences for 75 foods and estimate the proportion of individuals who are disgusted by cheese. The authors have found a higher percentage (11.5%) of people disgusted by cheese than by other types of food. Now they have a study sample of individuals expressing a deep disgust for cheese.

The second part of the study involved Functional Magnetic Resonance imaging (fMRI), which is a tool to show activations of brain regions. The participants were asked to begin their experiments in a hunger state (these poor people did not even get a full breakfast) in order to make sure that the results were not biased by different metabolic rates after a meal. The researchers first presented participants in an MRI scanner with both the image and the smell of six different types of cheese and six other control foods. The participants were asked to judge whether the smell and sight of food are pleasant or not and whether they have a strong desire to eat the food.

After analyzing their data, the researchers found that global pallidus and substantia nigra (shown above) of the basal ganglia are more activated in people who dislike cheese. The authors also found that another structure of the basal ganglia, the ventral pallidum was inactivated in individuals disgusted by cheese. These structures are involved in what’s called the “reward pathway” of the brain, which regulates our perception of pleasure and facilitates the reinforcement of a particular behavior (Berridge and Kringelbach, 2015). Taken together, the authors proposed that perhaps a modified version of the pathway for encoding reward was involved when we were presented with food that aroused strong feelings of dislike. Interestingly, the authors did not observe any differences in activation of insula in people who like or dislike cheese.

One thing to keep in mind as you read fMRI studies is that “correlation does not imply causation”. A structure active for a task does not mean it is critical for the task. Also, conclusions made in papers generally involve heavy statistics and morphing all brains of the participants, who of course, have different brain shapes and sizes (Logothetis, 2008). Therefore, research results should be interpreted cautiously.

This study fills in some gaps in the research of disgust, specifically for food. It helps us understand the role of different parts of the basal ganglia in processing disgust. The null finding of insula also supports that insula has more complicated functions than simply processing disgust. A foundation of knowledge on this topic can be applied to a wide variety of eating disorders that affects many people in our lives. I would like to end with my favorite celebrity chef, Gordon Ramsay, who must have his brain structures associated with disgust constantly activated when judging his students’ dishes!

(Schocket, 2017)

Berridge Kent C, Kringelbach Morten L (2015) Pleasure Systems in the Brain. Neuron 86:646-664.

Cepeda C, Murphy KPS, Parent M, Levine MS (2014) The role of dopamine in Huntington’s disease. Prog Brain Res 211:235-254.

Lanciego JL, Luquin N, Obeso JA Functional neuroanatomy of the basal ganglia. Cold Spring Harb Perspect Med 2:a009621-a009621.

Logothetis NK (2008) What we can do and what we cannot do with fMRI. Nature 453:869.

Royet J-P, Meunier D, Torquet N, Mouly A-M, Jiang T (2016) The Neural Bases of Disgust for Cheese: An fMRI Study. 10.

Rozin P, Fallon AE (1987) A perspective on disgust. Psychological Review 94:23-41.

Sprengelmeyer R (2007) The neurology of disgust. Brain 130:1715-1717.

Sprengelmeyer R, Rausch M, Eysel UT, Przuntek H (1998) Neural Structures Associated with Recognition of Facial Expressions of Basic Emotions. Proceedings: Biological Sciences 265:1927-1931.

Byrne, J. H., & Dafny, N. (Eds.). Neuroanatomy Online: An Electronic Laboratory for the Neurosciences. Retrieved from Department of Neurobiology and Anatomy, The University of Texas Medical School at Houston (UTHealth): https://nba.uth.tmc.edu/neuroanatomy/L1/Lab01p26_index.html

Henkel, J. (1998). Parkinson’s Disease: New Treatments Slow Onslaught of Symptoms. FDA Consumer, 17.

Mignon, E. (1962). Les Mots du Général.

Schocket, R. (2017, September 6). This Is The Disgusting Reason Gordon Ramsay Refused To Swim In A Hotel’s Pool. Retrieved from BuzzFeed: https://www.buzzfeed.com/ryanschocket2/gordon-ramsay-refused-to-swim-in-this-hotels-pool-because?utm_source=dynamic&utm_campaign=bfsharecopy&sub=0_11766940#11766940

Stars, Stripes, and the Sound of Music

When I played sports in high school, I was one of those people who would leave their headphones on until the last possible minute because I needed the music to focus. During warm-ups, if there was a song playing, I’d make sure to move to the beat or sing the lyrics to get in the right mentality. Music has always been something that I have connected to sports. This past Sunday, we had the wonderful opportunity to go see the US women’s soccer team play here in Paris for the FIFA World Cup. They won 3-0! Without a doubt, it was truly one of the highlights of the entire program! At the beginning, when the players first came onto the pitch, an upbeat song with a lot of bass reverberated in the stadium. The crowd went wild, and they were screaming their hearts out. Almost as if contagious, the soccer players also gained adrenaline listening to this song and they jumped to the beat as they were doing their last minute warm-ups. Whether it’s before or during the game, I decided to look into the impact of music on physical performance.

NBB students love cheering on the US!

Songs like “We are the Champions,” “All I do is win,” “Crazy Train,” and “We Will Rock You,” are commonly heard at sporting events. These songs raise the spirits of the crowd, but do they also help players perform better? Elvers and Steffens’ study set out to determine just that (2017). They had 150 participants complete a basketball task where they had to throw the ball into a funnel. They measured a lot of variables to be able to reach multiple conclusions. One of the hypotheses was that performance would be improved if the person listened to music beforehand. The results show that performance is only improved if the person was already good at the task and if the player had the option to choose the type of music. Since the soccer game was between professional athletes, we can assume that there’s a high chance that their performance could be improved with music. They also measured risk-taking behavior by letting the participants decide at what distance to shoot the ball from. Here, listening to any type of music made the participants more prone to choosing to shoot from further away. In professional soccer games, we never see the same plays over and over again, they are often taking risks in order to get the result they want. Could it be that the soccer players are listening to music and find that it gives them the motivation to take risks during the game?

When we look at the different brain regions that are activated while this process is occurring, we see that there is a connection between music and the premotor cortex. In a 2009 study, they had participants listen to music that they considered pleasurable and music that they considered non-pleasurable (Kornysheva et. al.). They scanned participants using fMRI and found that there was greater activation in both the ventral premotor cortex, an area of the brain involved with motor control, and cerebellar areas, often involved in balance and coordination, when they listened to music that they considered pleasurable versus listening to the non-pleasurable music. The brain actually adjusts to a certain tempo of music, and it can increase motor function, hence better performance. So, music not only impacts performance in the present, it also changes the brain responses for the future. If only we could have scanned the brains of the US team while they were playing to see if we would find that their premotor cortex had a greater activation after listening to that song heard all over the stadium.

The premotor cortex (PMC) and the cerebellum are both involved in music’s effect on sport performance.

Although there have been a considerable number of studies whose aim is to find the correlation between sports’ performance and music, there is still more research to be done. For example, how is it that these same songs played worldwide can elicit the same response from athletes who are all different. Is it their beat that makes them classics? Do they all cause people’s heart to start racing and adrenaline to rush through their veins? It would also be beneficial to look for possible detrimental effects of listening to music causing a decrease in performance.

In the meantime, let’s keep hoping that the music on full blast in the stadiums brings out the best from the US soccer team so that they can bring home a championship! I believe that we will win!

The U.S. planning their next move.

References

Elvers P., Steffens J. (2017). The sound of success: investigating cognitive and behavioral effects of motivational music in sports. Front. Psychol. 8:2026.

Kornysheva, K., von Cramon, D. Y., Jacobsen, T., and Schubotz, R. I. (2010). Tuning-in to the beat: aesthetic appreciation of musical rhythms correlates with a premotor activity boost. Hum. Brain Mapp. 31, 48–64.

Image 1: taken by Sarah Taha

Image 2: https://www.researchgate.net/figure/Illusory-Hand-ownership-modified-after-Blanke-2012-The-main-brain-regions-that-are_fig20_283465205

Image 3: taken by me

Rodents on My Mind, Rodents on the Metro

What does this look like to you?

The RATP logo (Image from Creads.fr)

To me it looks like a female face tilted back to take a big whiff of something—presumably, the fresh, pleasant-smelling air of Paris’s underground metro system (of course I’m being entirely facetious; it is often quite the opposite).

Why is this relevant? Let me explain.

One day on the way to class, out of boredom I was perusing the exciting advertisements plastering the walls of the metro car. My eyes landed upon this intriguing logo, accompanied by the letters, “RATP,” and I found it to be one of the most unintentionally amusing things that I have ever seen.

Standard interpretation of the RATP symbolism (Image from Creads.fr)

You see, in class we have been discussing many experiments that use mice. Mice are really good at being the subjects of neuroscience experiments, it turns out. So the first thing that came to my mind was this sort of double entendre: this poster was advertising the Paris metro system while highlighting the scent of rat urine that may often accompany it.

Lab rat (Image from Shutterstock.com)

The symbol and acronym actually represent Régie Autonome des Transports Parisiens, the group that operates much of the public transportation in the region. And according to one website, the logo is supposed to be an artistic representation of  Paris.  I never would have guessed this, but perhaps my interpretation is unique, influenced by my recent experiences in class.

In fact, I’ve been thinking so much about rodents that I’ve been dreaming about them! So I wanted to know: Why was I dreaming about mice? Is it possible that these dreams impacted my interpretation of the RATP symbol?
My theory was that mice have been so prevalent in my thoughts during the day (due to all the neuroscience research that I have been reading about) that they infiltrated my dreams at night. Maybe this is what led me to interpret the logo in such a humorous way! Neuroscience can provide some answers as to what likely occurred here.

The neuroscience of sleep and dreaming isn’t fully understood. But, scientists know that the brain isn’t inactive when we’re asleep: contrary to the idea of “resting” during sleep, the brain actually doesn’t shut down at all (Debunking Sleep)! It fluctuates through different stages of activity  throughout the night, meaning the cells are active in different patterns (Brain Basics).

During one type of brain activity called slow-wave sleep (SWS), our brains “replay” certain memories from the day and put them into long-term storage (Hasselmo, 1999). This is termed “memory consolidation,” and it is as if these experiences were being packaged into neat little containers for protection and easy access in the future. During “slow-wave sleep,” cells are sending signals in slow bursts, and this likely had a role in making my memory of the mice stronger and easier to recall! This strong memory of mice seems to be why I interpreted the RATP symbol in such a way. But what does dreaming have to do with it?
Dreams are created by the brain’s activity while we sleep. Scientists also know that their content—the scenes and emotions that get incorporated into them–is pulled from our recent thoughts and experiences while we’re awake (Stickgold et al., 2001). This explains why I was dreaming about mice!

But, my question isn’t fully answered yet: Was dreaming about mice what caused the memory consolidation that led to my humorous interpretation?

Neuroscientists actually don’t yet understand the relationship between dreaming and memory consolidation. But, some current research can help to shed some light on the subject.

A recent study by Siclari et al. (2017) identified a certain part of the brain they called a “hot spot” for dreaming. Whenever a certain type of activity is detected in this area—the back half of the brain, lying directly behind your ears—you are likely dreaming!

In order to do this, researchers used a machine called an electroencephalogram (EEG) to measure people’s brain activity while they were sleeping. Using sensors placed all over each subject’s head, this machine detects changes in electrical activity, telling researchers the patterns in which brain cells are firing (Britton et al., 2016).

Electroencephalogram (Image from Michigan Advanced Neurology Center)

In this study, people wearing EEG sensors (shown in the picture above) were awakened at random points during a night’s sleep and asked to report if they had been dreaming. By looking at the EEG data, the researchers were able to determine that high frequency activity—meaning that brain cells were sending signals very quickly—was associated with dreaming when it occurred in the back half of the brain. This means that they were able to predict whether someone was having a dream or not (Siclari et al., 2017)!

So what does that mean for me? The conclusions of this study suggest that dreams are actually less likely to occur during SWS, which is associated with low-frequency activity. Since this activity signals when memory consolidation occurs, it is not clear if dreaming about mice helped my brain consolidate the memory.

Dreams of neuroscience experiments (Image from ScienceABC.com)

But, it’s still not clear if dreams have a role in consolidating memories. In the realm of neuroscience research, these findings are important, but they don’t exactly align with what has been suggested in the past. Some researchers have found that dreaming about an experience enhances one’s ability to recall it (Fiss et al., 1977; De Koninck et al., 1990; Wamsley 2014). Still, this is an essential step in understanding the mechanisms of memory consolidation in sleep: dreams likely have some functions that we haven’t fully uncovered yet!

In conclusion, it is still amusing to me how my daily experiences—solidified into my memory during sleep—shaped my interpretation of this advertisement in such an entertaining way! Certainly my experiences in class contributed a lot about rodents to my memory bank, and I’m grateful for it: If nothing else, it gives me an extra opportunity to chuckle to myself every day on an otherwise monotonous metro ride!

References:

Brain Basics: Understanding Sleep. (n.d.). Retrieved from https://www.ninds.nih.gov/Disorders/Patient-Caregiver-Education/Understanding-Sleep

Britton J.W., Frey L.C., Hopp J.L., et al. (2016). Electroencephalography (EEG): An Introductory Text and Atlas of Normal and Abnormal Findings in Adults, Children, and Infants. American Epilepsy Society. Available from: https://www.ncbi.nlm.nih.gov/books/NBK390346/

De Koninck, J., Christ, G., Hébert, G., Rinfret, N. (1990) Language learning efficiency, dreams and REM sleep. Psychiatr J Univ Ott. 15:91-92.


Debunking Sleep Myths: Does Your Brain Shut Down When You Sleep? (n.d.). Retrieved from https://www.sleepfoundation.org/articles/debunking-sleep-myths-does-your-brain-shut-down-when-you-sleep.


Fiss H, Kremer E, Litchman J. (1977).The mnemonic function of dreaming. Sleep Res. 6:122

Hasselmo, M. E. (1999) Trends Cogn. Sci. 3:351-359.pmid:10461198

Que signifie le logo RATP ? Creads décrypte ! Design Tribe. 06 May 2019. 17 June 2019 <https://www.creads.fr/blog/logos/ratp-logo-signification>.

Siclari, F., Baird, B., Perogamvros, L., Bernardi, G., LaRocque, J. J., Riedner, B., … Tononi, G. (2017). The neural correlates of dreaming. Nature neuroscience, 20(6), 872–878. doi:10.1038/nn.4545.

Wamsley, E.J. (2014) Dreaming and offline memory consolidation. Curr Neurol Neurosci Rep.14:433. doi:10.1007/s11910-013-0433-5.


Images:

https://www.creads.fr/app/uploads/sites/1/2017/06/xblog_header_logo-ratp.png.pagespeed.ic.i85aUDxX_m.png

https://www.creads.fr/app/uploads/sites/1/2017/06/xratp_paris-1080×360.jpg.pagespeed.ic.kCFNHediBC.jpg

https://www.google.com/url?sa=i&source=images&cd=&ved=2ahUKEwiSkJfisfHiAhVEz4UKHaDuAhwQjRx6BAgBEAU&url=https%3A%2F%2Fwww.shutterstock.com%2Fsearch%2Flab%2Brat&psig=AOvVaw3hoyYBXrLGKLqHFqXyVCRE&ust=1560890866488329

https://www.google.com/url?sa=i&source=images&cd=&ved=2ahUKEwjQzP_vsfHiAhXOxYUKHfERCY0QjRx6BAgBEAU&url=http%3A%2F%2Fdrmridha.com%2Fservices%2Feeg&psig=AOvVaw2kTv60u9LU2CwlYwZhFSf-&ust=1560890899835683

https://www.scienceabc.com/wp-content/uploads/2015/09/Happy-smiling-kid-sleeping-and-smiling-in-her-sleep.-Dream-the-little-princess-on-a-white-bed-close-up-speaking-in-dream.-Vitalinkas.jpg

Hyperlinked sites and videos:

https://www.ratp.fr/en/groupe-ratp

https://www.youtube.com/watch?v=I3j2VrhqTAA

https://www.youtube.com/watch?v=iWo90uxkNM0

https://www.creads.fr/blog/logos/ratp-logo-signification

The Art (and Science) of People Watching

After my weekend exploring the Musee du Louvre, going to the Women’s World Cup, and riding my umpteenth trip on the metro, I noticed that my go to activity while I explore is people watching. People watching, in its purest form, is the idea of observing other people in a public setting. We all do it, whether we are aware of it or not, and it has a variety of results from my own experience as a seasoned player.

Location of where the Louvre right next to the Seine River

People watching takes on a different form where you are; you can get away with more than a glance at a sporting event  like the Women’s World Cup than you can in a cramped metro where everyone is trying, and sometimes not trying at all, to look at everything but the five different people close enough to count eyelashes. Even in those situations, you cannot help but take a millisecond scan of your surroundings just in case in you miss out on something compelling.

This is a part of everyday life and a hobby that I do almost daily. We’re doing the opposite of what we usually do when we people watch; instead of blocking out majority of the stimuli we encounter on a daily basis we take the time to take in every detail as it crosses our path. I started to wonder how people watching is so enjoyable despite the cacophony of stimuli we take in when we do this activity.

Main entrance to the Louvre: Prime location for art appreciation and people watching!

It turns out that people watching requires activation in three different brain networks to during people watching (Quadflieg & Koldewyn, 2017). For example, the person perception network (PPN) is a brain network of brain structures that examine a person’s individual appearance and the way they move which is important to decipher an overall person to person encounter (Quadflieg & Koldewyn, 2017). One specific brain area in the PPN that supports the PPN’s overall function is the posterior superior temporal sulcus (pSTS), but it was not explicitly seen that the pSTS was active while observing social interactions until one 2018 study (Walbrin, Downing, & Koldewyn, 2018).

To test the pSTS activation, the researchers asked fifty-five participants to view human like figures in two 8-second scenarios for multiple trials: one scenario had two figures socially interacting and the second scenario had the two figures doing independent activities (Walbrin, Downing, & Koldewyn, 2018). The researchers used fMRIs to compare pSTS activity when the participants viewed social interactions verse when the participants viewed individual actions. After testing, the researchers found that the right pSTS had a significantly higher activation as the participants viewed the figures interacting with each other compared to when the participants viewed figures doing individual activities (Walbrin, Downing, & Koldewyn, 2018).

Graph showing a significant change in percentage signal activation of the pSTS once shown social interactions verse independent actions

It’s great that the researchers recorded pSTS activation from people seeing direct social interaction because it helps focus further directions into how social patterns change when people have conditions that affect the pSTS. The researchers even looked at other brain areas thought to assist in people watching but in a different capacity than just surface level observations of the interaction. The researchers added a control where they examined the temporoparietal junction (TPJ). The TPJ helps in assigning people’s intentions with one another from what we observe, but it does not work on a board scale in analyzing social interactions verse individual interactions like the researchers predicted the pSTS to do (Quadflieg & Koldewyn, 2017).

While this control helped the researchers determine if pSTS functions specifically while viewing social interactions, an experiment looking into nonhuman subjects’ that have areas similar to the pSTS inhibited or lesioned with provide more concrete evidence to the pSTS functioning examining social interactions or people watching.

Nevertheless, it is still interesting how we have multiple brain networks and brain structures involved to help us understand what we are looking at as we scan our surroundings and the people within it.

In my opinion, people watching is a great skill to have especially in places you’ve never been to before. By watching the people around interacting with each other and their surroundings, I’m able to pick up on what’s acceptable and what’s not. Especially in Paris, I’m trying to do everything I can to blend in and not expose myself as the Lost American, a title I still haven’t been able to shake off.

USA vs. Chile Women’s World Cup. The BEST place to people watch: screaming Chilean grandparents, babies decked out in USA memorabilia, cursing in three different languages, and an indescribable energy you have to love

Even so, everyone still has instances where social cues fall through the cracks. It is those times when you realize that you haven’t moved quickly enough when there is a bike riding on the sidewalk as you walked to the Musee du Louvre or you  you’re taking your sweet time trying to get a glimpse of Hope Solo while someone waits patiently to get their new profile picture during half-time, or the numerous other fish out of water experiences that I have encountered in France. Thankfully, I’ve stopped being embarrassed in these situations and tried to do better for the future by sticking my faithful ally in people watching.

Because we have various brain networks like the PPN with brain structures like the pSTS present to determine most beneficial actions to blend in any situation or find most entertaining of scenarios, it’s not hard see why we continue to people watching at the most inopportune times. We have the wiring to help us bounce back from the mistakes we make.

Without the spatial and social awareness that comes from people watching, I would not have the same peculiar but truly fascinating experiences I’ve had throughout Paris. So, I’m keeping my eyes peeled for the next exciting exploration or the next cue that comes my way.

References

Children’s Healthcare of Atlanta. (n.d.). fMRI. Retrieved from https://www.youtube.com/watch?v=3fNf8KX1AlQ

Quadflieg, S., & Koldewyn, K. (2017). The neuroscience of people watching: how the human brain makes sense of other people’s encounters. Annals of the New York Academy of Sciences,1396(1), 166–182. https://doi.org/10.1111/nyas.13331

Walbrin, J., Downing, P., & Koldewyn, K. (2018). Neural responses to visually observed social interactions. Neuropsychologia,112, 31–39. https://doi.org/10.1016/j.neuropsychologia.2018.02.023

Image #1: [Screenshot of the Musee du Louvre]. Retrieved from https://www.google.com/maps/place/Louvre+Museum/@48.8606111,2.3354607,17z/data=!3m1!4b1!4m5!3m4!1s0x47e671d877937b0f:0xb975fcfa192f84d4!8m2!3d48.8606111!4d2.337644

Image #3: [Screenshot of the Figure 2]. Retrieved from https://www.ncbi.nlm.nih.gov/pmc/articles/PMC5899757/

Image #2 and #4 were taken by me

What Colorful Language!

We always see it in the movies: the younger child and the father laying together in the grass, gazing up at the midday sky. She asks what color the sky is, and he says blue without hesitation. Such a simple answer to what is, in reality, such a complex question. Over the past few weeks, to combat my occasional homesickness, I’ve found myself looking up to the sky, wondering if my parents can see the same sky back home in Georgia. When we discussed the colors of the sky in class, it encouraged me to investigate the simple answer to the question: what color is the sky?

Just one example of the types of colorful skies one could witness here in Paris.

The real answer, it turns out, depends on a variety of factors; the time of day, location of the viewer, location of the sun, the viewer’s visual abilities, language, mood, etc. From personal experience, I believe the same sky can be different colors to the same viewer in different states of mind. For example, individuals experiencing sadness have a greater tendency to “focus on the tree instead of the forest” (Gasper 2002), which translates to not seeing the full visual picture and instead fixating on visual detail, such as the shade of one item instead of the collective colors in a room. In a more scientific sense, a red-green colorblind viewer would have a different visual opinion of a sunset than a normally sighted individual. But what about language?

Interestingly enough, language and culture also exert a large influence on color perception; different languages have different words for different colors, and some only have one word for a whole category of colors. The color category perception effect (Zhang 2018) describes this phenomenon in which “people were more likely to distinguish colors from different colors than those that landed in the same area.” Those who speak languages that have more words for different colors would, under this theory, be better able to distinguish various shades than those who speak a language with fewer words for color. Based on this perception of color, two people from different cultures could view the sky in different shades. The figure below displays how the color wheels of the English and Greek lexicon differ due to variations in groupings.

Image result for the color wheelImage result for color wheel in greek

There is evidence that language centers in the brain are activated with color perception; in an experiment performed by Siok et al., when stimuli are observed from different linguistic categories, there is a greater activation of visual cortex areas 2/3 – the areas responsible for color vision. This enhanced V2/3 activity coincided with enhanced activity in the left posterior temporoparietal language region, which suggests a top-down control from the language center to modulate the visual cortex (Siok 2009). In other words, increased activity in language perception areas of the brain correlates to increased modulation of color vision before you’ve had the chance to pay conscious attention (Athanasopoulos 2010).

This is especially relevant in Paris; as an English-only speaker in a world of French speakers, I can’t help but wonder how differences in our color-related vocabulary translate to questions like that of the sky’s color. It is known that language effects sensory perception in its earliest stages (Athanasopoulos 2010), but would learning French color vocabulary change my perception of what colors I see? A previous experiment (Theirry 2009) demonstrated a difference in brain activity for both a native Greek and English speaker, the former of which makes a lexical distinction between light blue (ghalazio) and dark blue (ble). This is shown in the figure below, which demonstrates a greater Visual Mismatch Negativity response for the Greek participant when they were observing a blue stimulus due to greater lexical representation for this color.

A report of differences between speakers of different languages in early color perception. The shaded area represents presentation of a specific marker between 170 and 220 milliseconds post-stimulus. Notice the difference in negative response between Native English and Native Greek for the color blue.

In summary, the influence of language is one often underestimated when considering why we see the colors we do. I believe perception of color is a uniquely integrative experience, combining elements of culture, background, language, personality, and individuality to create specific visuals distinctive to one person. This seems all the more evident in Paris; everything is so new, so fresh and exciting that I cannot help but feel that the very colors of Paris hold something special that I have not seen elsewhere. So what color is the sky? You may be surprised, as I was, to find your answer constantly changes.

Citations:

Athanasopoulos, P., Dering, B., Wiggett, A., Kuipers, J., & Thierry, G. (2010). Perceptual shift in bilingualism: Brain potentials reveal plasticity in pre-attentive colour perception. Cognition, 116(3), 437-443. doi:10.1016/j.cognition.2010.05.016

Gasper, K., & Clore, G. L. (2002). Attending to the Big Picture: Mood and Global Versus Local Processing of Visual Information. Psychological Science, 13(1), 34-40. doi:10.1111/1467-9280.00406

Siok, W. T., Kay, P., Wang, W. S., Chan, A. H., Chen, L., Luke, K., & Tan, L. H. (2009). Language regions of brain are operative in color perception. Proceedings of the National Academy of Sciences, 106(20), 8140-8145. doi:10.1073/pnas.0903627106

Thierry, G., Athanasopoulos, P., Wiggett, A., Dering, B., & Kuipers, J. (2009). Unconscious effects of language-specific terminology on preattentive color perception. Proceedings of the National Academy of Sciences, 106(11), 4567-4570. doi:10.1073/pnas.0811155106

Zhang, J., Chen, X., You, N., & Wang, B. (2018). On how conceptual connections influence the category perception effect of colors: Another evidence of connections between language and cognition. Acta Psychologica Sinica, 50(4), 390. doi:10.3724/sp.j.1041.2018.00390


Paul Cézanne, Museum Fatigue Advocate

Have you ever experienced museum fatigue? I thought that I made up this term to describe my own experiences, but upon performing a quick Google search, I discovered that this is actually a phenomenon first described in 1916 (Gilman, 1916).

Interior of the Musée d’Orsay (Image from TripSavy.com)

Going to a museum may seem like a passive process, but to me, it is actually quite a bit of work!

Navigating large crowds and carrying a heavy backpack for several hours is enough to wear me out. But even more so, interpreting piece after piece of artwork—each of which leaves a lot of room for interpretation—is a laborious effort leading to mental exhaustion. Though it is uncomfortable, I think that this is the way it should be. If you don’t experience some fatigue, are you fully engaged with and appreciating the art?

Exterior of Musée d’Orsay (Image from SortiraParis.com)

One particular French artist I have learned about in class is Paul Cézanne, and he seems to have been an especially avid proponent of museum fatigue; although his works were rejected from museums during his lifetime, it seems as if he were intentionally inducing this exhaustion. In the Post-Impressionistic style (abandoning the detailed, picture-perfect landscapes characteristic of Realism), Cézanne produced blurry, unfinished images in order to accentuate the mind’s interpretation process. Leaving blank spots peeking through the blobs of color is a technique called nonfinito, and it’s a bit like trailing off in the middle of a sentence—a visual ellipsis. In this way, the viewer’s interpretation is unique to the way the mind fills in the gaps at that particular moment, influenced by all of the emotions and experiences one brings to the table.

It turns out that this reflects how the brain works when interpreting all visual stimuli: even looking at the same things twice may trigger different responses from neurons dedicated to processing visual information (Jeon et al., 2018).

First, let’s start with some background information about vision and how our

The occipital lobe, shown in yellow (Image from The Science of Pscychotherapy.com)

brains process signals coming from our eyes.

Light enters the eye and reaches the retina at the very back. There, it stimulates light-responsive cells called photoreceptors (rods and cones). Signals from all these cells go through the optic nerve, the optic tract, a structure called the thalamus, and eventually reach the part of the brain that deals with visual information. This area is called the occipital lobe, and the section that is first to receive these signals is called the primary visual cortex, or V1. Here, there are cells that have been shown to respond to basic details of a scene like the width and orientation of lines (Gawne, 2015). Each cell is “tuned” to respond best to a certain width and a certain orientation, and logically, this is called neuronal tuning (Butts and Goldman, 2006). The conditions determining the responsivity of the neurons get more and more complex as the signals are processed (Tsunoda et al., 2001).

The perception of visual information (Image from Slideplayer.com)

As one views the same image, it would make sense that the same neurons respond each time. But, this is not exactly the case: In one experiment by Jeon et al. 2018 in the journal Nature, researchers found that the same neurons aren’t reliably activated by the same stimuli.

In the study, the researchers showed mice lines of different orientations and widths. Using a technique called two-photon calcium imaging, they looked at the activity of neurons in the V1 (Jeon et al., 2018). This technique involves installing an apparatus on the head of a mouse. Based on the movement of fluorescing ions, it lets us see what neurons are active as the mouse is awake and interacting with the world (Mitani and Komiyama, 2018).

Some of the images shown to mice in the Jeon et al. (2018) experiment (Image from the journal Nature)

Tracking around 300 neurons, the researchers determined the qualities of the image (such as the angle and the width of the lines) for which a neuron was most likely to respond. Then, performing the test one week later and again two weeks later, they compared the preferences of the neurons. While the majority of individual qualities were relatively stable over time, the researchers found that fewer than half of the neurons had exactly all of the same preferences as before.

What does this all mean? In the past it has been shown that the visual cortex is highly plastic, or able to rearrange and reorganize its connections based on new information (Hofer et al., 2009).  However, these results provide even more insight into how our visual systems adapt and change: some parts can remain stable while others change their responsivity in order to incorporate new information, altering our perception of the world around us.

So, our perception of static scenes is actually not static at all; it is being altered constantly! That boulangerie we pass on the way to class is not perceived by our brains in exactly the same manner every day.

Portrait of a Woman by Paul Cezanne (Image from the Metropolitan Museum of Art)

That leads me to wonder: especially when looking at one of Cézanne’s paintings—since he left so much for the viewer’s mind to fill in—do we ever experience the same thing twice?  This may very well be the most intriguing thing about his work, making it both timeless and malleable. A perfect excuse to visit the Musée d’Orsay just one more time.  The unfortunate result is only that this “museum fatigue” may become an increasingly common affliction. However, it’s likely already a common experience for all the museum-goers of the world, and I’m not afraid. It certainly won’t deter me from absorbing all of the Post-Impressionism art I can while I’m here!


References:

Butts, D.A., Goldman, M.S. (2006). Tuning curves, neuronal variability, and sensory coding. PLOS Biology. 4:92. doi: 10.1371/journal.pbio.0040092.

Gawne, T. (2015). The responses of V1 cortical neurons to flashed presentations of orthogonal single lines and edges. Journal of Neurophysiology. 113:2676-2681. doi: 10.1152/jn.00940.2014

Gilman, B. I. (1916). Museum Fatigue. The Scientific Monthly. 2:62–74.

Hofer, S. B., Mrsic-Flogel, T. D., Bonhoefer, T. & Hubener, M. (2009). Experience leaves a lasting structural trace in cortical circuits. Nature. 457:313–317.

Jeon, B. B., Swain, A.D., Good, J. T., Chase, S. M., Kuhlman, S.J. (2018). Feature selectivity is stable in primary visual cortex across a range of spatial frequencies. Nature. 8:15288. doi:10.1038/s41598-018-33633-2.

Mitani, A., Komiyama, T. (2018). Real-time processing of two-photon calcium imaging data including lateral motion artifact correction. Frontiers in Neuroinformatics. 12:98. doi: 10.3389/fninf.2018.00098

Tsunoda, K., Yamane, Y., Nishizaki, M., Tanifuji, M. (2001). Complex objects are represented in macaque inferotemporal cortex by the combination of feature columns. Nature Neuroscience. 4:832-838. doi: 10.1038/90547.


Image links:

https://www.tripsavvy.com/thmb/l0SeupBCtJWyVCf7U_I4BGsPql8=/960×0/filters:no_upscale():max_bytes(150000):strip_icc()/8414359797_20e28f27f2_o-56a403d25f9b58b7d0d4f0e6.jpg

https://www.sortiraparis.com/images/55/1467/108625-jeu-de-piste-gratuit-au-musee-d-orsay.jpg

https://www.thescienceofpsychotherapy.com/wp-content/uploads/2018/10/bigstock-Female-Occipital-Lobe-Brain.png

https://slideplayer.com/slide/6900016/23/images/4/Figure+4.1+%28a%29+Side+view+of+the+visual+system%2C+showing+the+three+major+sites+along+the+primary+visual+pathway+where+processing+takes+place%3A+the+eye%2C+the+lateral+geniculate+nucleus%2C+and+the+visual+receiving+area+of+the+cortex..jpg

https://collectionapi.metmuseum.org/api/collection/v1/iiif/656892/1571903/restricted

Hyperlinked videos and sites:

https://www.youtube.com/watch?v=fZDAwXh54is

https://goo.gl/maps/GM2ZURPTLpia3V7b9

https://www.paulcezanne.org/


What do Welders and Van Gogh have in common?

(Sounds like a bad joke, but I promise there is an answer.)

Recently in class we talked about the interesting life of Vincent Van Gogh. Van Gogh had many health problems, one of which he is infamous for: cutting off his own ear. Besides that, he was also afflicted with hallucinations, anxiety, mania, and delirium, just to name a few. The ultimate diagnosis regarding his mental state was never made clear but Van Gogh also had other problems not related to mental health. One problem concerned his vision and the yellow tint that is present in most of his work. There are several circulating hypotheses that describe why this is.

(Yellow) Vase with Fifteen (Yellow) Sunflowers by Van Gogh

Some say this yellow characteristic is attributable to artistic preference. Paul Gauguin, a friend of Van Gogh’s once commented on Van Gogh’s excessive use of the color yellow stating: “Oh yes, he loved yellow, this good Vincent… those glimmers of sunlight rekindled his soul” (Marmor and Ravin, 2009). Other experts attribute this characteristic to possible digitalis intoxication, which causes xanthopsia, a color deficiency (Lee, 1981). What exactly is digitalis? Digitalis purpurea commonly known as foxglove, is a plant with tubular flowers which is now known to be toxic to humans. Today the active ingredient in the plant (digoxin) is used to treat heart rhythm irregularities in small quantities (“Digitalis toxicity”, 2019). However, back in the day, digitalis was used to treat epilepsy, which Van Gogh was diagnosed with by Dr. Gatchet.

Portrait of Dr. Gatchet with a foxglove plant

Xanthopsia is an example of an acquired color vision deficiency. The possibility of acquiring a color vision deficiency is also demonstrated in one study that examines the color vision deficiency prevalence in welders. Welders are usually exposed to a range of light waves including UV rays to infra-red rays, and are also exposed to various gaseous emissions (Heydarian et al., 2017). The authors of this study wondered how this constant exposure to these substances have impacted the vision of the workers. This study was done by comparing the vision of 50 randomly selected male welders from Zahedan city, who had welded for at least 4 years and were around 29 years of age, to 50 randomly selected healthy non-welder men who worked in a hospital and were around 28 years of age.  The color vision of these 100 men were tested with a Farnsworth D-15 test which classifies the type of dyschromatopsia, or color vision disorder, that is being expressed.

Farnsworth D15 Color Test Apparatus

The results show that the prevalence of color vision disorder in welders was significantly higher than that of non-welders (Heydarian et al., 2017). Additionally, there exists a positive relationship between years spent employed as a welder/average working hours and the prevalence of color vision deficiency (Heydarian et al., 2017). Interestingly, blue-yellow impairment is more common (although not significantly) than red-green impairment, which is found to be a common factor in occupation related color vision deficiency overall (Mergler and Blain, 1987). The reason why blue-yellow impairment in occupation related color vision deficiency is more prevalent is not exactly clear but would be a great topic to study further (Gobba and Cavalleri, 2003).

In the end, while we know that Van Gogh did not experience occupation related color vision deficiency, he may have had digitalis induced color vision deficiency. So there you go, both welders and Van Gogh have color vision deficiency in common.

References

Digitalis toxicity. (n.d.). Retrieved June 10, 2019, from MedlinePlus website: https://medlineplus.gov/ency/article/000165.htm

Gobba, F., & Cavalleri, A. (2003). Color vision impairment in workers exposed to neurotoxic chemicals. Neurotoxicology, 24, 693-702.

Heydarian, S., Mahjoob, M., Gholami, A., Veysi, S., & Mohammadi, M. (2017). Prevalence of color vision deficiency among arc welders. Journal of Optometry, 10(2), 130-134.

Lee, T. C. (1981). Van Gogh’s vision: Digitalis intoxication? JAMA, 245(7), 727-729.

Marmor, M., & Ravin, J. (2009). Artist’s eyes. New York, NY: Abrams.

Mergler, D., & Blain, L. (1987). Assessing color vision loss among solvent-exposed workers. American Journal of Industrial Medicine, 12(2), 195-203.

Picture 1: https://www.vangoghgallery.com/catalog/Painting/586/Still-Life:-Vase-with-Fifteen-Sunflowers.html

Picture 2: https://en.wikipedia.org/wiki/Portrait_of_Dr._Gachet

Picture 3: https://www.ophthalmic.com.sg/product/farnsworth-d15-color-test/

Would Lithium be a Good Treatment for Vincent Van Gogh?

I am not an art enthusiast, but this summer of my junior year in college has brought me closer to the life of perhaps the most famous painter in the history of western art, Vincent van Gogh. Before I traveled to Europe this summer, I watched two recent movies “Loving Vincent” and “At Eternity’s Gate” that were made based on the life of Vincent van Gogh. My summer started in the Netherlands, and I traveled down to Belgium, Paris, and Provence. This route coincidentally followed van Gogh’s path of mental deterioration, which eventually ended with his suicide in 1890 at the age of 37.

Self Portrait (1887), Rijksmuseum, Amsterdam

Van Gogh Self Portrait (1889), Musée d’Orsay, Paris

Garden of the Hospital in Arles (1889), Espace van Gogh, Arles
Van Gogh was committed after the infamous episode of cutting off his left earlobe in December 1888.

The mental state of van Gogh has long been a subject of controversy. Three years ago, mental health doctors and art history experts came together at the Van Gogh Museum in Amsterdam to find a diagnosis for him (Siegal, 2016). (Read more at https://www.vangoghmuseum.nl/en/stories/on-the-verge-of-insanity) After having a thorough examination of the medical record of his case as well as personal letters, the doctors failed to come to the conclusion of a single diagnosis. Though there might be more than one illness van Gogh has suffered in his life, most analytics, including American Psychiatrist Dietrich Blumer, agree on that van Gogh has displayed many symptoms of bipolar disorder (Blumer, 2002).

Professor Isabella Perry first assigned van Gogh with a diagnosis of bipolar disease (Perry, 1947). People with bipolar disease have recurrent episodes of elevated mood and depression, together with changes in activity levels (Anderson, Haddad, & Scott, 2012). Van Gogh’s life has been also associated with periods of intense activity and depression (Perry, 1947). Bipolar disease is the 6th leading cause of disability worldwide and has a prevalence of about 1-3% of our general population (Moreira, Van Meter, Genzlinger, & Youngstrom, 2017). This particular psychiatric illness has also been linked with creative accomplishment and many names in the history of creative art. Writers Ernest Hemingway, Virginia Woolf, Composer Robert Schumann, Painter Jackson Pollock and most likely Vincent van Gogh are all among the list (Rothenberg, 2001).

Lithium has been used as the main treatment for bipolar disease for the last sixty or more years (Won & Kim, 2017). Lithium has also been demonstrated to reduce suicide rates and prevent manic episodes in bipolar disease patients (Anderson et al., 2012). However, only one-third of bipolar disorder patients respond to the treatment. Why this treatment works in some patients and does not work in other patients is unknown (Tobe et al., 2017). Although the therapeutic pathways of lithium are complex, through recent research, lithium’s exact mechanism is progressively being clarified. It is becoming more evident that biological systems modulated by lithium are deeply intertwined with biological disruptions associated with bipolar disorder (Won & Kim, 2017).

A recent study published in PNAS used stem cells (cells that can differentiate into other cell types) to unravel lithium’s target and therefore gave the scientists an opportunity to look deeply into the cellular mechanism of bipolar disorder. In this article, the authors have cleverly used lithium, the most common treatment for bipolar disorder, as their “molecular can-opener for prying intracellularly to reveal otherwise inscrutable pathophysiology” in bipolar disorder. They mapped the “lithium-response pathway” which functions to govern the phosphorylation of a protein called CRMP2 involved in the neural network. Normally, the “tug-of-war” between the inactive state (phosphorylated) and active state (non-phosphorylated) is all done physiologically inside our brain. In bipolar disease patients, this “set-point” has gone all wrong. So, the role of lithium is to operate as a “referee” to normalize that set-point (Tobe et al., 2017). Though the “lithium-response pathway” is certainly not a complete picture of bipolar disorder, it helped us to gain significant insights into how lithium modulates our body and alleviate symptoms for patients with the disease.

(Watch Principal Investigator Evan Snyder explains this study)

Psychiatrist Albert Rothenberg argued in his paper that research has shown that lithium treatment has the risk of cognitive impairment and decreased productivity. Another impediment is that many creative people hold the false belief that there is an intrinsic connection between suffering and mental illness. Some believe that tampering with their illness will also destroy their creative talents. And therefore, non-compliance with the doctor’s prescription is fairly common (Rothenberg, 2001). Even if van Gogh had treatment available, whether he would have complied remains questionable.

So, to answer my question raised in the title of this blog post, yes, lithium could have been a useful treatment. But considering the fact that only a third of patients respond to treatments and also the fact that van Gogh had a history of drinking absinthe regularly, lithium would not a magical pill that will fix all the problems with him. By focusing our research on the molecular mechanism of lithium on bipolar disorder, we would be able to map out bipolar disorder in the brain and help these people suffering from this disease. Who knows, the next van Gogh might be among them.

Reference

Anderson, I. M., Haddad, P. M., & Scott, J. (2012). Bipolar disorder. 345, e8508. doi:10.1136/bmj.e8508 %J BMJ : British Medical Journal

Blumer, D. (2002). The Illness of Vincent van Gogh (Vol. 159).

Moreira, A. L. R., Van Meter, A., Genzlinger, J., & Youngstrom, E. A. (2017). Review and Meta-Analysis of Epidemiologic Studies of Adult Bipolar Disorder. The Journal of clinical psychiatry, 78(9), e1259-e1269. doi:10.4088/jcp.16r11165

Perry, I. H. (1947). VINCENT VAN GOGH’S ILLNESS: A Case Record. Bulletin of the History of Medicine, 21(2), 146-172.

Rothenberg, A. J. P. Q. (2001). Bipolar Illness, Creativity, and Treatment. 72(2), 131-147. doi:10.1023/a:1010367525951

Tobe, B. T. D., Crain, A. M., Winquist, A. M., Calabrese, B., Makihara, H., Zhao, W.-n., . . . Snyder, E. Y. (2017). Probing the lithium-response pathway in hiPSCs implicates the phosphoregulatory set-point for a cytoskeletal modulator in bipolar pathogenesis. 114(22), E4462-E4471. doi:10.1073/pnas.1700111114 %J Proceedings of the National Academy of Sciences

Won, E., & Kim, Y.-K. (2017). An Oldie but Goodie: Lithium in the Treatment of Bipolar Disorder through Neuroprotective and Neurotrophic Mechanisms. 18(12), 2679.