Ernest V. Garcia, PhD, or better known as Ernie, is an endowed professor in cardiac imaging and the director of Emory’s Nuclear Cardiology R&D Laboratory. He specializes in medical imaging and bioinformatics, particularly quantitative analysis of cardiac images. Ernie has received numerous awards and honors but to highlight a few he was named a Medical Imaging Industry Top 10 Nuclear Medicine Researcher by the Medical Imaging Magazine and was named to the Council of Distinguished Investigators of the Academy of Radiology Research.
What lead you to pursue cardiac imaging as part of your profession?
I was trained as a scientist, a physicist. And I had a great deal of experience with computers and computer software, which was unusual for a scientist working in the 1960s. Back then, cardiology was the most quantitative modality that existed and it probably still is today. Meaning that the cardiologists were and are interested in numbers and quantitative data. So, I thought that I would apply my scientific background to the art of image interpretation.
Who has impacted you the most in your career and why?
That’s a tough question, there is the physicist part of me. So, I am definitely motivated by the life of Einstein and the many things he did. But, I think a lot of my inspiration and motivation comes from the patients themselves. This is where I can see the impact and need for my work.

Ernest Garcia, PhD
Medicine has evolved substantially but there is an element that is still a bit of “art.” Many physicians are proud of that component. But, in today’s world from a patient’s point of view, it should be a science. They want medicine and doctors to be more objective in answering questions like: “Why give this medicine versus that medicine? Why give this surgery versus that treatment?” There are more demands for doctors to know exactly what they are doing.
Did your relationship with patients change after you had experienced your own cardiac event?
Obviously, the answer is yes. Your life always changes with an event like that. Beyond that when I was in college I would volunteer for studies and they would inject me with some imaging agent, I was a guinea pig. The thing that changed me more than anything else, was seeing the images of my heart analyzed by our software. It was like “WOW!” Most people did not think that I had heart disease, but it was very obvious from the images. That was a big event.
How did your own cardiac event impact your perception of your work with the cardiac toolbox?
First again, when I saw my images analyzed by the toolbox, to me it was like my son was diagnosing me. This meant I really believed what it said, regardless of what anyone else said. I knew what the problem was right then and there. To be honest, when I fill out a doctor’s sheet and see the question “Do you have heart disease,“ my initial reaction is still to say “no.” I don’t know why that is, because I definitely have heart disease, so I have to say yes. And over time I came to the realization that maybe I’m going to be one of those guys who goes into heart failure. So, it would be nice if there were tools to help treat that. Just like we have tools to help people with coronary disease, now we have tools to help people with heart failure. Maybe the toolbox, one of these days will knock on my door and say “Let me help you.”
Is it scary to see your own heart and know the medical implications and meaning of those images?

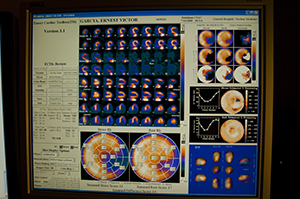
Emory Cardiac Toolbox Screen Shot
Actually, it is probably the opposite. In my case, I was concerned that my test would come out equivocal. Then, I would have had to choose, “should I have bypass surgery or not, should I go through all that?” But it was so obvious, there was no question what was going on with me. So, in fact that was a relief. Even though maybe I would have rather seen a totally normal heart, my imaging explained my symptoms. Patients look for answers to what is going on with them, and there is nothing more frustrating than unexplainable symptoms.
Did you feel like a pioneer at the time, as an academic, taking on the task of creating a start-up?
You know what they say about pioneers, they’re the ones that get the arrows in their rear ends.
The biggest issue was computers. Think of the computers in ’68 and ’69. They were expensive and inefficient. So a huge machine only had a little power and it would cost like $100,000. With those high costs computers came with software, or all the software they had at the time.
This is before Microsoft and Apple and people were not used to paying for software. So, as a so called pioneer, I had to point our that if a person wanted more software to have as a tool, they had to pay for it. And this was an idea that did not exist at the time so it was not easy.
Then when we started producing this software we reached another obstacle, because technology transfer is not what it is now. People used to say “why would a scientist want to develop a commercial tool? Scientists are supposed to be above that. They are supposed to write papers and then the companies develop the tools.” But, if I had followed that route, my software and the toolbox would have died. So, I took on the responsibility of seeing it all the way through and that got me a few more arrows in my back side.
Now over time and fortunately at Emory, we are seeing more of a positive view. That not only are scientists developing tools to help patients, but we are also generating funds to help run research labs and help the university fund further research. However, there are still people who say “Why is this guy so interested in money and commercial tools?”
What types of challenges are there currently in continuing the development of the cardiac toolbox?
We have been working on this for a long, long time. At Emory alone over 30 years. The idea of calling it a toolbox, is because it is exactly that. When we develop a new tool, we do not have to say “Oh, this is a different device.” It is like when you go to Sears and buy a toolbox with a lot of tools. You hope to have everything you need at the time in one box. So, as new needs evolve in cardiac treatment and diagnosis, we develop new tools to meet those needs.
The toolbox was originally developed to look at the blood flow and function of the left ventricle of the heart, which is the one that pumps blood and the one that gets in trouble when a patient has a heart attack. But, overtime other needs have evolved. Cardiology treatment has vastly improved and there are many great drugs and treatments available. That means that patients with heart disease live longer and move past their original cardiac problems and often into heart failure. With more heart failure and people living with heart disease to an older age there is a need for new treatments. There are pacemakers, which help input electronic waves into the left ventricle and try to synchronize the electronic stimulation. This was a recent addition to the toolbox. So, instead of helping the interventional cardiologists in the catheterization lab, this new tool helps the electrophysiologists.
Currently, many cases of undiagnosed or misdiagnosed cardiac symptoms are being seen in women, because women experience different symptoms than men. A lot of women come in with heart symptoms and are told “That’s not really your heart.” They are told this because their heart disease manifests in a different way than men’s disease does.
In men, it is usually the large vessel causing a heart attack. In women, very often, it is the small vessels that are affected. And it turns out that the smaller vessels cause more pain than the large one, but no one can see them using traditional imaging. So, often these women are sent to psychologists because they are complaining of a symptom that doctors cannot explain. But, now we are developing tools to detect more disease in women.
Additionally, the question always comes up as to whether an Indian patient’s heart looks similar to an American patient’s heart. We have to wonder if we can use the same normal databases, which we developed here at Emory by scanning normal peoples’ hearts. In the old days I used to gather my neighbors, asking them if they would like to be part of a normal database. I would then have my neighbors come to Emory and be imaged. So, the toolbox and computer compare a prospective cardiac patient to these normal distributions. But because we used Americans to develop our normal distribution, we have had to do a lot of work to try to reproduce and compare patient populations so that our observations demonstrate problems with a patients’ health and not just their genetic predispositions. We are finding that not only are there differences between men and women’s hearts, but also possibly between Chinese people, Indian people, Korean people.
What has been the most satisfying part of seeing the cardiac toolbox hit the market?
The first time that it really hit me, I was on vacation in Florence, Italy and there was a bookstore next to the place where I was staying. Browsing in the bookstore I found a book, which was in Italian, while looking through it I found our work. I thought “what an interesting thing to see.”
In visiting clinics all over the world and seeing that they are using the toolbox – that is very satisfying. The toolbox is not only in Italy, but also in places like Peru, Colombia, and even in places like Algeria and Iran. The toolbox is helping distribute the knowledge that we have, but with that comes responsibility to release new tools that are validated. There comes a time when you have to ask “when does this tool really start helping versus hurting people.”
Tell me something about yourself that many people do not know?
I think something people usually find particularly interesting is that I play in a rock band called The Thallium Stallions. Thallium is the pharmaceutical that we use for perfusion imaging. Our band plays at meetings for nuclear cardiology and nuclear medicine. I mostly play the alto sax.
There is also a video that accompanies this interview; you can find the video here.