This post is the first part of a series of Canvas Data stories where I share data trends and visualizations. Canvas use increased sharply in 2020 and remained quite high in 2021. This is evident in total views, Canvas Studio launches, online assignment submissions, and online discussion posts.
Overview
Emory University switched to remote learning in mid-March 2020 to finish the spring semester online in the early months of the COVID-19 pandemic. Most courses met online for synchronous instruction in Fall 2020 and Spring 2021. Most courses resumed meeting on campus for synchronous instruction in Fall 2021. The period of primarily online instruction accelerated trends of increasing Canvas use by our teachers and students. The data presented below show two things about increased Canvas use:
- Remote teaching and learning raised measures of Canvas use to new highs in 2020, including roughly doubled views, discussion posts, and online assignment submissions, as well as order of magnitude increases in Canvas Studio video usage.
- Canvas use stayed high compared to pre-pandemic measures throughout 2021 even as class meetings returned to campus for most courses in Fall 2021.
Data Visualizations
The visualizations for the four types of data share certain features.
- Each year is a line plotted between points representing weekly totals.
- Each year’s line is the same color in each image.
- Grand totals for included weeks are provided for annual comparisons.
- Winter break and summer weeks are filtered out of lines and grand totals.
- Weekly course counts determine line thickness for Studio launches, online submissions, and discussion posts.
- Peak weeks for selected years are labeled on each chart.
- Peak week unique user and course counts are available for Studio launches, online submissions, and discussion posts.
- Non-OPUS and sandbox courses are filtered out for Studio launches, online submissions, and discussion posts.
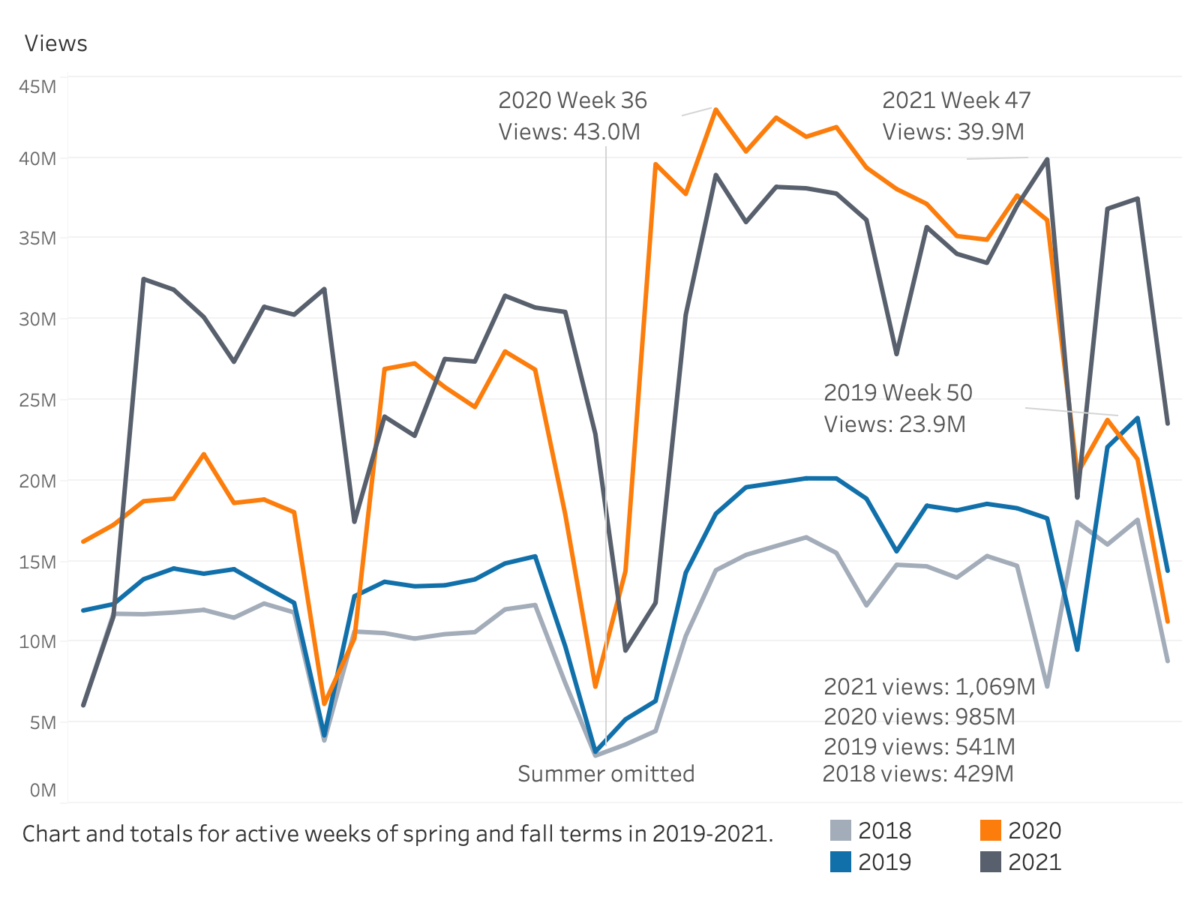
Views
When a user opens a page, a file, or some other type of content, or if they post a discussion reply, assignment submission, or in some way add content, Canvas logs the request to do so, which we call a “view.” The overall peak week was in Fall 2020. Total views nearly doubled from 2019 to 2021, and the 2021 total for included weeks topped 1 billion views.
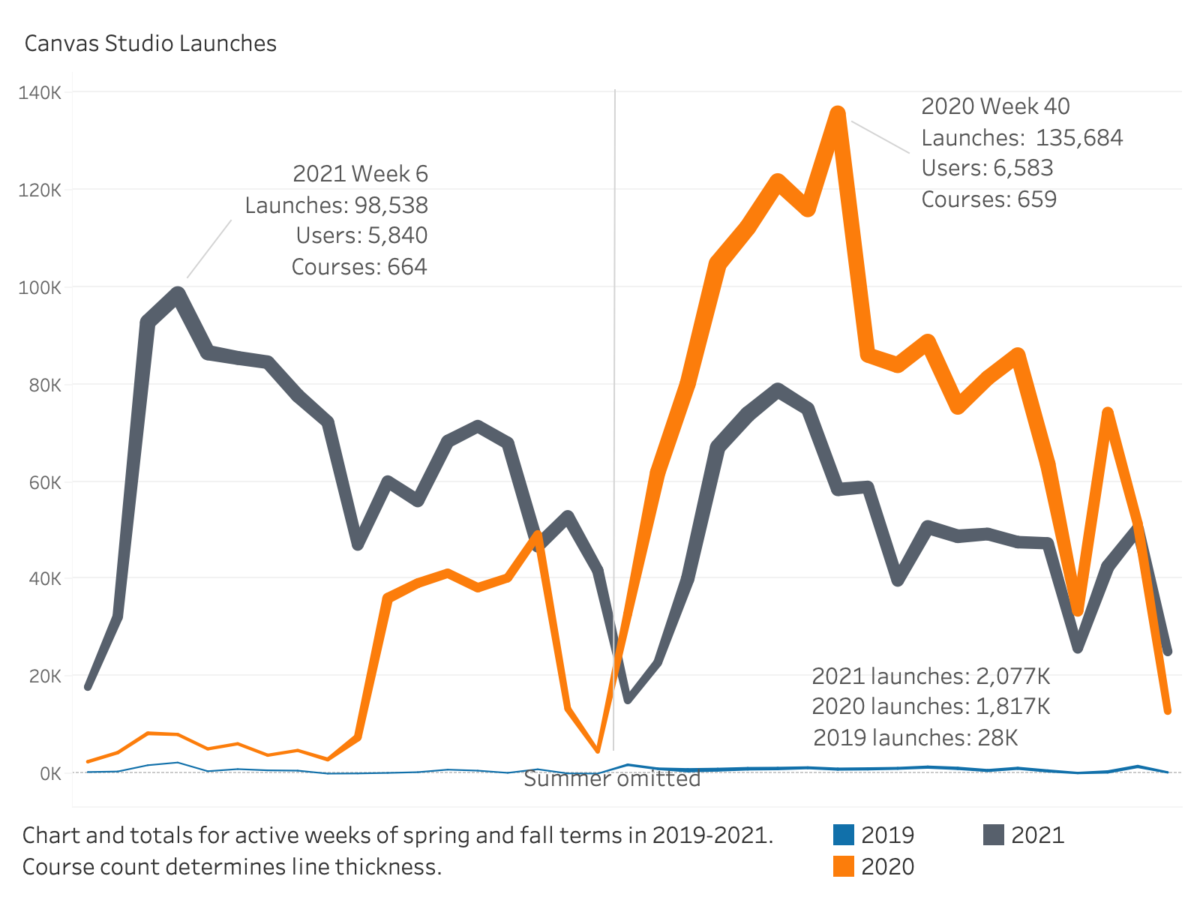
Canvas Studio Launches
When a user opens a Studio video module link or a content item with an embedded Studio video, Canvas logs the request to launch the tool. This is the most detailed data currently available, so we use it even though it does not directly measure video watching. In 2019, we piloted Canvas Studio in spring and made it available to all courses in fall. The weekly number of launches increased very significantly in the first part of Spring 2020, and after the switch to remote learning weekly launches were on the next order of magnitude. Total launches in 2021 topped those in 2020, and the weekly courses and launches for Studio remained high in Fall 2021.
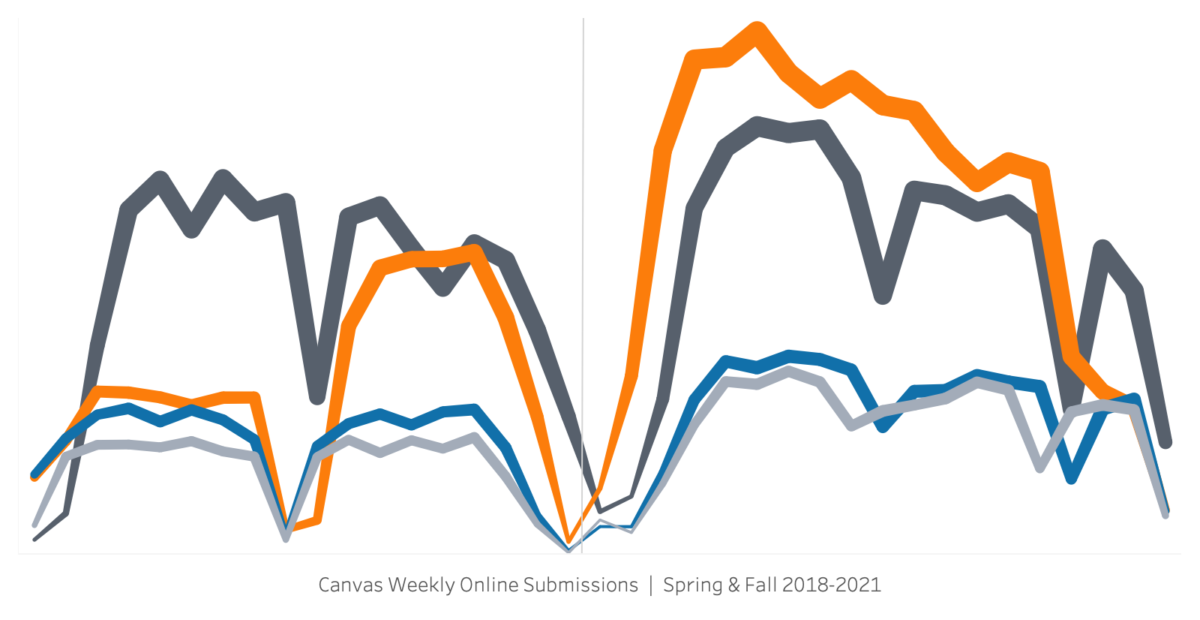
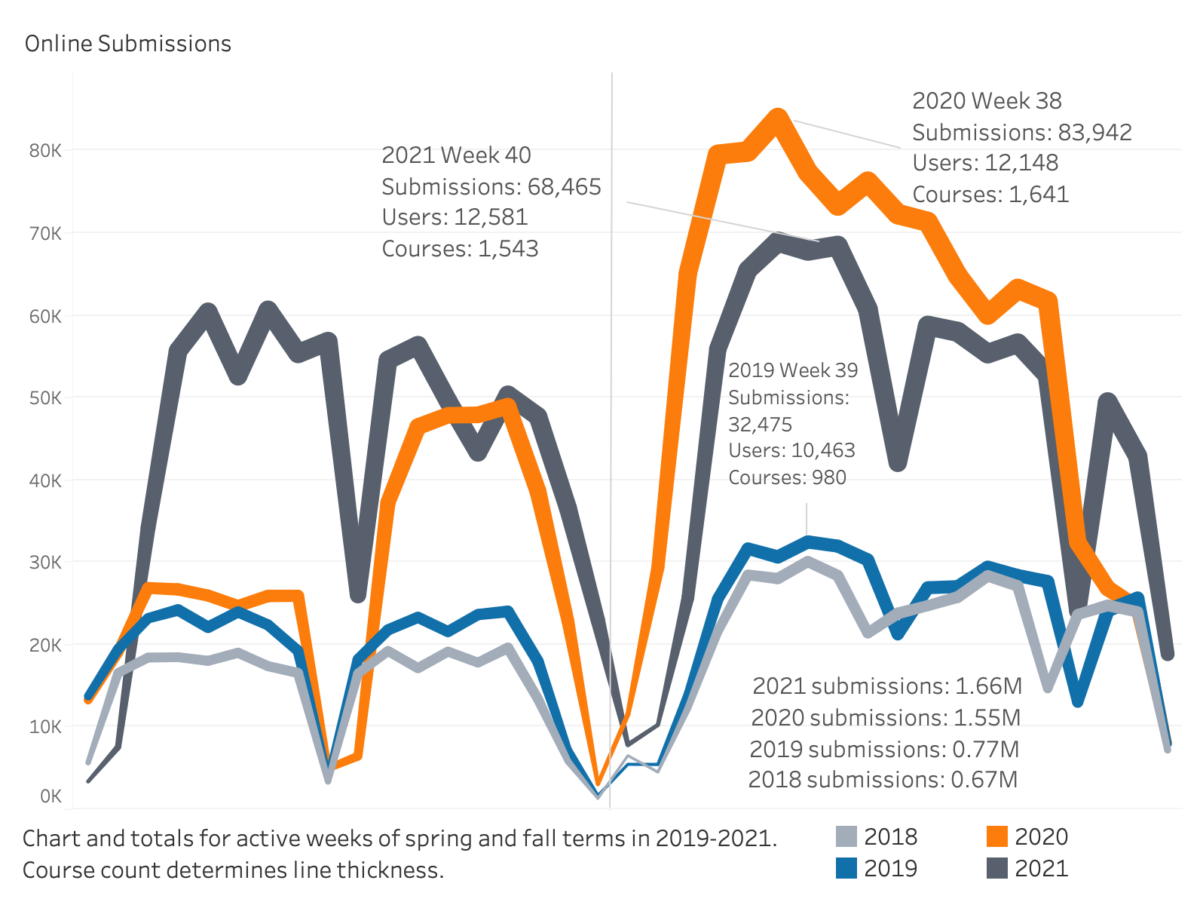
Online Submissions
Canvas records when a student submits something (file attachment, media recording, URL, external tool activity) to an assignment, posts in a graded discussion, or submits a quiz. This data is presented by week of submission. The total submissions doubled from 2019 to 2020 and even increased in 2021. From the peak week of 2019 to the peak week of 2020 the number of courses receiving online submissions increased by over 600 and submissions more than doubled.
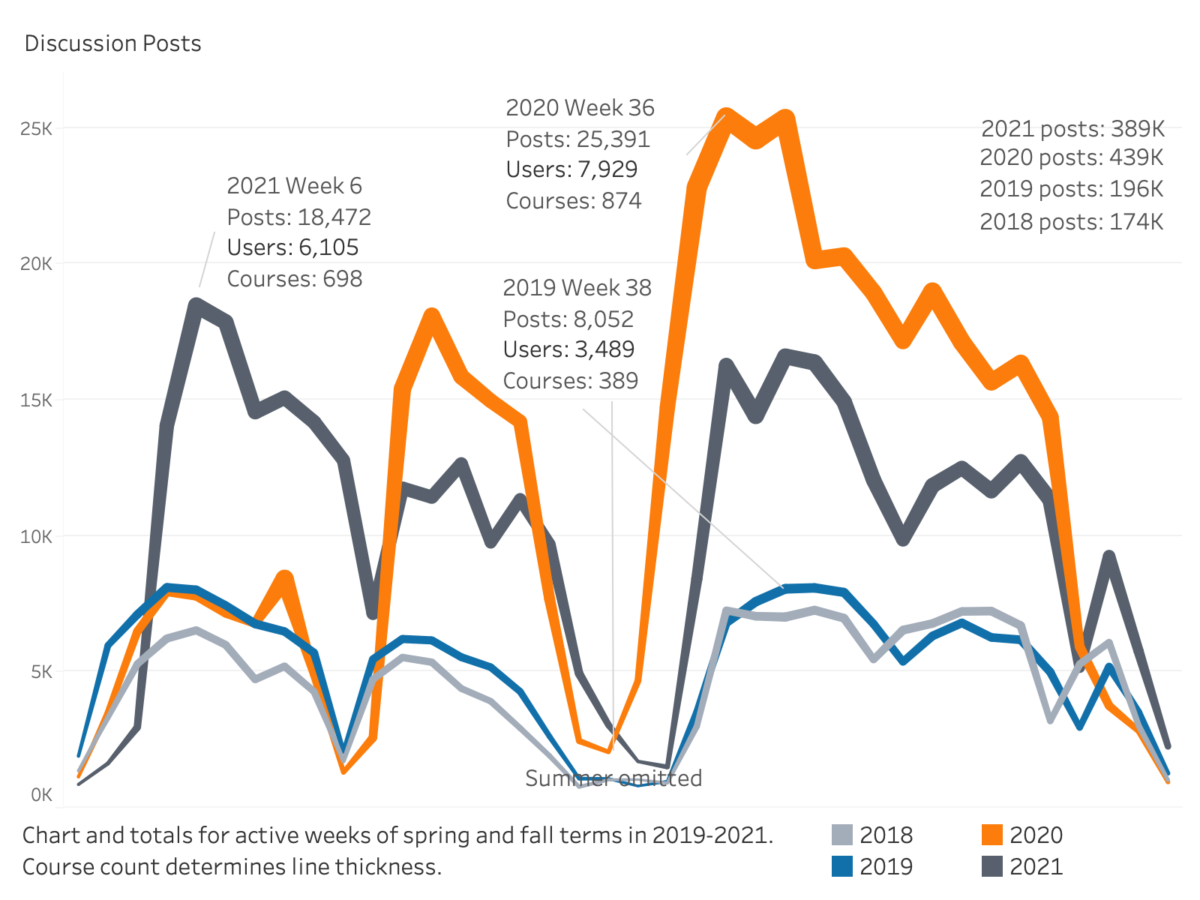
Discussion Posts
Canvas records when users post in the Discussions tool. Weekly data for posts in academic courses are shown below. Total posts more than doubled from 2019 to 2020. In 2021 the total, peak week users, and peak week courses decreased, but they remained much higher than in 2019.