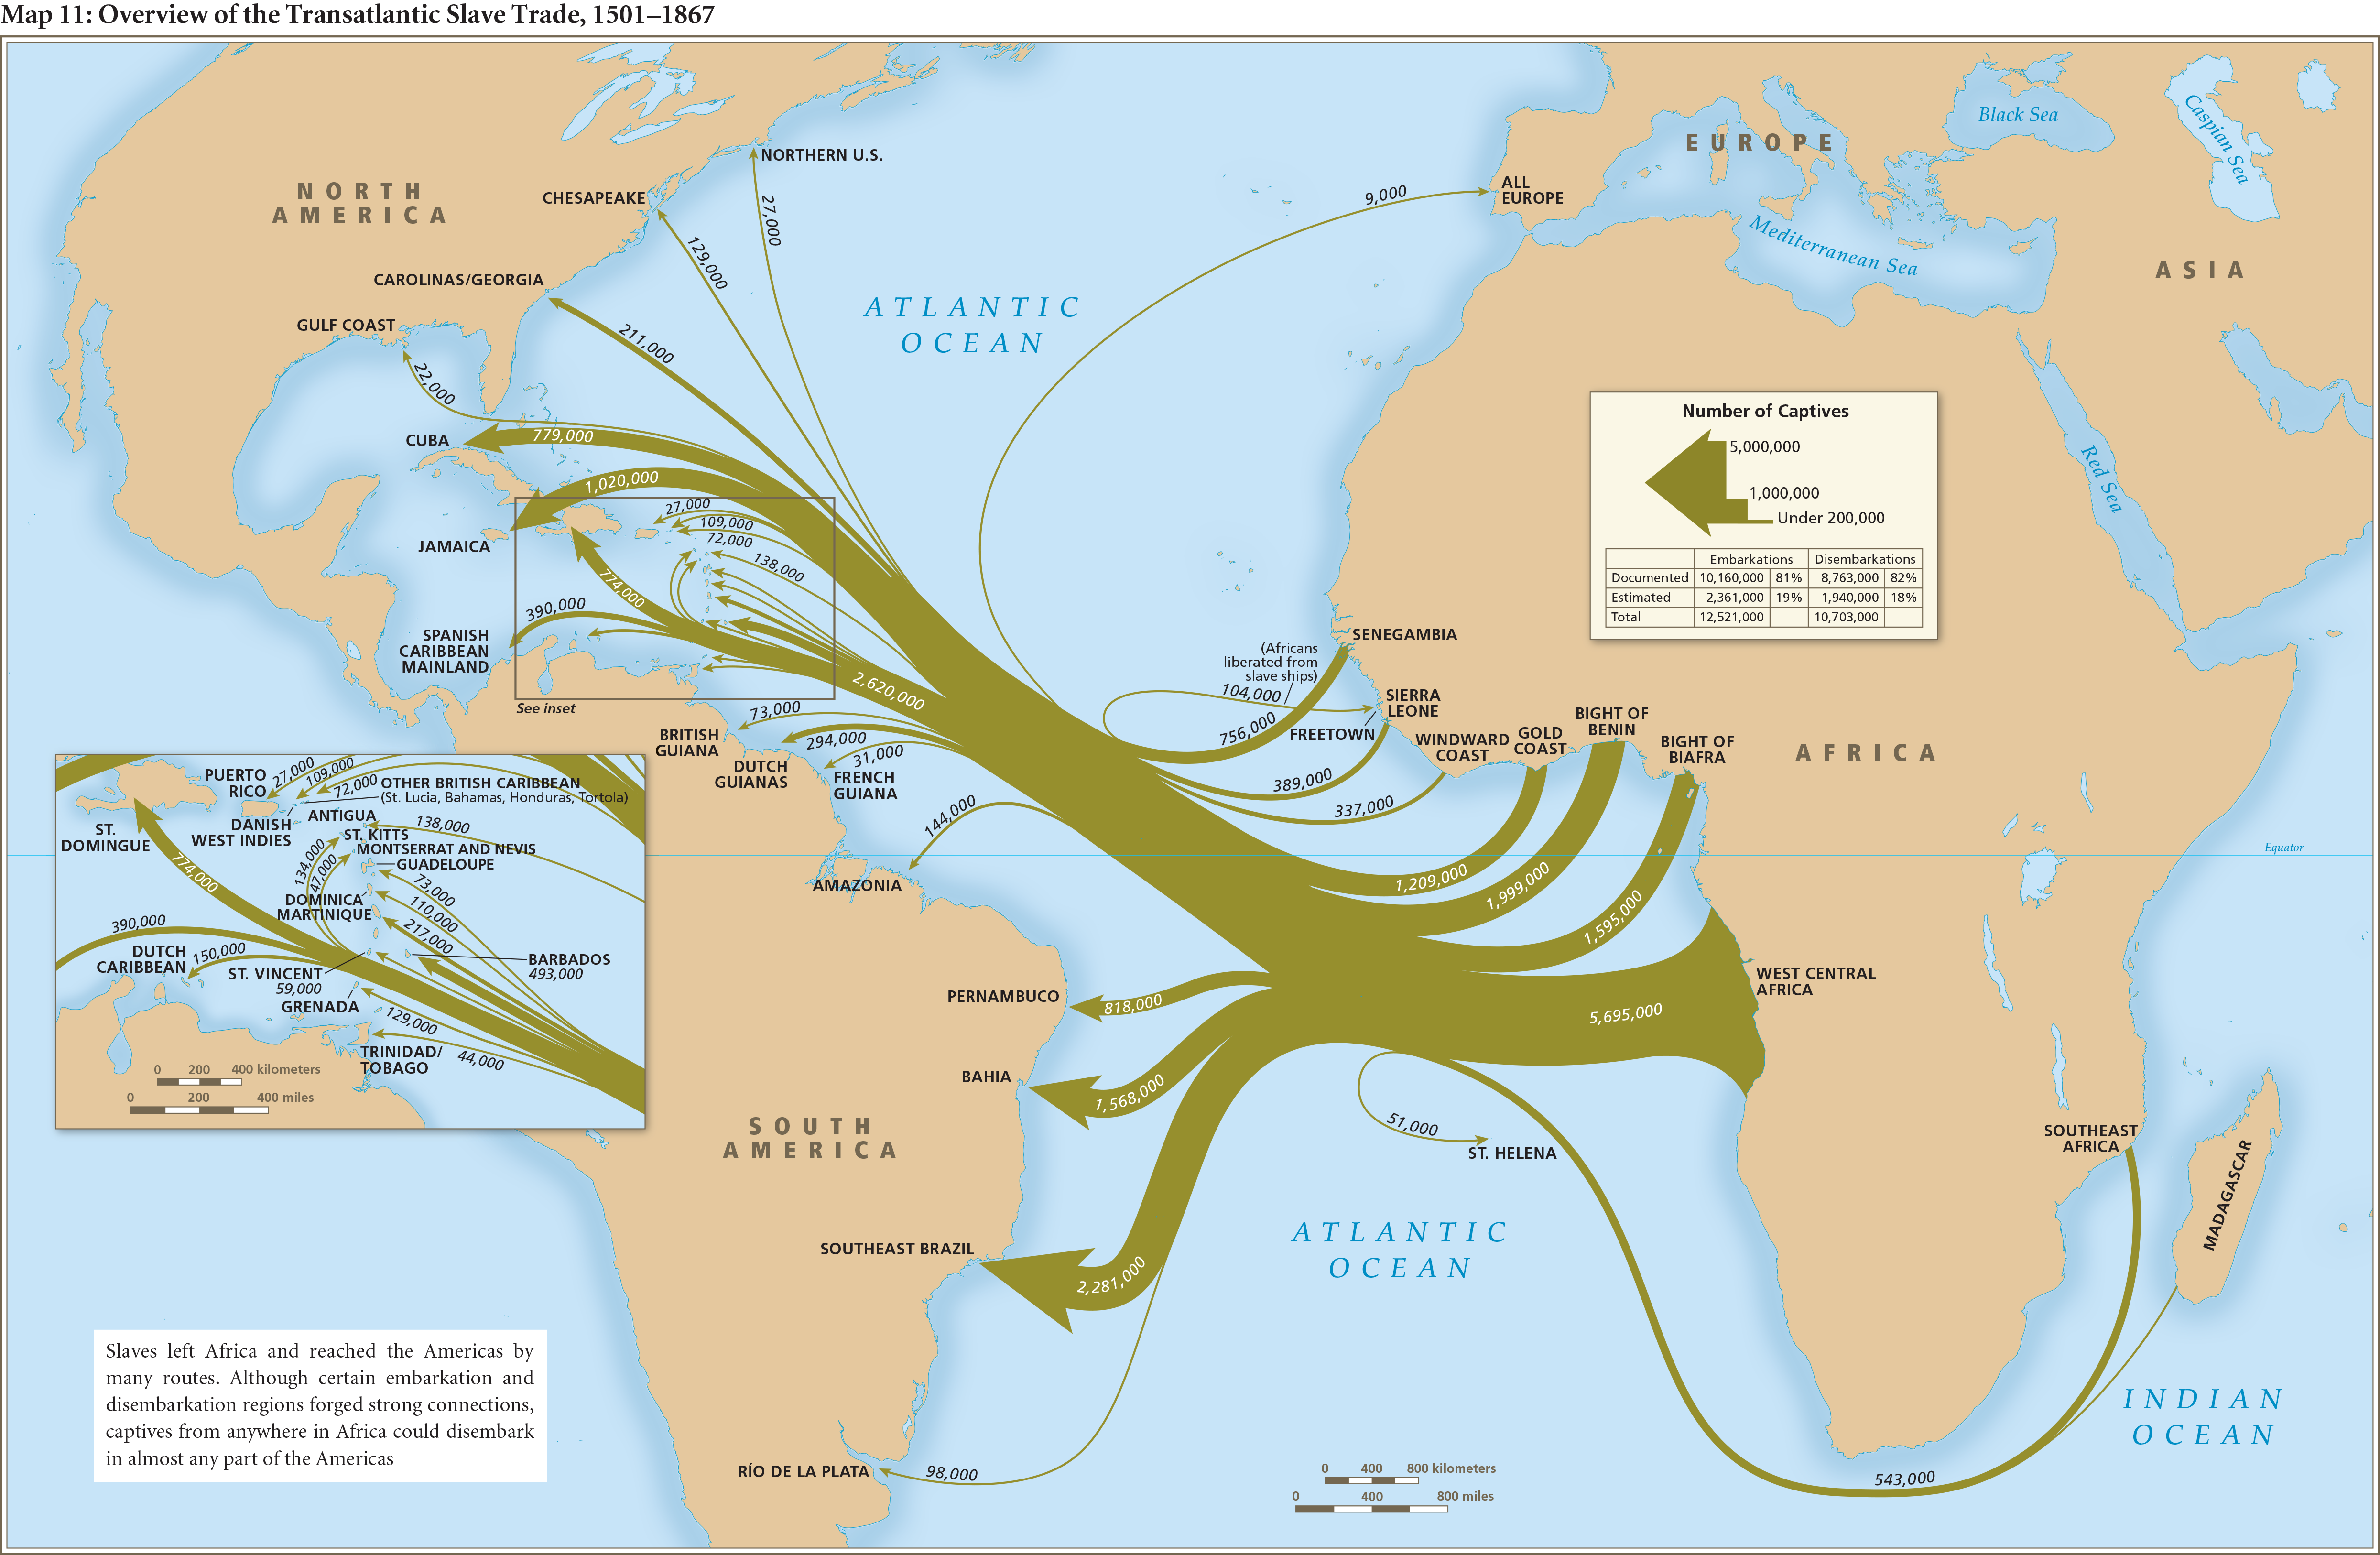
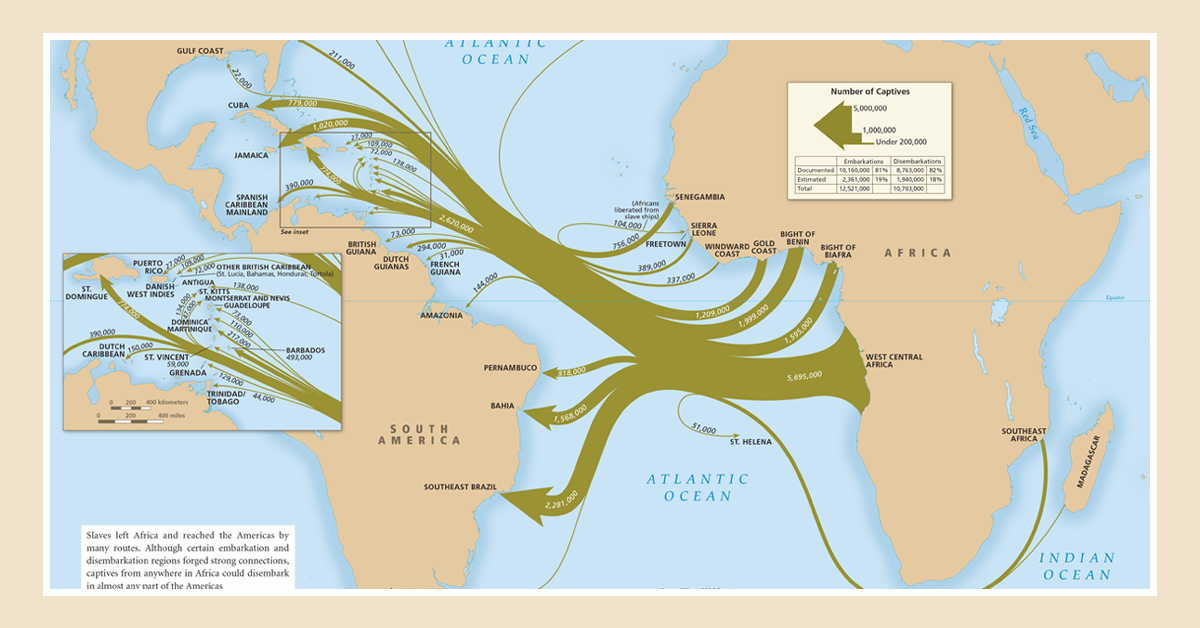
The Emory Center for Digital Scholarship (ECDS)-partnered project Slave Voyages has recently updated its Resources page with new and improved lesson plans. The Trans-Atlantic Slave Trade was the largest forced migration of people in history, which left an immense legacy (and record) of human actions, suffering, and resilience. In order to better assist educators to navigate that history, a team of teachers and curriculum developers from around the United States have provided updated lesson plans that explore the databases housed on Slave Voyages. These open educational resources allow students to engage the history and legacy of the Atlantic slave trade in diverse and meaningful ways, utilizing the various resources of the website. The lesson plans also suggest readings for more information about the Slave Trade.
- Link to Slave Voyages Lesson Plans: https://www.slavevoyages.org/resources/lessons

As the website’s homepage notes, the Trans-Atlantic Slave Trade Database now comprises 36,000 individual slaving expeditions between 1514 and 1866. Records of the voyages have been found in archives and libraries throughout the Atlantic world. They provide information about vessels, routes, and the people associated with them, both enslaved and enslavers. Users may search for information about a specific voyage or group of voyages, and the website provides full interactive capability to analyze the data and report results in the form of statistical tables, graphs, maps, a timeline, and an animation. For example, ECDS staff members helped produce a 3D reconstruction of the slave vessel L’Aurore, featured in the video, “Slave Ship in 3D Video.”
Researchers of Slave Voyages recently received an ACLS Digital Extension Grant for the Intra-American Slave Voyages Database, an important complement to the existing Trans-Atlantic Slave Voyages Database. The Intra-American Slave Trade Database contains information on approximately 10,000 slave voyages within the Americas. These voyages operated within colonial empires, across imperial boundaries, and inside the borders of nations such as the United States and Brazil. The database enables users to explore the contours of this enormous New World slave trade, which not only dispersed African survivors of the Atlantic crossing but also displaced enslaved people born in the Americas.
The website also features the African Names Database, which provides personal details of 91,491 Africans taken from captured slave ships or from African trading sites. It displays the African name, age, gender, origin, country, and places of embarkation and disembarkation of each individual.
Users of the Slave Voyages website can: analyze data; sample estimates of the slave trade; view videos, maps, and animations; consult research essays; and access lesson plans for teaching. The Resources page also includes over 200 archival images of manuscripts, places, enslaved people, and slave trade vessels. In order to present the trans-Atlantic slave trade database to a broader audience—particularly a grade 6-12 audience—a dedicated team of teachers and curriculum developers from around the United States developed lesson plans that explore the database. Each lesson plan page includes the author of the lesson plan, a grade level/range for which the lesson plan would be optimal, key words, an abstract, and a link to download the PDF.
If you use these lesson plans (or any other aspects of the Slave Voyages website) while teaching courses/conducting or publishing research, the project team would love to hear from you at: voyages [at] emory [dot] edu
