Category Archives: Uncategorized

Paris or Provence?

I somehow manage to squeeze onto the packed metro. I’m jammed in between the door and the countless people annoyedly gazing in my direction. I am overwhelmed. Right when I think this is the extent of this morning’s stimulation, the sound of accordion song busts into my ears. These chaotic metro rides were exciting during the first week or so in Paris; they were part of getting immersed in the culture! However, the honeymoon phase ended, and the metro became more stressful than exhilarating. That’s when this past weekend came to the rescue, providing a much needed break from the hectic, bustling Paris. The class took a trip to Provence, a region in southern France known for its colorful countryside, Roman architecture, and extensive art history. The difference in lifestyle was immediately noticeable. Everyone went about their day in a much more relaxed manner; there was no concept of time. This was quite the contrast from Paris, the city where everything is done in a rush. Whether you are navigating the crowded streets or shoving your way onto the metro, it seems you never get a break from the constantly accelerating Parisian lifestyle.

Cinematic shots in Avignon

Mullerthal region of Luxembourg, known for its impressive rock structures

The trip to Provence left me feeling refreshed. It was as if all the stress accumulated from the prior two weeks had been erased, and I was returning to Paris with a clear head. This made me realize how powerful the suburbs and nature can be towards influencing one’s mood. Most notably, when we visited the Pont du Gard aqueduct during the trip, the pristine, never ending river made me feel completely at peace. I couldn’t get enough, though, so I went for a hiking trip in Luxembourg this weekend and the nature had the same restorative effect. This made me question the effects of living in the city versus living in the suburbs. If just two days away from the city can be like hitting a reset button, are there permanent effects or consequences from living in one environment or the other? There have been various findings that suggest that urban living may pose a threat to our health.

At Pont Du Gard

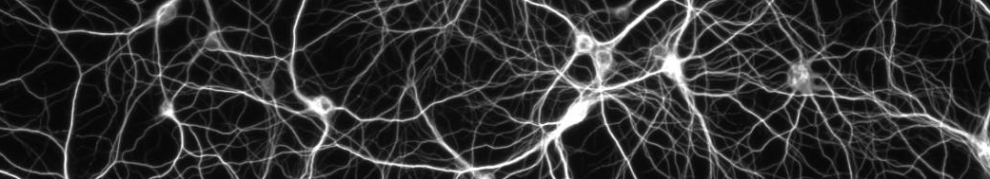
Studies suggest that we undergo neurological and behavioral changes due to living in evolutionarily unfamiliar settings (cities) (Lambert et al., 2015). Research on this topic dates all the way back to 1868, when Charles Darwin found that the brains of domesticated rabbits were smaller than those of wild rabbits (Darwin, 1868). About one hundred years later, in 1972, there was a study that compared mice brains in natural and artificial environments. The natural environment had things such as logs and tree branches, whereas the artificial environment consisted of plastic toys. Mice were allowed to live in either of these environments for four to ten weeks, and were then autopsied. The results showed that the naturally-enriched group showed higher levels of DHEA, a hormone linked with positive health influences such as more emotional resilience (Starka et al., 2014; Rosenzweig et al., 1972). There is even evidence in humans of the positive neural effects of nature and the negative effects of urban environments. For example, humans showed an increase in prefrontal cortex activity when viewing an actual plant compared to viewing an image of that same plant (Igarashi et al., 2014). Furthermore, a recent study from the UK suggests that children raised in urban environments are at an increased risk for psychotic symptoms, such as anxiety, depression, and schizophrenia (Newbury et al., 2016). These findings are theorized to be due to lower social cohesion paired with more crime victimization seen in urban neighborhoods (Newbury et al., 2016).

The various forms of pollution experienced in urban environments also have a negative influence on our overall health. Light pollution is no exception. Light exposure at night interferes with the body’s natural circadian rhythm (McClung, 2007), in turn interfering with hormone secretion and other physiological processes (Stevens et al., 2013). This can pose serious health problems. For example, a 2008 study found a strong correlation between light at night and breast cancer incidence in about 150 different communities (Kloog et al., 2008). Animal studies have shown similar results, too. A study on hamsters in which they were exposed to constant light, both at night and day, caused them to show less locomotor activity, less preference for a sucrose solution, and dampened daily cortisol rhythms compared to control mice living in an environment with a natural lighting pattern (Bedrosian et al., 2013). These symptoms are considered to be representative of depression (Bedrosian et al., 2013). Light pollution is thus another factor of urban living that may lead to diminished mental and overall health.

Image result for light pollution map

A map of the world’s light pollution

All the studies discussed above make urban living sound quite horrific, but it should be mentioned that it is difficult to draw broad conclusions from them that can be applied to our lives as humans. For example, in field studies done on humans, the samples taken usually represent small populations and it is almost impossible to control for confounding variables. In the studies done in the lab, on both humans and animals, it is impossible to recreate the environments and experiences that everyday life provides us with. This being said, these findings do still suggest that urban living could pose health concerns to us, and possibly future studies will be more conclusive.

Although city life has its perks, such as better access to health care and more job exposure, both past and recent research suggest that an occasional break from the scurry of everyday life certainly wouldn’t hurt.

Sources:

Bedrosian TA, Galan A, Vaughn CA, WeilZ M, Nelson RJ. Nocturnal light alters diurnal patterns of cortisol and clock proteins in female hamsters. J Neuroendocrinol. 25:590–0606. (2013).

Darwin C.  The variation of Animals and Plants under Domestication. 1s. London: John Murray; (1868).

Igarashi M, Song C, Ikei H, Miyazaki Y. Effect of stimulation by foliage plant display images on prefrontal cortex activity: a comparison with stimulation using actual foliage plants. J Neuroimaging. (2014).

Joanne Newbury, Louise Arseneault, 1 Avshalom Caspi, Terrie E. Moffitt, Candice L. Odgers, and Helen L. Fisher. Why Are Children in Urban Neighborhoods at Increased Risk for Psychotic Symptoms? Findings From a UK Longitudinal Cohort Study. Schizophr Bull. 42(6): 1372–1383. (2016).

Kelly G. Lambert, Randy J. Nelson, Tanja Jovanovic, and  Magdalena Cerdá. Brains in the City: Neurobiological effects of urbanization. Neurosci Biobehav Rev. 58, 107-122. (2015).

Kloog I, Haim A, Stevens RG, Barachana M, Portnov BA. Light at night co-distributes with incident breast but not lung cancer in the female population of Israel. Chronobiol Int. 25:65–81. (2008).

McClung CA. Circadian genes, rhythms and the biology of mood disorders. Pharmacol Ther. 11:222–232. (2007).

Rosenzweig MH, Bennett EI, Diamond MC. Brain changes in response to experience. Scientific American February. 22–30. (1972).

Starka L, Duskova M, Hill M. Dehydroepiandrosterone: a neuroactive steroid. J Steroid Biochem Molecul Biol. (2014).

Stevens RG, Brainard GC, Blask DE, Lockley SW, Motta ME. Adverse health effects of nighttime lighting: comments on American Medical Association policy statement. Am J Prev Med. 45:343–346. (2013).

Image: https://brilliantmaps.com/light-pollution/

USA! USA! USA!

The World Cup.  These three words are arguably the most popular in the world – well, maybe it’s “I love you”, but “The World Cup” is probably a close second.  Every four years, the most elite national soccer teams assemble to partake in a tournament viewed by billions worldwide.  It’s an event of immense magnitude, immeasurable spectacle, and the highest stakes in sports.  This year, the FIFA Women’s World Cup is being hosted by France, with multiple games in Paris!  Seeing as I live in the United States, where we haven’t yet fully embraced the beautiful game, it is a rare occurrence to attend high level soccer matches; so, a few days ago, when our class had the unbelievable experience of attending a group-stage match in the 2019 Women’s World Cup between the United States of America and Chile, I was over-the-moon excited.

Faces painted, ready for the game!!

The game did not disappoint, the United States dominated Chile, especially in the first half where they scored three goals, including a super-strike from veteran Carli Lloyd.  However, despite the beat down imposed upon the Chileans, the atmosphere remained lively.  Thunderous chants of “Chi-Chi-Chi Le-Le-Le, ¡Viva Chile!” clashed with shouts of “USA! USA! USA!” for the entire 90 minutes, and with every goal scored by the United States women, the thrill of ensuing victory became more intensely expressed on the players’ faces.

Amazing view to watch the United States take on Chile in the 2019 FIFA Women’s World Cup

While the triumphant screams, hugs between teammates, and big smiles made their emotions evident on the surface, a more complicated biological phenomenon was occurring inside the bodies of the athletes.  In a recent study published in 2015, Drs. Kathleen Casto and David Edwards examined how levels of certain hormones fluctuated during different stages of competition in female soccer players (Casto and Edward, 2015).  Competition, at its heart, is a contest for social status driven by a desire to be superior to an opponent (Casto and Edwards, 2015).  This desire seems to be heavily linked with the neuroendocrine system – a physiological system in which the central nervous system regulates hormone production (Martin, 2001) –  and with three hormones in particular: testosterone, cortisol, and estradiol (Casto and Edward, 2015).  Both testosterone (Carré and Olmstead, 2015) and estradiol (Stanton and Schultheiss, 2007) are related with dominance motivation and aggressive behavior, while cortisol is related with stress (Dickerson and Kemeny, 2004).

This study, conducted by Emory University researchers, analyzed salivary levels of testosterone, cortisol, and estradiol from the Emory University varsity women’s soccer team in five conditions: a baseline condition (three days before a match), before warming up for a match, shortly before the beginning of the match, immediately after the match, and 30 minutes after the match (Casto and Edwards, 2015).  In addition to comparing hormone levels during different parts of the match, levels during both a home game and an away game were analyzed to investigate whether playing in front of an opposing crowd influenced hormone levels (Casto and Edwards, 2015).

A figure depicting the change in hormone levels during different stages of a soccer match (Casto and Edwards, 2016)

When analyzing testosterone levels, the researchers found no significant difference between the athlete’s baseline levels and their levels before warming up (Casto and Edwards, 2015).  However, testosterone levels after completing a warm-up rose 22% from levels before the warm-up (p<0.001) during a home game and 32% (p<0.001) during an away game (Casto and Edwards, 2015).  Immediately following the conclusion of the game, testosterone levels were 19% (p=0.046) higher than during warm-ups at a home game and 18% (p=0.003) higher during an away game (Casto and Edwards, 2015).  30 minutes after the game’s conclusion, testosterone levels dropped 16% for a home game (p<0.001) and 26% for an away game(p<0.001) (Casto and Edwards, 2015).

Like testosterone levels, cortisol levels also displayed variation during different stages of competition.  However, whereas testosterone levels continuously rose from before a warm-up to immediately after competition, cortisol levels were significantly elevated prior to warming up but did not significantly change after a warm-up (Casto and Edwards, 2015).  Cortisol levels peaked immediately after the end of the match, where they were elevated 142% (p=0.001) after a warm-up during a home game and 131% after an away game (p=0.002) (Casto and Edwards, 2015).  30 minutes after a match’s end there were no significant changes in cortisol levels (Casto and Edwards, 2015).  I, for one, find this cortisol data especially surprising because, when I used to play sports, I remember feeling the most stressed immediately before a game, not during it, and, as cortisol is a stress hormone, I would have expected cortisol levels to be at their peak immediately preceding a game.  Estradiol also fluctuated throughout stages of competition, as its levels significantly increased both before and during a warmup (Casto and Edwards, 2015).  However, immediately after competition, estradiol levels significantly decreased and did not show any significant changes 30 minutes after the game (Casto and Edwards, 2015).

Interestingly, when this study statistically compared hormone levels during a home game to those during an away game, there were no statistical differences (Casto and Edwards, 2015).  Maybe home-field advantage is not that big of a deal after all.  Perhaps most surprising to me about this study though, was that the data did not show any significant differences in hormone levels when either winning or losing (Casto and Edwards, 2015).  Another measurement I think the study could have taken for a potentially more in-depth analysis is hormone levels at half-time.  At half-time, players can rest for a few minutes to catch their breath, but, while resting, are getting coached by the manager to make adjustments in preparation for the second half.  Even though the players’ bodies are resting, their brains are still working hard in anticipation of the rest of the game, so it would be pertinent to study hormone levels at half-time.

Ultimately, the research by Casto and Edwards brings to light some fascinating and surprising conclusions about the neuroendocrine system’s activity during physical competition.  Now that I’ve learned a bit more about hormone fluctuation in athletes, I wonder how hormone levels in fans, such as myself, would change while watching a match.


______________________________________________________

References

Carré, J., & Olmstead, N. (2015). Social neuroendocrinology of human aggression: Examining the role of competition-induced testosterone dynamics. Neuroscience, 286, 171-186. doi:10.1016/j.neuroscience.2014.11.029

Casto, K. V., & Edwards, D. A. (2015). Before, During, and After: How Phases of Competition Differentially Affect Testosterone, Cortisol, and Estradiol Levels in Women Athletes. Adaptive Human Behavior and Physiology, 2(1), 11-25. doi:10.1007/s40750-015-0028-2

Martin, J. V. (2001). Neuroendocrinology. In N. J. Smelser & P. B. Baltes (Eds.), International encyclopedia of the social and behavioral sciences (pp. 10585-10588). Retrieved from https://doi.org/10.1016/B0-08-043076-7/03420-3

Stanton, S. J., & Schultheiss, O. C. (2007). Basal and dynamic relationships between implicit power motivation and estradiol in women. Hormones and Behavior, 52(5), 571-580. doi:10.1016/j.yhbeh.2007.07.002


OMG, More Stairs?!?

When I came to Paris, I thought I was prepared for everything: the bakeries, the museums, the landmarks, the culture — but nothing could have prepared me for the walking I was about to do. Unlike the suburban areas around Emory or my hometown of Topeka, Kansas, where a car is considered necessary for most outings, the streets of Paris are easily traversable by foot, and public transportation is much more accessible. And in a city so beautiful, I had a hard time refusing the ease of foot travel. Still, with the recent muggy weather, walking hasn’t felt quite as pleasant. People always say “no pain, no gain,” and I began to wonder what all my walking was doing for me brain-wise.

My steps before and after I came to Paris. As one can see, my steps significantly increased after I came to Paris, May 22th.

Turns out, there’s a lot to be gained from regular aerobic exercise. Consistent research has pointed to the role of physical activity in cognitive function and has grown in volume over the past decade (Soga et al., 2015). General movement has been suggested to contribute to brain plasticity, which in turn facilitates interaction between cognitive and motor functioning (Doyon and Benali, 2005). Furthermore, research has also linked physical activity to academic performance (Castelli et al., 2007). While these results doesn’t necessarily mean that taking up routine walking or running will guarantee better grades or memory, the two do seem to be invariably related.

Amidst this burgeoning research, Colcombe and colleagues decided to research the cortical mechanisms beneath cardiovascular fitness-related changes in cognitive function (Colcombe et al., 2004). Functional magnetic resonance imaging (fMRI) was used to study how changes in fitness might affect the brain. Researchers particularly focused on the anterior circular cingulate (ACC), an area of the limbic system linked to brain structures responsible for sensory, motor, emotional, and cognitive information (Bush et al., 2000).

The study took place in 2 segments, with Study 1 involving high-fit (HF) older adults, and Study 2 involving adults randomly assigned to either a cardiovascular fitness training (CFT) group or a stretching and toning group (control) (Colcombe et al., 2004). All participants in both groups underwent a flanker task in which they filtered and identified incongruent cues (Colcombe et al., 2004). The flanker test allowed researchers to study participants’ ability to filter and respond to relevant information (Colcombe et al., 2004). Researchers then compared cortical mechanisms triggered by incongruent clues to those triggered by congruent ones, to see whether HF adults would demonstrate higher activation in attention- and control-related regions (Colcombe et al., 2004).

fMRI scans of the ACC illustrate activation of different cortical areas in the task-related activity (Colcombe et al., 2004).

Sure enough, fMRI scans supported the study’s hypothesis that older adults with high levels of measured cardiovascular fitness would demonstrate significantly more activation in cortical regions linked with attention selection and control (Colcombe et al., 2004). These cortical regions include the medial frontal gyrus (MFG), superior frontal gyrus (SFG), and superior parietal lobe (SPL) (Colcombe et al., 2004). Significantly less activation was observed in the ACC, which is linked with behavioral conflict and adaptation of attentional control (Colcombe et al., 2004).

One weakness of the study by Colcombe and colleagues is the cross-sectional approach taken in Study 1. Being observational, cross-sectional studies are vulnerable to non-response bias, which can lead to a participant pool unrepresentative of the population (Sedgwick, 2014). Furthermore, data can only be collected during one set period of time, leaving researchers unable to create long-term representations of cause and effect (Sedgwick, 2014). However, it is important to note that longitudinal studies might also be difficult to complete with older participants, due to possible interference from disease or other age-related complications (Sedgwick, 2014). Ultimately, the research by Colcombe and colleagues was important at the time of its publication because it expanded upon existing research regarding the underlying cortical mechanisms of cardiovascular fitness.

More recent research by Brockett and colleagues suggests that physical exercise may contribute to extensive plasticity and increased cognitive functioning (Brockett et al., 2015). Rats who ran for moderate durations of 12 days were able to better discriminate than control rats in a task testing medial prefrontal cortex (mPFC) function, though little difference was seen between both groups in a task testing perirhinal cortex (PRC) function (Brockett et al., 2015). In a second experiment, runner rats took less trials and errors than control sedentary rats to reach criteria for simple discrimination, reversal, extradimensional shift (Brockett et al., 2015). Researchers also tested whether running influences astrocytes, non-neural brain cells that communicate with neurons and suggest links to synaptic plasticity, learning, and memory (Brockett et al., 2015). Co-labelling of astrocytes with visual markers revealed increase in astrocytes cell body area in the hippocampus, mPFC, and OFC (Brockett et al., 2015). These results aligned with data from the behavioral tests, suggesting that physical exercise can enhance cognitive performance in tasks that activate the hippocampus, mPFC, and OFC (Brockett et al., 2015). The lack of significant change to the PRC suggests that routine running lacks observable relation to the PRC. Ultimately, results suggest greater cognitive performance in tasks reliant on the prefrontal cortex, as well as enhanced synaptic, dendritic, and astrocytic measures in several regions. This evidence supports the hypothesis that physical exercise contributes positively to plasticity and cognitive functioning. Together, both papers by Colcombe, Brockett, and their colleagues have contributed to the growing understanding that exercise generally promotes greater cognitive functioning.

Brockett and colleagues’ research has made me wonder how much I would have to run to achieve the human equivalent of a rat’s 12-day regimen. As a student, it’s incredibly easy to get sucked into the grind and become deskbound. But the grind is exactly why brain power is important for the students, and optimizing my brain power in exchange for a few minutes and some physical effort has started to sound like a much better idea than the old me would have thought.

References

Brockett AT, LaMarca EA, Gould E (2015) Physical exercise enhances cognitive flexibility as well as astrocytic and synaptic markers in the medial prefrontal cortex. Public Library of Science ONE 10(5): e0124859. https://doi.org/10.1371/journal.pone.0124859.

Bush G, Luu P, Posner MI (2000) Cognitive and emotional influences in anterior cingulate cortex. Trends in Cognitive Sciences. 4(6):215-222. https://doi.org/10.1016/S1364 6613(00)01483-2.

Castelli DM, Hillman CH, Buck SM, Erwin HE (2007) Physical fitness and academic achievement in third- and fifth-grade students. Journal of Sport and Exercise Psychology 29(2):239-252. https://doi.org/10.1123/jsep.29.2.239.

Colcombe SJ, Kramer AF, Erickson KI, Scalf  P, McAuley E, Cohen NJ, Webb A, Jerome GJ, Marquez DX, Elavsky S (2004) Cardiovascular fitness, cortical plasticity, and aging. Proceedings of the National Academy of Sciences of the United States of America            101(9):3316-3321. https://doi.org/10.1073/pnas.0400266101.

Doyon J, Benali H (2005) Reorganization and plasticity in the adult brain during learning of motor skills. Current Opinion in Neurobiology 15(2):161-167. https://doi.org/10.1016/j.conb.2005.03.004.

Sedgwick P (2014) Cross sectional studies: Advantages and disadvantages. BMJ 348. https://doi.org/10.1136/bmj.g2276.

Soga K, Shishido T, Nagatomi R (2015) Executive function during and after acute moderate aerobic exercise in adolescents. Psychology of Sport and Exercise 16:7-17. https://doi.org/10.1016/j.psychsport.2014.08.010.

Image 1 taken by myself.

Image 2 from Colcombe et al., 2004.

Memories sparked by music

As I was exploring the Electro exhibition at the Philharmonie de Paris, I was in awe of the transformation of electronic dance music over time. I did not know what to expect when I walked through those doors. Although I have recently been exposed to what goes into making a beat, I was truly amazed at the amount of detail and planning that needs to happen in order to create a harmonious sound. However, I don’t listen to electronic music all that often, and I was shocked at how much I was enjoying the exhibit. I realized that some of my favorite memories have been attached to songs and when I hear them, that rush of emotions comes back. I feel like I am reliving some of the best nights. Music has the power to move me emotionally and helps me remember experiences I wouldn’t always remember otherwise. I am always amazed with how much one song can mean to me, not because of the words but because of what memories are associated with it.

Part of the Electro exhibition

As I was walking through the Electro exhibition, I was reminded of some of my favorite nights listening to my friend make music, and it took me back to a time of such happiness. There have been studies conducted that conclude that music is strongly interconnected with memories (Belfi et al, 2015). In one study, participants heard 30 different songs and saw 30 different faces of famous people. The researchers were looking to measure the strength of memories evoked listening to the songs compared to looking at the faces. They found that the participants had stronger memory association for details and specific autobiographical information when listening to the songs (Belfi et al, 2015).  However, the researchers used a self-evaluation survey to rate the strength of autobiographical memory evoked by each stimulus. This recording strategy may have resulted in a bias or inaccurate association. This study helps us understand that it is possible for music to activate memories with greater specificity. The music in the exhibition had a similar effect on me as well. I was able to remember feeling happy and at peace  while sitting in my friend’s apartment listening to electronic music.

The same feeling of happiness and serenity may be triggered years from now by hearing the same kind of music. This phenomenon could be applied to help patients struggling with Alzheimer’s because music has also been shown to enhance memory in these patients (Cuddy and Duffin, 2005). Researchers wanted to test to see if listening to music helped patients learn and recognize new information (Simmons-Stern, 2010). By pairing unknown lyrics with sung or spoken recordings, the researchers measured which modality was easier to remember for these patients (Simmons-Stern, 2010). They found that after showing the song and the spoken word, the patients with Alzheimer’s disease recognized more words in the sung recordings rather than the spoken word as shown in the figure below (Simmons-Stern, 2010). Healthy patients did not have a preference between modality. To strengthen their conclusion, the researchers made sure to leave out any songs the subjects recognized prior to the study. This study helped demonstrate that there is a possibility of heightening arousal and memory for patients with Alzheimer’s disease through the use of music. Heightened memory may describe why listening to the specific music in the exhibit triggered happiness and peace for me.

The Recognition of Song vs. Spoken Lyric for AD and Control Patients

Stimulation in Electro Exhibit where you could make your own beat

Throughout the Electro exhibition, I was impressed with the way the sound made me feel. Even though I was just listening to the beat, I felt so at home in that space. I was truly impressed with how quickly I was able to transport myself to a different moment. As I walked to the part of the exhibit that let me manipulate instruments to make my own beat, I felt so happy, and I realize now that it’s because the music evoked a memory of my best friend teaching me to do the same thing on his computer. The comfort and happiness of that moment flooded me because the music I was listening triggered an emotional memory.

References:

Belfi AM, Karlan B, Tranel D (2015) Music evokes vivid autobiographical memories. Memory24:979–989.

Cuddy LL, Duffin J (2005) Music, memory, and Alzheimer’s disease: is music recognition spared in dementia, and how can it be assessed? Medical Hypotheses64:229–235.

Simmons-Stern NR, Budson AE, Ally BA (2010) Music as a memory enhancer in patients with Alzheimer’s disease. Neuropsychologia48:3164–3167.

Photo of Study:

Simmons-Stern NR, Budson AE, Ally BA (2010) Music as a memory enhancer in patients with Alzheimer’s disease. Neuropsychologia48:3164–3167.


(Motion) Sick Ride, Dude


Bonjour tout le monde! (Hello everyone!) I am writing this blog post on the train to Amsterdam. I absolutely love how easy it is to travel throughout Europe. There are so many cities in other parts of France and different countries that are just a short train ride away. For the most part, it is also pretty affordable! So far I have been to Brussels, south France, and now I am heading to Amsterdam.

A view from the train on the way to Amsterdam

Hi again everyone. Now I am writing from Amsterdam. I started to write on the train as you see above, but got motion sick within the first few minutes. So, I stopped and this is my second attempt at writing (not on public transportation). I attribute the very quick on-set of motion sickness to looking out the window at the beautiful scenery, while still trying to type on my computer. In hindsight, that was probably not a great idea. Although it gave me an idea of what to write about for this post! As much as I love the ability to travel by train, I have noticed that I have to be really careful to avoid motion sickness.

Buildings on a canal in Amsterdam

Motion sickness includes symptoms such as dizziness, nausea, tiredness, sweating and headaches (“Motion Sickness”, 2014) But what is the cause of motion sickness? There is a region thought to be connected to motion sickness called the vestibular system (Oman, 1990). The vestibular system is found within your inner ear, and is involved in unconscious perception of head motion. It also is important for orienting yourself in space and navigating your environment (Angelaki and Cullen, 2008).

The Vestibular System within the ear, it is located right above the structures involved in hearing.

The dominating theory for the cause of motion sickness, sensory conflict theory, states that information from the vestibular system and information from our eyes conflict with each other (Warwick-Evans et al., 1998). For example, on the train my vestibular system assumed I was not moving because I was sitting still, but my eyes saw that the landscape was moving. Warick-Evans and colleagues tested this theory by using two levels of conflicting information and then measuring the level of motion sickness. They found that when there is more conflict between the apparent motion of our head and the apparent motion our eyes are seeing, then there is a greater degree of motion sickness (Warwick-Evans et al., 1998). So, when my vestibular sense tells me I am still, but my vision says I am moving, my brain can’t reconcile the information.

Your eye and vestibular system give conflicting information to your brain, leading to motion sickness.

More recent studies have expanded on sensory conflict theory, adding to our understanding of how motion sickness is caused. One study by Tal and colleagues (2014) tested whether motion sickness could be due to the unfamiliar patterns of motion we are experiencing. In other words, our brain knows which visual information for motion matches with vestibular information from past experiences. The brain then compares new motion experiences to that information. If the new information doesn’t match the old experience, it leads to motion sickness (Tal et al., 2014). This supports sensory conflict, since our brain understands that the visual and vestibular information do not match. But it also adds an extra component: our previous experiences allows us to recognize the conflict. This is supported by the fact that the hippocampus, a region in the brain important for memory (including spatial memory), was found to be important in processing sensory conflict information. (Zhang et al., 2016). This supports that our memory of different spatial orientations or visual information impacts the response to sensory conflict, leading to motion sickness.

One issue with these studies is that motion sickness is currently only measured by a questionnaire. People are giving subjective responses on how bad their motion sickness is. With subjective responses, it is difficult to guarantee that people will consistently respond on the same scale as each other. One person may rank their motion sickness as much worse than another, even though they are having very similar symptoms. Something that could be done in future research could be physiological tests (possibly looking at balance and sweat levels) to see if the body is actually responding with symptoms of motion sickness.

The Motion Sickness Susceptibility Questionnaire, used in both Tal et Al. and Warnick-Evans et. Al studies.

Unfortunately, my motion sickness happens on the train, the metro and even sometimes in the car. Although, I don’t seem to notice it as much when I am in a plane or on a spinning ride in a park. There is a lot more I would be interested in knowing about motion sickness. Are some modes of transportation or movement more likely to induce motion sickness? Why do I get more sick when I am directly in the sun and not so much when there is sufficient AC? Also, there is little research on why some people are more susceptible to motion sickness than others.

I would love to see more research done on all of these topics. But for now, I will work on not overloading my senses in order to avoid feeling sick. But you can bet I will keep traveling either way. Motion sickness can’t stop me!


References:

Angelaki, D. E., & Cullen, K. E. (2008). Vestibular System: The Many Facets of a Multimodal Sense. Annual Review of Neuroscience,31(1), 125-150.

Motion sickness. (2014, November 30). Retrieved from https://www.betterhealth.vic.gov.au/health/healthyliving/motion-sickness

Oman, C. M. (1990). Motion sickness: A synthesis and evaluation of the sensory conflict theory. Canadian Journal of Physiology and Pharmacology,68(2), 294-303.

Tal, D., Wiener, G., & Shupak, A. (2014). Mal de debarquement, motion sickness and the effect of an artificial horizon. Journal of Vestibular Research,23, 17-23.

Warwick-Evans, L., Symons, N., Fitch, T., & Burrows, L. (1998). Evaluating sensory conflict and postural instability. theories of motion sickness. Brain Research Bulletin,47(5), 465-469.

Zhang, L., Wang, J., Qi, R., Pan, L., Li, M., & Cai, Y. (2016). Motion Sickness: Current Knowledge and Recent Advance. CNS Neuroscience & Therapeutics,22(1), 15-24.

Image 1 and 2: My own images

Image 3:

How our Vestibular System works and why this is important for learning. (2019, April 04). Retrieved from https://www.griffinot.com/vestibular-system/

Image 4:

Horsky, J. (2017, December 14). Understanding VR sickness. Retrieved from https://blog.infinite.cz/understanding-vr-sickness-2404e3aae6ee

Image 5:

Golding, J., Gresty, M., & Bronstein, A. (2013). Vertigo and Dizziness from Environmental Motion: Visual Vertigo, Motion Sickness, and Drivers Disorientation. Seminars in Neurology,33(03), 219-230.

Catching the Blues

Known for having the largest collection of impressionist and post-impressionist paintings, the Musee d’Orsay gave us an opportunity to view the impressionist paintings we had read so much about in class in person. The museum was filled with statues, furniture (?) and more paintings than I could count.

Including this masterpiece, which is one of my favorite paintings.

The moment I entered the museum, I headed straight for those famous impressionist paintings. Rows upon rows of paintings filled the gallery as I joined the people milling by. Not wanting to get too close to the crowd around the paintings, I initially decided to look casually at the beautiful scenery of landscapes or normal people out for an afternoon walk. I found myself being drawn to some of Monet’s works; his paintings all seemed to share a common theme of loose, delicate brushstrokes and unsaturated, pastel colors.

Le Givre (1880)

Tempest, the Coast of Belle-Île (1886)

Woman with Parasol (facing left) (1886)

I enjoyed looking at them because it gave me such a sense of calmness, as I let my eyes take in the subtle flecks of colors and light. Soon, one among them in particular caught my eye.

Camille Monet sur son lit de mort 1879)

Monet’s 1879 painting, Camille sur son lit de Mort, or Camille on her Deathbed, gives the audience a sense of Monet’s melancholy emotions for the death of his wife. The brushstrokes used for both these paintings all work together in harmony, in one given direction, to draw the viewer’s gaze down and to the right. When viewing this painting, I also noticed myself subconsciously tilting my head a little bit to my right, contemplatively. The features of his wife can be made out and seems at peace—almost as if she was asleep, as the cliché goes—but when looking at the lights and colors in the painting I was suddenly brought to mind of feelings of not only serenity, but also a deep sadness as it brought to mind a memory of one of my close relatives who had recently passed away as well before this trip. One could say that it was the similar situations of the subjects of the painting that triggered my own memory, but I was feeling a certain weight and despondency even before I knew what the painting was of—I felt that something about the mood that the painting evoked with its colors and textures was able to influence my own emotions and memory.

Emotion has been widely known to be influenced by color, and this concept has been applied to various studies. For example, color cues can affect the chemosensory perception of foods and drinks we consume, through an implicit connection with emotion. Gilbert et al found that people have “pre-existing expectations” regarding what their food and drinks should look and taste like, and that this expectation is modulated by how the color or appearance of these foods makes them feel (2016). In a study closer to home, it was shown that different colors in learning environments could also influence student moods and subsequently their learning performance. As expected, paler colors and colors towards the bluer end of the spectrum increased the students’ feelings of relaxation and positivity. However, they also found that more vivid colors such as red and yellow increased heart rate and helped to focus attention, resulting in higher comprehension test scores (Al-Ayash et al, 2015).

A recent study by Lisa Wilms and Daniel Oberfield published in 2017 expanded on that study, looking at how all the perceptual dimensions of color (hue, saturation and brightness) could also lead to changes in an individual’s emotional state, as measured by arousal and valence.

Valence/Arousal Model

They found that bright, saturated colors induced higher arousal (as measured by heart rate and skin conductance) and valence (associated positive feelings) in the viewers, especially colors closer to red on the color spectrum compared to blue or green. In addition, achromatic colors such as white, grey, and black, caused a short-term decrease in heart rate, and vice versa for the chromatic colors. This was the first study that not only considered the actual hue of the colors, but also how the saturation and brightness of the colors interacted to produce a more nuanced response (Wilms and Oberfield, 2017). This was significant especially in terms of Monet, as he tended to use many different colors—his color palette was in no way wholly monochromatic, if you look closely—but the colors were very unsaturated and more muted. He also used a lot of achromatic colors, especially white and grey. According to Willms, both of these factors would have caused the viewer to feel lower valence (less pleasurable emotions) and more calm, which could have led to what I was feeling that day when viewing that painting.


References:

Al-Ayash A., Kane R.T., Smith D., Green-Armytage P. (2015). The influence of color on student emotion, heart rate, and performance in learning environments. Color Research and Application. 41:196-205.

Gilbert A.N., Fridlund A.J., Lucchina L.A. (2016). The color of emotion: a metric for implicit color associations. Food Quality and Preference. 52:203-210.

Wilms, L. & Oberfeld, D. (2018). Color and emotion: effects of hue, saturation, and brightness. Psychological Research. 82: 896.

All images taken by me; June 2019.

Please don’t yell at me, I don’t understand

A couple days before I left for Paris, I started a new show called “The Good Place” (and finished about one season a day, but that’s not relevant to this blog post and I’m not proud of it). The premise of the show is that people who lived an honest and positive life helping the world end up in “The Good Place” after dying while the rest go to “The Bad Place”. In one episode, there was a particular line that stuck out to me:

“Plus, they’re all French, so they’re going to the Bad Place automatically.”This line got me scratching me head because I was about to live in France for five weeks! What’s so bad about the French?

Locations in Arles where Van Gogh based his paintings

Well, I’ve only been in Paris for about two weeks now, and I think I have a vague idea as to why the writers put that line into the show. The drivers are constantly honking up a symphony. Cashiers at the supermarket have no sympathy, and do not have a problem with letting you know that they’re upset with you if all you have is a 20€ bill. If you’re in someone’s way, people on the streets would rather walk right into you with a death glare rather than take one step to the right to avoid you. I’ve gotten pushed around, yelled at, and unfortunately, pick pocketed. The summation of my experiences the past two weeks has resulted in my interactions with the community members around me changing. And when an older French lady starts scolding you on the Metro, of course my mood changes from neutral to negative.

Van Gogh also seemed to have gone through a few mood changes during his time in France. During class this past week, we watched a couple of snippets from the movie “Lust for Life”, a biographical film on the life of Vincent Van Gogh. The famous Dutch painter moved to Arles, France to clear his head after living in Paris with his brother for over a year. However, it is in this place of isolation where he started to go insane. The movie illustrated that as time passed by, Van Gogh began to be less aware of his surroundings and the people around him, such as the bartender and the post man. And when his friend Paul Gauguin visited, he strongly expressed how lonely he had been. Van Gogh’s interactions with people began to shift, his mood changed, and he ultimately ended up cutting his ear off. This led me to learn more about the neuroscience of mood and interpersonal relationships.

Van Gogh’s self portrait with bandaged ear

Mood and emotions are tricky concepts as they are so subjective to each individual. One study was conducted on the neural mechanisms involving addition. It was found that withdrawal and aversive mood states may share a common pathway through the medial habenula (MHb) and interpeduncular nucleus (IPN) (McLaughlin et al., 2017). This pathway is associated with the medial forebrain bundle which is responsible for reward activation in the brain. Simply put, when something gives you pleasure, like drugs, the medial forebrain bundle is activated. When a patient that experiences drug abuse goes through withdrawal symptoms, they show aversive side effects and mood disorders, such as anxiety and depression. Another study was able to support this claim. A port-mortem study of sections from the brains of patients diagnosed with various mood disorders and depression showed significant reductions of the volume and area in the medial habenula (Ranft et al., 2010). The McLaughlin et al. study realized that the MHb-IPN circuit is where treatment should be targeted to treat drug abuse and mood-associated disorders. A partial explanation to Van Gogh’s mood swings and volatile interactions with others may be because of his addiction to drinking. Beyond simply the neural circuitry behind bad moods, neuroimaging investigations were also able to show that interpersonal emotions are associated with how we make sense of others’ state of mind. The anterior insula and anterior cingulate cortex at the same time process one’s own bodily arousal during such interpersonal emotional experiences (Müller-Pinzler et al., 2017). Social neuroscience researchers are very interested in knowing how interpersonal relationships with the people around us affect our mental and physical state. The way that both Van Gogh and I have changed the way we interact with our communities can be explained through neural circuits in our ACC.

MHb-IPN pathway (McLaughlin et al., 2017)

Our mood can directly impact how we go about the rest of our day. It is interesting to know that how we interact with others has a direct effect on our brains and how we process our emotions. As I adjust the way I interact with fellow Parisians, I can’t wait to see how I adjust back when I go back to all-sunny-Southern-hospitality Atlanta!

References

McLaughlin I, Dani JA, & Biasi MD (2017) The medial habenula and interpeduncular neural circuitry is critical in addiction, anxiety, and mood regulation. Journal of Neurochemistry 142:130-143

Müller-Pinzler L, Krach S, Krämer UM, & Paulus FM (2017) The social neuroscience of interpersonal emotions. Current Topics in Behavioral Neurosciences Springer 30:241-256

Ranft K, Dobrowolny H, Krell D, Bielau H, Bogerts B, Bernstein HG (2010) Evidence for structural abnormalities of the human habenular complex in affective disorders but not in schizophrenia. Psychol Med 50:557-567

Self-portrait with bandaged ear https://en.wikipedia.org/wiki/Self-Portrait_with_Bandaged_Ear#/media/File:VanGogh-self-portrait-with_bandaged_ear.jpg

The Good Place https://www.imdb.com/title/tt4955642/

the sky is more than blue

“Why is the sky blue?” The question that children love to ask. Frankly, I want to know the answer too. Before tackling this question, we need to answer the question, “What color is the sky?” To me, the sky’s the limit (pun intended). Today on this beautiful and sunny day, the sky is blue, but when it is cloudy and gloomy, the sky is grey. At night the sky is black with the presence of stars that are spread throughout the galaxy. The sky can present itself as a spectrum of colors. During sunrise it is a refreshing mixture of yellow, orange, and blue. During sunset, the sky is a gorgeous blend of the rainbow from royal purples to warm, sultry reds. The colors of the sky can vary depending on your location on Earth. For example, during the northern lights, it is an array or colors that light up the sky. There are numerous answers to what the color of the sky actually is, but these are just examples of how I see the sky.


However, the perception of color is really at the core of this question. When we think about how we perceive the color of the sky, the answer to this simple question becomes quite complicated. There are many different ways that people see different ranges of color. This is quite special because these experiences and qualities allow for us to experience the world quite differently. People with “normal vision” will perceive the sky differently than others with something such as synesthesia.

Based on my thought process to answer this question, I really dove into different ways people with synesthesia are different in terms of how they perceive the world. Synesthesia is a phenomenon in which people experience unusual percepts elicited by the activation of a sensory modality that is unrelated or a cognitive process (Safran and Sanda, 2014). It is truly fascinating that people experience the world in such a distinct and unique way.

The literature provides great resources to better understand how people with synesthesia process many different stimuli in the world. In a study by Itoh et al. (2019), the experimenters performed a Stroop-like test in individual with synesthesia. The Stroop test is a neuropsychological test to test the ability to inhibit cognitive interference that happens when the processing of a specific feature of a stimulus disrupts the simultaneous processing of a different stimulus (Scarpina and Tagini, 2017).  For example, one must say the color of a word and not the actual word itself. When the color of the word and the word itself differ, this task seems to become increasingly difficult. The authors did this with people with synesthesia, except with an auditory stimulus because some people with synesthesia relate a color and sound together. This was done to test the automaticity of pitch class with relation to color. They did this by presenting pitch class names (e.g., do, re, and mi) in font colors that lined up with their color sensations. These results showed that people with synesthesia had decreased time in identifying font color when the color was incongruent with their associated pitch class names, concluding that pitch-class synesthesia is a genuine type of synesthesia (Itoh et al., 2019).

Stroop Test


Synesthetes have been implicated to have a cross activation of visual areas that processes shape and color, supporting how visual stimuli lead to their unique perceptions of the world (Amsel et al., 2017). A review by Safran and Sanda (2014) took a look into how people with color synesthesia have varying associations in regards to perceptions, emotions, and consciousness. For example, synesthetes showed improved digit identification because each number is represented by a color, making a specific digit stand out. Some synesthetes experience their emotions and understanding through color, as shown in the review. An example that was shown was how a painting called “Vision” showed how the synesthetic painter drew out the visual experience of a needle puncture during an acupuncture session (Safran and Sanda, 2014).

“Vision” (Safran and Sanda, 2014)


To me, I would interpret it as a red splotch that could be blood. Clearly, my interpretation is far less poetic and meaningful when compared to the synesthete’s perception. Even within this review, the authors explored and reviewed many different ways that people with synesthesia navigate the world around them.

It is genuinely mind-blowing how the person on my right can interpret the world completely differently than the person on my left. I never would have imagined how a simple question like, “What color is the sky,” could be such an intriguing conversation starter.


References

Amsel, B. D., Kutas, M., & Coulson, S. (2017). Projectors, associators, visual imagery, and the time course of visual processing in grapheme-color synesthesia. Cognitive Neuroscience, 8(4), 206–223. https://doi.org/10.1080/17588928.2017.1353492

Itoh, K., Sakata, H., Igarashi, H., & Nakada, T. (2019). Automaticity of pitch class-color synesthesia as revealed by a Stroop-like effect. Consciousness and Cognition, 71, 86–91. https://doi.org/10.1016/j.concog.2019.04.001

Safran, A. B., & Sanda, N. (2015). Color synesthesia. Insight into perception, emotion, and consciousness: Current Opinion in Neurology, 28(1), 36–44. https://doi.org/10.1097/WCO.0000000000000169

Scarpina, F., & Tagini, S. (2017). The Stroop Color and Word Test. Frontiers in Psychology, 8.   https://doi.org/10.3389/fpsyg.2017.00557

Images

Media Library

https://study.com/academy/lesson/the-stroop-effect-in-psychology-definition-test-experiment.html


Hallucinations or Chromesthesia?

When we visited the Musée D’Orsay a couple of weeks ago, I was disappointed to hear that The Starry Night painting by van Gogh was at another exhibition; I had looked forward to the opportunity of seeing it in person. Although this was not possible, this past weekend we travelled to Arles, the town where van Gogh lived most of his life. It was a wonderful experience to walk around the areas where he painted his most famous works! Vincent van Gogh, one of the most famous painters from the mid-1800s, was also a man who lived a struggling life. Being somewhat of an outcast, he was ostracized by his community leading him to live a life of loneliness. Over the years, he spiraled into a routine of drinking absinthe that eventually led to the deterioration of his health. He was diagnosed with epileptic seizures and lived in and out of an asylum in Arles, France. Few know that he did his most famous works while he was suffering from these manic and depressive episodes. Seeing as how we have learned so much about him and even visited his hometown, I decided to look more into his medical diagnosis.

Starry Night: One of Vincent van Gogh’s most famous paintings

When you look at The Starry Night, you probably wonder how is it that van Gogh was able to see those colors in the sky when you can only see dark shades of blue at night. There are various theories as to why he decided to paint it that way, but one of those theories was that van Gogh had synesthesia. Synesthesia is a condition when stimulation in one sense automatically leads to sensations in another sense (Bradford 2017). For example, a person might see a letter and automatically associate it with a color. In the case of van Gogh, there is some evidence that points to him having chromesthesia. Chromesthesia is a subset of synesthesia in which certain sounds are associated with colors. “Vincent Van Gogh explained in his letters that for him, sounds had colors and that certain colors, like yellow and blue, were like fireworks for his senses” (Katie 2018). Could it be that he had synesthesia.

A famous cafe in Arles, France painted by van Gogh

Synesthesia is still a widely unknown occurrence. There are 6 regions in the brain, primarily in the motor and sensory cortex, where higher activation levels are observed, V4 (involved in color perception) being one of them (Rouw et al. 2011). For this reason, there are two differing hypotheses as to how it arises, one of them being that there is somehow a disinhibition when relaying back sensory information to the different brain areas, meaning that essentially anyone has the potential to develop synesthesia. The other theory is that there is a cross-activation mediated through white matter pathways that occurs between the different sensory cortex areas; this is something you are born with, so only those people are able to develop it.

To test this out, researchers performed a visual imagery task to induce synesthesia in a group of individuals (Nair and Brang 2019). They were put in a dark environment to simulate visual deprivation and were then asked about the shapes of multiple letters through audio. The results show that there was significantly more visual imagery when a sound was presented right after the audio recording. The fact that it took approximately 5 minutes to induce these sensations points to the theory that everyone is born with the capacity to be synesthetic, but it only appears when one of the other senses is deprived.

Could this be what van Gogh was experiencing? In a 2016 case study, they describe how a 20-year-old woman who was diagnosed with social phobia and schizophrenia due to her avoidance of social groups and claims that she could see colors when she heard sounds. The doctors thought that she was suffering from hallucinations. In reality, she had savant abilities and synesthesia. To have someone be misdiagnosed only a couple of years ago, makes you wonder if maybe the doctors missed something when diagnosing van Gogh. At a young age, when he took piano lessons, he described the experience as overwhelming because each note was associated with a different color He was disregarded and His teacher believed him to be insane and wouldn’t allow him to continue the lessons (Taggart 2019). Could it be that he was never understood because he did in fact think distinctly due to his ability to perceive the world in a different way? A question that may never be answered, but could give us a little more insight into one of the greatest artistic minds of that time. Maybe for van Gogh, the sky was in fact joyous and explosive, not just a simple color.


The cafe that inspired van Gogh’s painting

References

Bradford, Alina. “What Is Synesthesia?” LiveScience, Purch, 18 Oct. 2017, www.livescience.com/60707-what-is-synesthesia.html.

Bouvet L, Barbier J, Cason N, Bakchine S, Ehrlé N (2017) When synesthesia and savant abilities are mistaken for hallucinations and delusions: contribution of a cognitive approach for their differential diagnosis, The Clinical Neuropsychologist, 31:8, 1459-1473

Katie. “Vincent Van Gogh and the Power of Synesthesia in Art.” Exploring Your Mind, Exploring Your Mind, 20 June 2018,

Nair A, Brang D (2019) Inducing synesthesia in non-synesthetes: Short-term visual deprivation facilitates auditory-evoked visual percepts, Consciousness and Cognition, 70: 70-79.

Rouw, Romke, et al. “Brain Areas Involved in Synaesthesia: A Review.” Journal of Neuropsychology, John Wiley & Sons, Ltd (10.1111), 16 Sept. 2011

Shovava, and Shovova. “5 Synesthesia Artists Who Paint Their Multi-Sensory Experiences.” My Modern Met, 28 Feb. 2019

Picture 1: https://www.overstockart.com/painting/van-gogh-starry-night

Picture 2: https://en.wikipedia.org/wiki/Café_Terrace_at_Night

Picture 3: https://fineartamerica.com/featured/cafe-van-gogh-forum-square-arles-aivar-mikko.html

hearing voices

While difficult, trying to retroactively diagnose Vincent Van Gogh was by far my favorite journal prompt. My group and I eventually decided that, based on the evidence we examined, Van Gogh most likely had schizophrenia. The Diagnostic and Statistical Manual of mental disorders (DSM-5) is a list of psychiatric conditions and their symptoms that helps professionals diagnose patients. It includes criteria to help diagnose schizophrenia today. For symptom-based identification it instructs that schizophrenia patients are expected to exhibit catatonic behavior, negative symptoms, delusions, disorganized speech, and hallucinations (American Psychiatric Association, 2013). Van Gogh showed many of these symptoms but the one that most clearly pointed to schizophrenia was his hallucinations.

According to the note from the Director of the St Rémy mental home, Vincent Van Gogh exhibited both visual and auditory hallucinations (Van Gogh Museum, 2016). The importance of hallucinations in both his life and the diagnosis of schizophrenia made me wonder about their underlying biological mechanisms. I was particularly intrigued by the idea that patients sometimes hear voices talking to them when no one else is there. The idea of “hearing voices” may be familiar from Hollywood’s portray of mental illness, but what actually drives these hallucinations?

In the scientific community, this phenomenon is known as auditory verbal hallucinations. One major theory is that these hallucinations are a result of malfunctions in the brain systems that monitor inner speech. This idea is that, when these brain systems are impaired, people misinterpret their own internal dialogue as the speech of someone or something outside of them (Catani and Ffytche, 2005). While this theory has been around for decades, there are still many unanswered questions about the specific biology and brain areas that are associated auditory verbal hallucinations.

Auditory verbal hallucinations are when patients
believe they hear voices speaking to them

A recent study by Cui et al. investigated the neuroanatomical differences that may be connected to this type of hallucination. The authors studied healthy control patients as well as a large population of schizophrenia patients who did and did not exhibit auditory verbal hallucinations from hospitals across China. The patients they gathered is an important aspect of this study because previous work had only compared schizophrenia patients with hallucinations to healthy controls. Here, the researchers wanted to specifically investigate what neuroanatomical difference leads to auditory verbal hallucinations, so it was important for them to look at schizophrenia patients that did not experience these hallucinations as well as those that did.

Once the authors had gathered this group of patients and controls, they used a magnetic resonance imaging (MRI) scanner to get a structural image of the subjects’ brains. They then used a computer software program to compute the thickness of the subjects’ cortex, the brain’s outer layer.In particular, these researchers were interested in measuring and comparing the thickness of the middle temporal gyrus (MTG).

The middle temporal gyrus (MTG)

Previous scientific studies have indicated that the MTG may be important for the monitoring of inner speech and is often less activated in schizophrenic patients (Shergill et al. 2000; Seal et al. 2004). The function and development of the MTG is well-suited for it playing a role in auditory verbal hallucinations. First, the MTG is involved in brain pathways that make it important for interpreting certain sounds we hear, especially processing language (Cabeza and Nyberg, 2000). The MTG is also unique in the way it develops. This area of the brain develops relatively late in life (Gogtay et al. 2004). This makes sense for hallucinations associated with schizophrenia, which is a disease known to be associated with brain development that often doesn’t appear until patients are around 30 years old (Lewis and Levitt, 2002).

Previous studies had shown that the volume of the MTG is smaller in schizophrenic patients than it is in healthy people (McGuire et al., 1995). The point of this study was to test if that reduced size was associated with schizophrenia in general or auditory verbal hallucinations specifically.  When Cui et al. calculated the volume of the subjects’ middle temporal gyrus they found that it was significantly smaller in schizophrenia patients that had auditory verbal hallucinations than patients that did not. They also found that there was not a significant difference between the schizophrenia patients that did not have hallucinations and the healthy controls. These results suggest that a thinner MTG is not only connected to schizophrenia but is specifically associated with schizophrenia patients that experienced auditory verbal hallucinations.

Starry Night, a famous Van Gogh painting some
believe is the result of his hallucinations

While this new study offers great evidence comparing schizophrenia patients with different symptoms, there is still a lot to figure out about this kind of hallucination. Scientists are still working to discover what exact processes lead to cortical thinning and how those processes begin. However, what we do know about auditory verbal hallucinations emphasizes how heavily we rely on our perception of the world around us. We will not ever get to know the thickness of Vincent Van Gogh’s MTG, but the auditory hallucinations Van Gogh experienced were probably the result of his hearing system malfunctioning in some way. Today, many people believe that some of Van Gogh’s most famous decisions and artworks were informed by his hallucinations (Jones, 2016; New York Times Archive, 1981). Modern neuroscience tells us that those hallucinations may have actually been an erroneous interpretation of his own inner dialogue all along. 


References

American Psychiatric Association. (2013). Diagnostic and statistical manual of mental disorders (5th ed.). Arlington, VA: Author.

Binney RJ, Parker GJ, Ralph MAL (2012). Convergent connectivity and graded specialization in the rostral human temporal lobe as revealed by diffusion-weighted imaging probabilistic tractography. Journal of Cognitive Neuroscience 24, 1998–2014.

Catani M, Ffytche DH (2005). The rises and falls of disconnection syndromes. Brain 128, 2224–2239.

Cabeza R, Nyberg L (2000). Imaging cognition II: an empirical review of 275 PET and fMRI studies. Journal of Cognitive Neuroscience 12, 1–47.

Cui Y, Liu B, Song M, Lipnicki D, Li J, Xie S, . . . Jiang T. (2018). Auditory verbal hallucinations are related to cortical thinning in the left middle temporal gyrus of patients with schizophrenia. Psychological Medicine, 48(1): 115-122

Jones, J. (2016). Vincent van Gogh: Myths, madness and a new way of painting. Retrieved from https://www.theguardian.com/artanddesign/2016/aug/05/vincent-van-gogh-myths-madness-and-a-new-way-of-painting

Gogtay N, Giedd JN, Lusk L, Hayashi KM, Greenstein D, Vaituzis AC, Nugent TF, Herman DH, Clasen LS, Toga AW, Rapoport JL, Thompson PM (2004). Dynamic mapping of human cortical development during childhood through early adulthood. Proceedings of the National Academy of Sciences 101, 8174–8179.

Lewis DA, Levitt P (2002). Schizophrenia as a disorder of neurodevelopment. Annual Review of Neuroscience 25: 409–432.

McGuire PK, David AS, Murray RM, Frackowiak RSJ, Frith CD, Wright I, Silbersweig DA (1995) Abnormal monitoring of inner speech: a physiological basis for auditory hallucinations. The Lancet, 346(8975): Pages 596-600,

New York Times Archive (1981) Van Gogh’s Hallucinations. Retrieved from https://www.nytimes.com/1981/07/07/science/science-watch-van-gogh-s-hallucinations.html

Seal ML, Aleman A, McGuire PK (2004). Compelling imagery, unanticipated speech and deceptive memory: neurocognitive models of auditory verbal hallucinations in schizophrenia. Cognitive Neuropsychiatry 9, 43–72.

Shergill SS, Brammer MJ, Williams SCR, Murray RM, McGuire PK (2000). Mapping auditory hallucinations in schizophrenia using functional magnetic resonance imaging. Archives of General Psychiatry 57, 1033–1038

Van Gogh Museum (2016). Shortly before 27 February 1889 In Concordance, lists, bibliography (Documentation). Retrieved from: http://www.vangoghletters.org/vg/documentation.html


Images: 

https://search.creativecommons.org/photos/71b807e7-29fd-445d-95a1-4d282ccf02e5

https://upload.wikimedia.org/wikipedia/commons/thumb/f/f5/Gray726_middle_temporal_gyrus.png/250px-Gray726_middle_temporal_gyrus.png

https://upload.wikimedia.org/wikipedia/commons/thumb/e/ea/Van_Gogh_-_Starry_Night_-_Google_Art_Project.jpg/757px-Van_Gogh_-_Starry_Night_-_Google_Art_Project.jpg