In this post, I highlight the trend of increasing Canvas mobile app usage. I also revisit the tools highlighted last year using grand totals and year-over-year percentage change.
Mobile App Usage
In 2018 Canvas Data Trends, I wrote about increasing use of the Canvas mobile apps as measured by peak user counts. Mobile app usage continues to increase on those measures: peak user counts reached new highs in 2022 with over 2,900 in the peak hour (on August 30), over 9,600 in the peak day (October 3), and over 13,400 in the peak month (September).
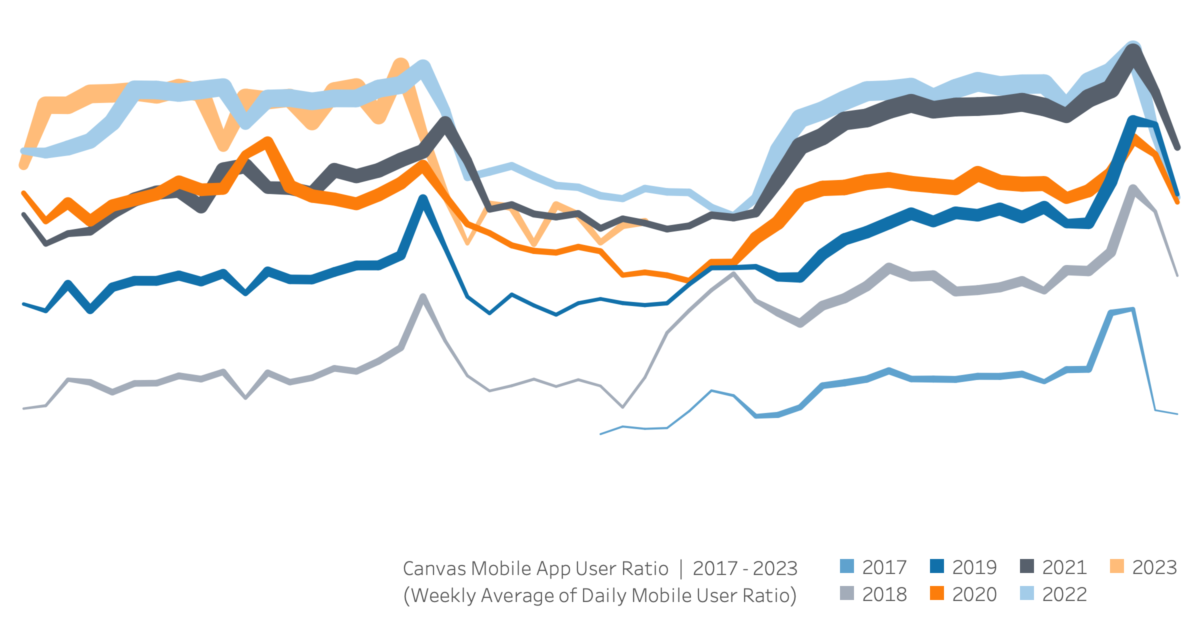
The charts in the 2018 post juxtaposed mobile app users and total Canvas users in different lines on a shared axis. This year I have a chart showing the weekly average of the daily ratio of mobile app users over total Canvas users. This gives the rough percentage of Canvas users who are everyday users of the mobile apps, which increased a great deal since 2018.
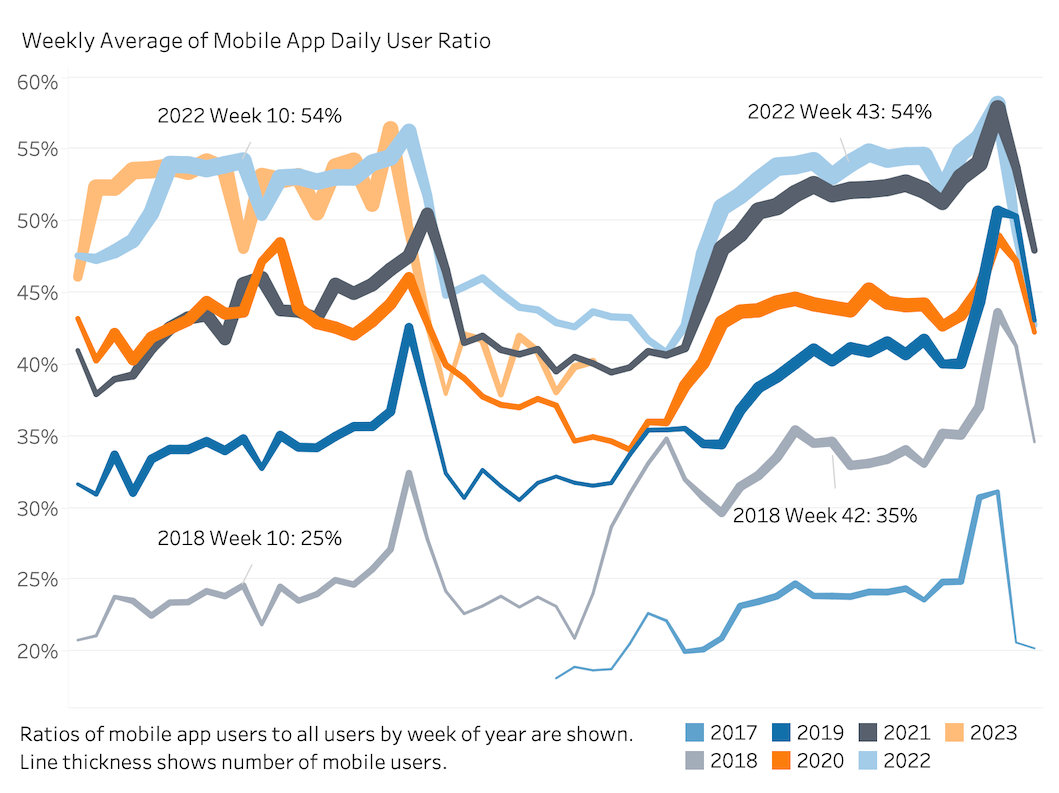
The ratio is above 50% for most weeks in 2022 and Spring 2023 (summer ratios are consistently lower). When I presented the chart above to coworkers, they asked whether students or teachers use the Canvas mobile app most. They also asked how much the mobile app users use the app, i.e. what percentage of each mobile app user’s access is made through mobile, and how student mobile use compares to teacher mobile use. These are great questions, but my stored aggregated view data lacks the detail to answer them. To look at mobile usage by role and to measure depth of usage, I aggregated view data from February and March of 2023 with more detail than usual. I have calculated users’ mobile ratios (mobile views as a percentage of all their views) and identified their most privileged course role to make histograms of student and teacher mobile use.
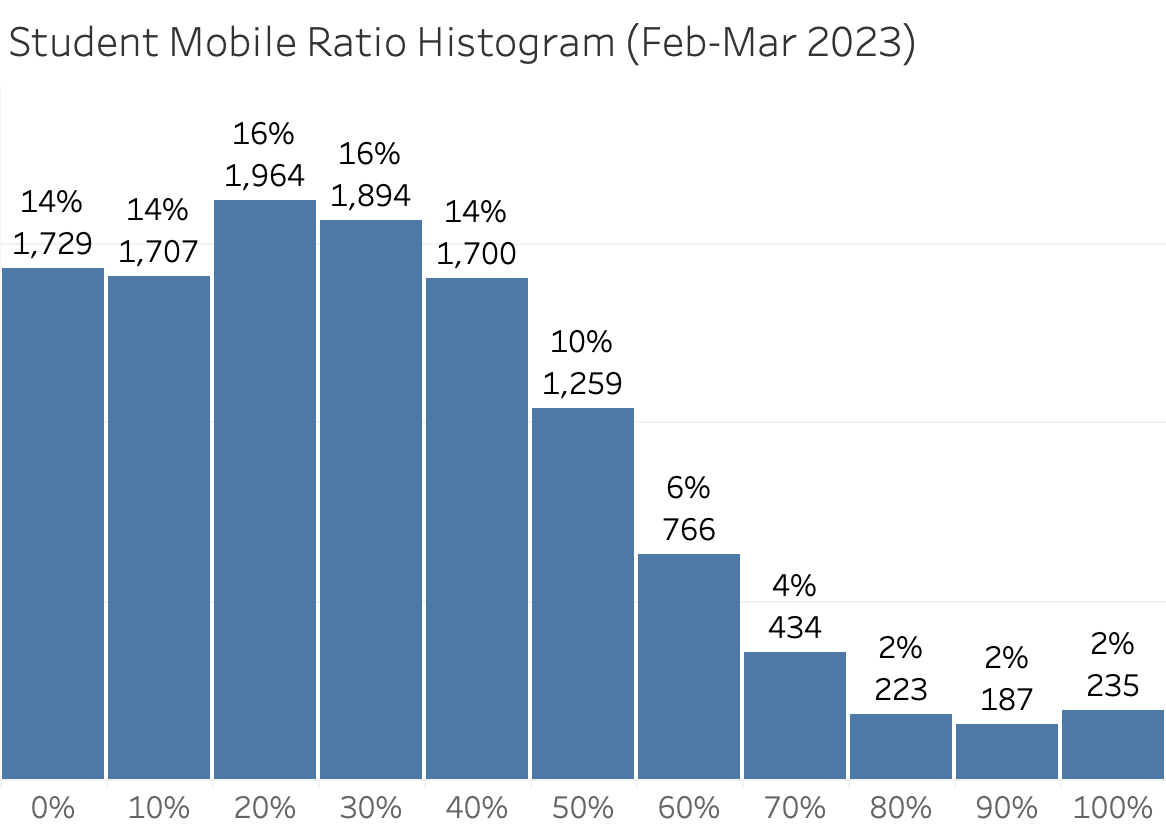
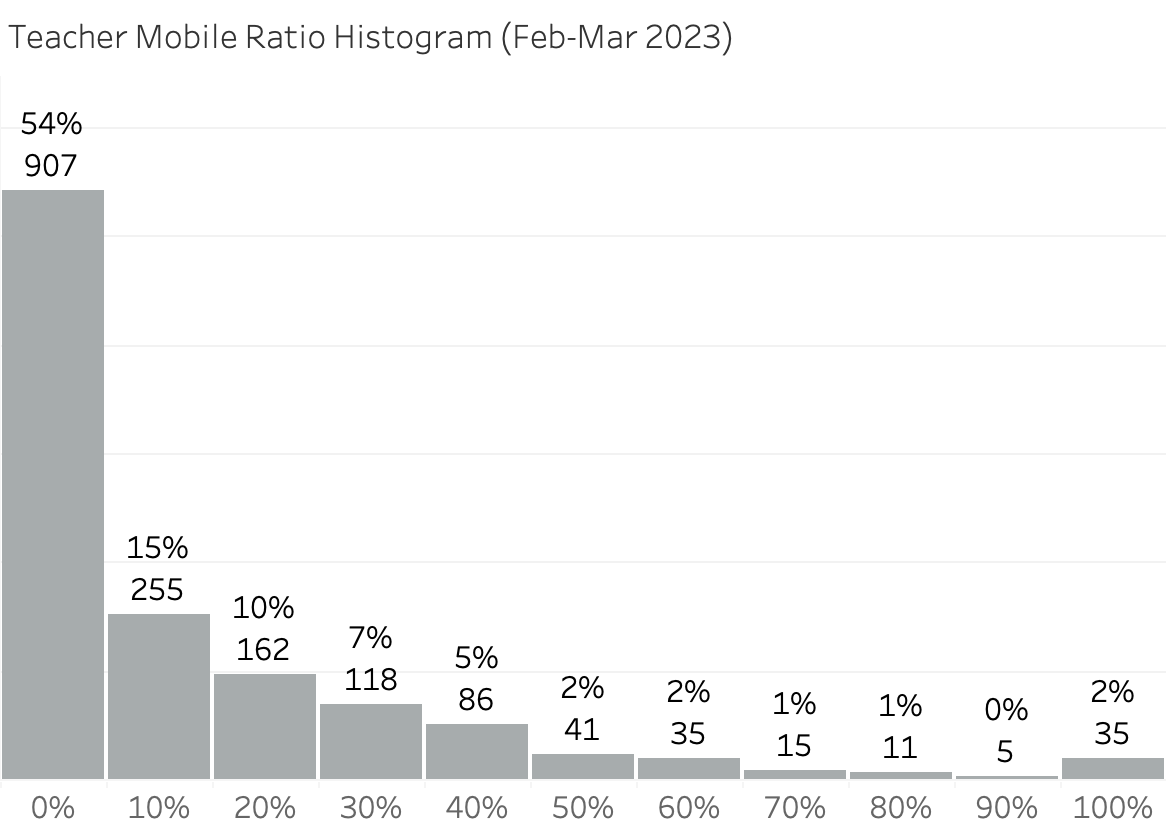
The detailed mobile access data from February and March shows that it makes up a small portion of access by the vast majority of the teachers who used Canvas on a mobile device at all: 69% of mobile-using teachers used it for less than 20% of their accesses, and less than 10% of mobile-using teachers used mobile for 50% or more of their accesses. The story is different for students: 72% of mobile-using students used it for at least 20% of their accesses. We can conclude that students are the main driver of increasing average daily mobile app use in Canvas. It is also probable that most students in a course access Canvas on mobile devices more often than does their teacher.
Revisiting Last Year’s Highlighted Data
In Increased Canvas Use in 2020 and 2021, I used line charts to show the large increases in total views, online submissions, Studio launches, and discussion posts following the switch to remote teaching & learning. Canvas use remained high in 2022 even as most courses met on campus. The shape of the lines for 2021 and 2022 would be very similar in updated versions of last year’s charts. A simplified list of grand totals and year-over-year changes for these tools shows the annual trends at a high level.
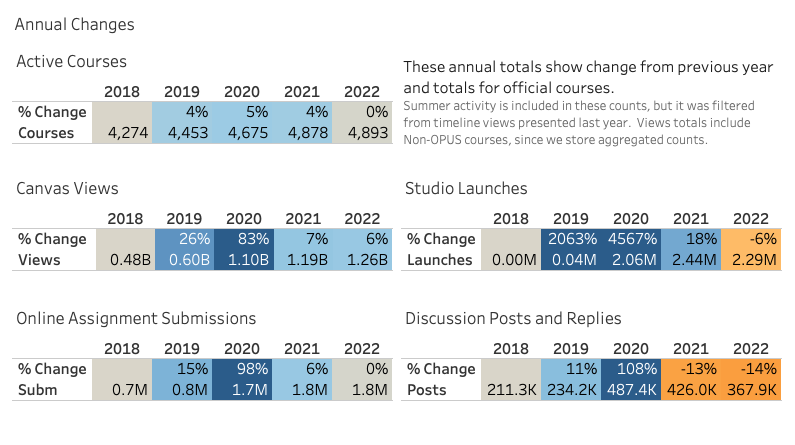
The tools that were used less overall in 2022 compared to 2021 are Canvas Studio and Discussions. While primarily remote teaching caused huge increases for both tools, returning to primarily in-person teaching has not caused their use to return to 2019 levels.