Scholars and students in the Digital Visualization Lab at Emory’s Center for Digital Scholarship (ECDS) have been working on extracting building footprints and city infrastructure features from a 1878 and a 1930 atlas of the city of Atlanta for several years. The first goal of this initiative was to build a geodatabase built from our understanding of the maps, legends, and contemporary requirements of the data structure. Since then, the project has grown and expanded, using the geodatabase to support an interactive online platform for Digital Scholarship efforts in and around the city of Atlanta.
The Interactive Historical Visualization of Atlanta otherwise known as OpenWorld Atlanta (OWA) is an extension of the Mapping and Data initiative at Emory that provides different interactive engagements with historical data, 3D models, maps, and virtual environments about Atlanta, allowing users to explore Atlanta’s past. The platform features a number of interactive possibilities, including but not limited to:
- A geospatial data portal structure; hosted through Emory and Georgia State University Libraries, each institution’s spatial data infrastructure (GeoServer) provides:
- Raw data;
- A cataloging application for searching metadata records;
- Direct download of geospatial data, maps, and imagery use in geographic information systems (GIS) or other geospatial applications or viewers
- Geospatial data, accessed multilaterally through:
- Historical materials and narratives:
- Accessed through a database and public interface that curates and collects information about Atlanta’s history, buildings, and residents;
- Providing historical and narrative data to other viewers via an API similar in design to ATLMaps
- Immersive interactions with Atlanta’s history through:
- Virtual environments (download and/or streaming) developed for the web with UnityTM and deployed as a WebGL build for universal access;
- An augmented reality app that superimposes 3D models of historical buildings into real space based on user geolocation using a smartphone app;
- A library of curated 3D models developed from historical building footprints, plans, and procedural modeling ultimately deployed through web browsers
To support these interactive features, the team at ECDS has begun to develop a framework – an Application Programming Interface (API) – that brings together databases containing large amounts of archived records about Atlanta circa 1930, with city planning details and an interactive real-time platform developed using the game engine UnityTM. The aim is to build a seamless interface that accurately depicts all buildings/city planning elements of Atlanta circa 1930 and serves as a backdrop for further scientific investigation of the Atlanta chronotope.
According to ECDS’s Arya Basu, “we are building a visual chronotope of Atlanta circa 1930, through the use of modern databases and real-time game engines, that will serve other scientific insights into the city’s history.” (Chronotope is a term first introduced by Mikhail Bakhtin in the early 20th century to describe configurations of time and space in literature. Dentith, Simon. “Chronotope”. The Literary Encyclopedia. First published 18 July 2001.)
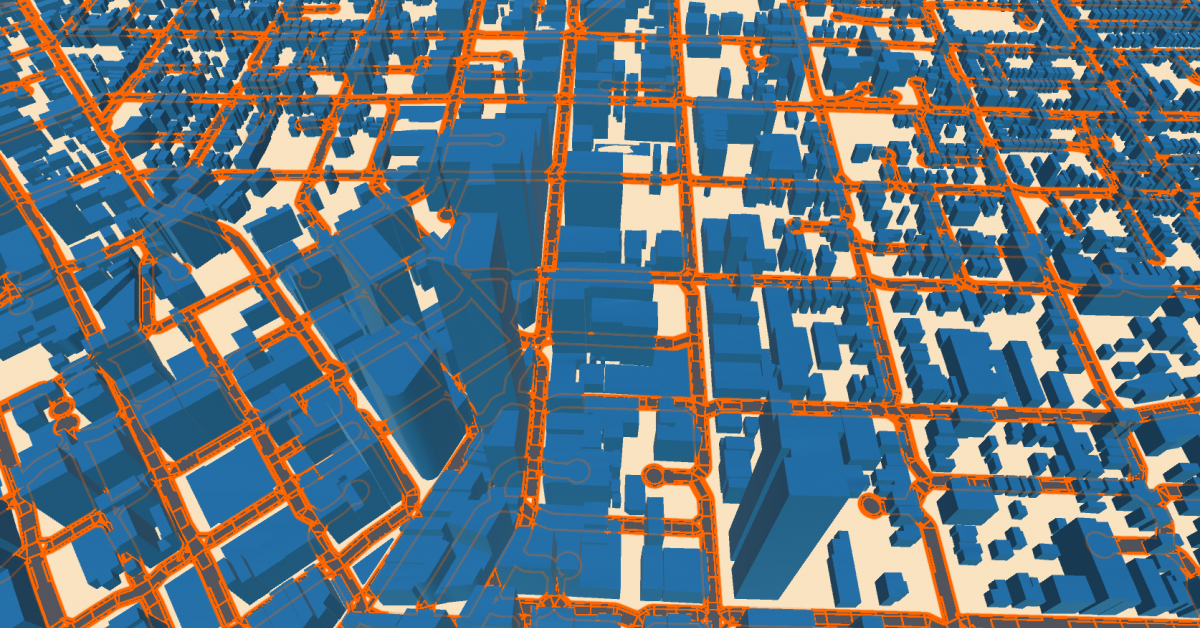
The current development of Open World Atlanta involves a three tier user interface. The first is the historical map view of Atlanta (Figure 1; 1:100 scale) which can be zoomed until one reaches 1:200 scale region of the historical map (Figure 2). The second tier is a bird’s eye view of Atlanta with all its buildings footprint and infrastructure elements (Figure 3). The third tier is a fully immersible 3D environment that represents Atlanta circa 1930 (Figure 4). The highlighted geometry in this figure represents the road network circa 1930s Atlanta and is currently being streamed via the ECDS framework API.
The project team includes Arya Basu (Visual Information Specialist at ECDS); Ian Burr (Digital Visualization Fellow at ECDS); Michael Page (Geographer at ECDS); Wayne Morse (Co-Director of ECDS); and Allen Tullos (Co-Director of ECDS).