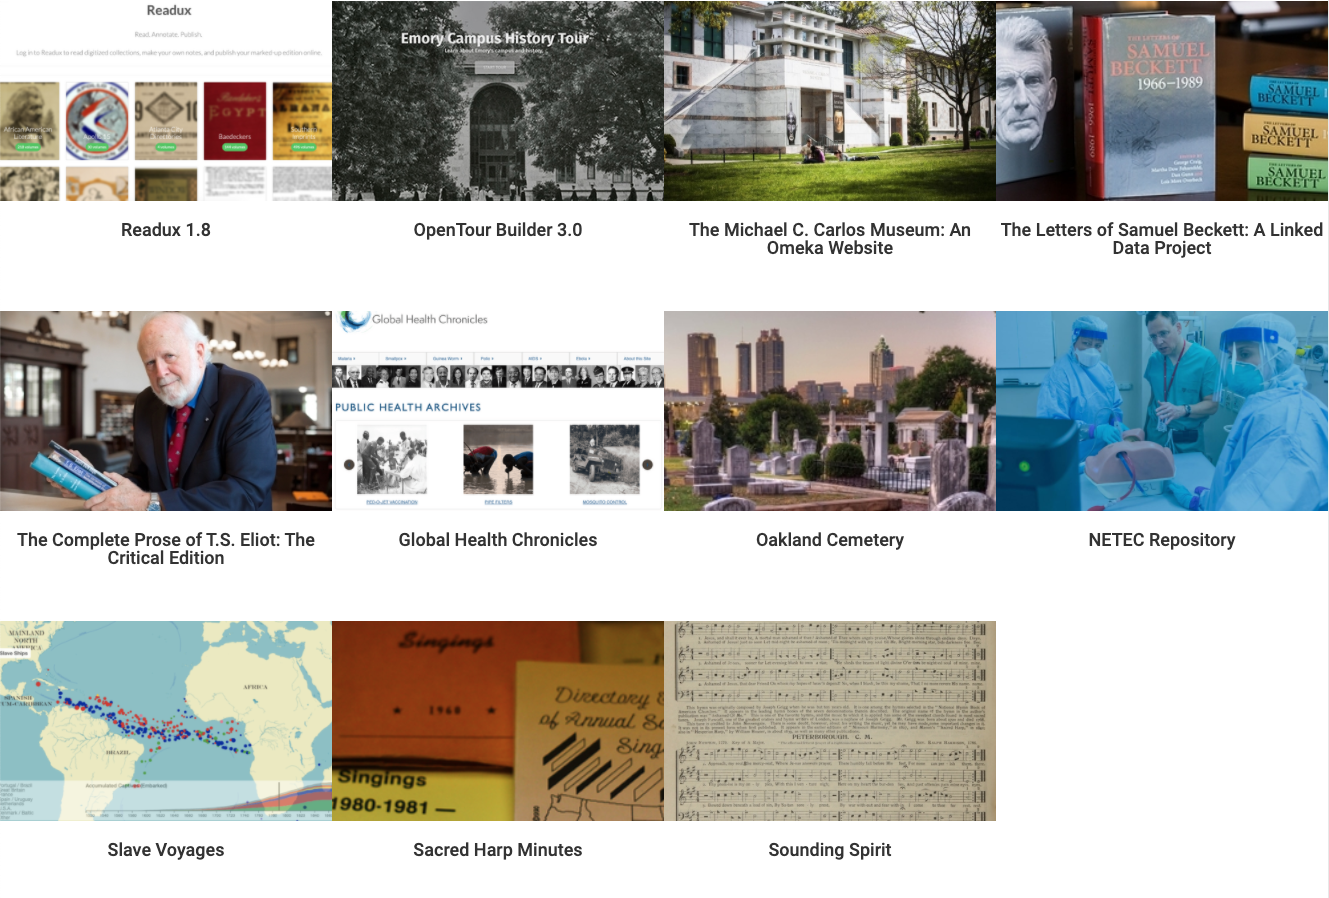
Since its inception in 2013, the Emory Center for Digital Scholarship (ECDS) has created and supported a wide variety of digital scholarship projects for and with Emory University faculty, students, staff, and external organizations. The team has worked on such flagship projects as SlaveVoyages, Southern Spaces, and Readux, as well as cutting-edge technologies like augmented reality (AR) and virtual reality (VR). Staff have also conducted hundreds of consultations, workshops, and teaching sessions. Based on the ECDS’s biennial report, the center’s Senior Software Engineer Yang Li helped create an ECDS Dashboard to display work from the past two years, with help from additional ECDS staff. The dashboard reflects both the quantity and quality of work our staff have produced internally and with major partner organizations. We hope that the future of ECDS yields even further growth. In the meantime, we invite you to check out the accomplishments from 2017-2019 on our newly-released ECDS Dashboard site.
- ECDS Dashboard: https://ecdsdashboard.webflow.io/
 The ECDS Dashboard functions as an online exhibit to both curate what we have accomplished and showcase the kind of support that a member of the Emory scholarly community—and beyond—can receive. As we continue to grow, our center looks to connect with more students and scholars through this dashboard, allowing us to better assist them. ECDS provides digital scholarship support and expertise that include digital pedagogy, consultations, workshops, classes, media productions, and project partnerships. Due to the multidisciplinary nature of our work, each individual project usually involves several aspects or fields of expertise. Our team therefore works collaboratively, enabling ECDS to quickly move projects from ideation to execution.
ECDS Co-Director Wayne Morse, Jr. explains that the overall goal in creating the ECDS Dashboard was to “create a version of the center’s annual report that includes both quantitative and qualitative information, presented in a way that is very approachable and engaging. Numbers tell an important story about the impact digital scholarship has on teaching and research, but stories, images, and videos combined with this numeric data present a much fuller picture of the work our team accomplishes.” Yang Li, who built the dashboard, explains that “as a member of the center, I look back at what ECDS has done and am quite amazed.” The dashboard allows the center to better communicate what we offer to the scholarly community and broader audience.
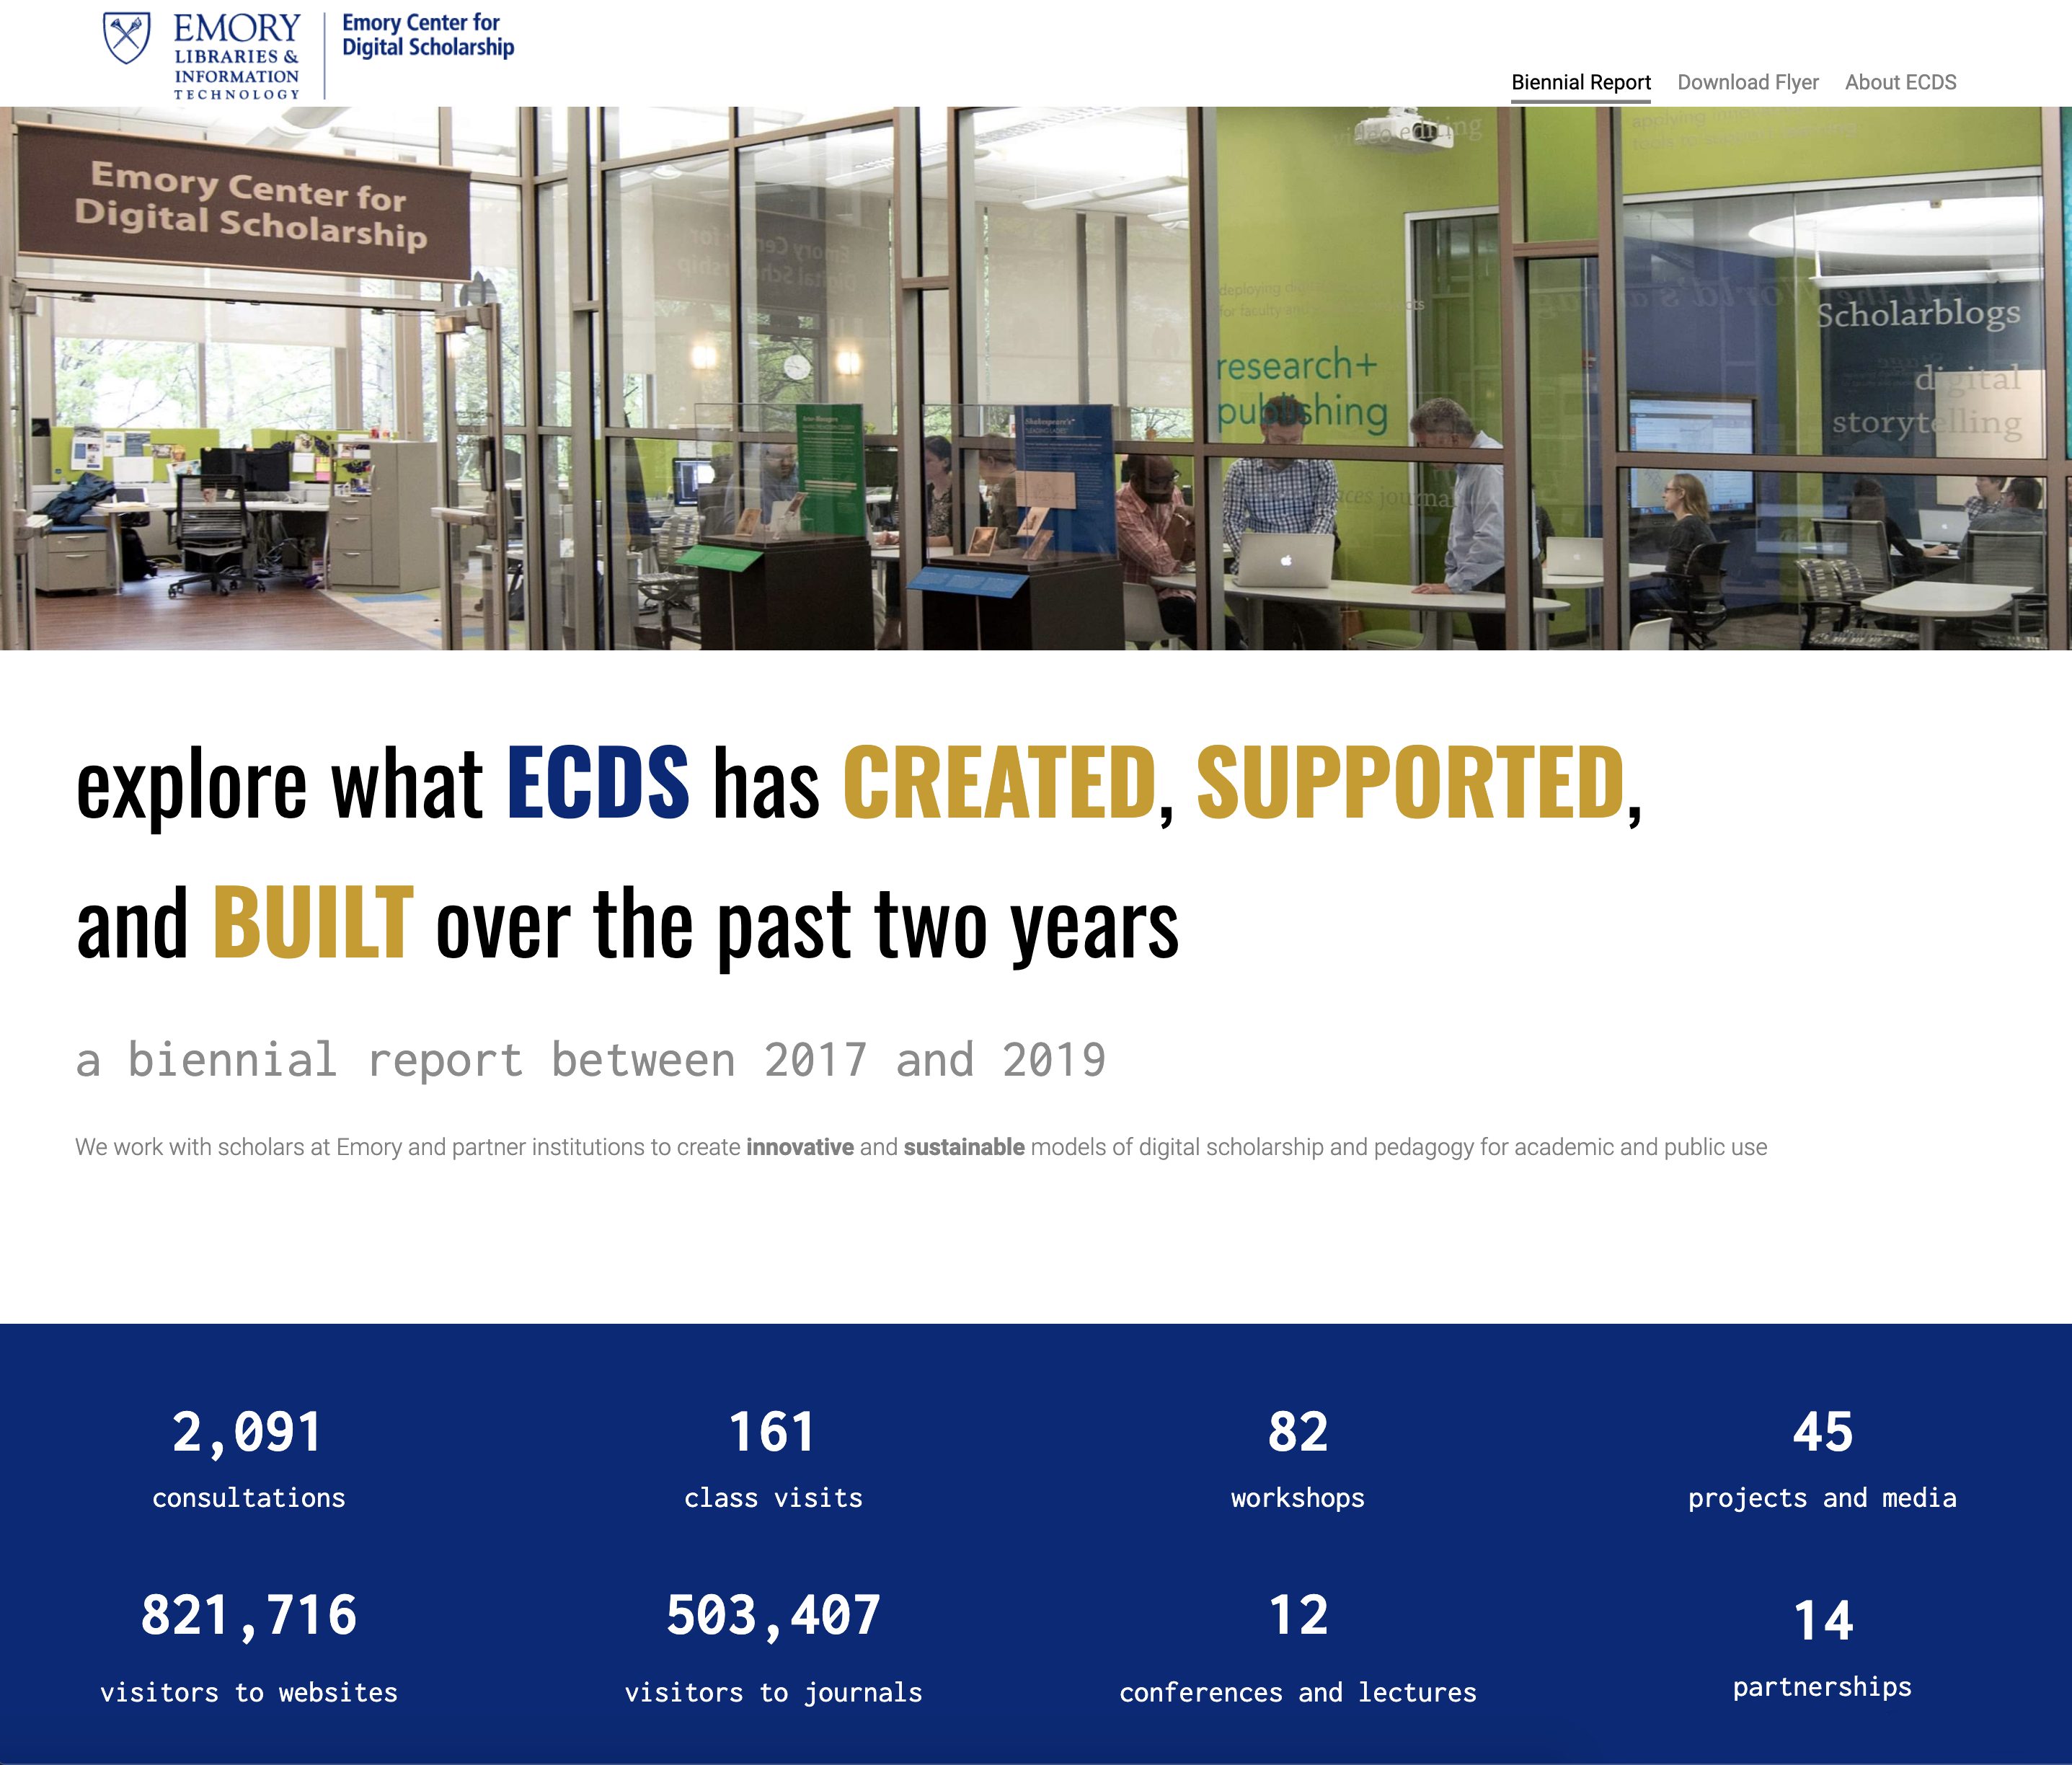
The ECDS Dashboard is thus a hub that allows visitors to understand the role that ECDS plays in the digital era. Bringing his UI/UX and software engineering expertise to the project, Yang went over all of the center’s statistics, which included hundreds of consultations and dozens of projects. He then grouped this work into several categories: Projects and Platforms; Consultations, Workshops, and Classes; Media Productions; Conferences and Invited Lectures; Partnerships; Featured ECDS Publications; and Grants. The dashboard includes both high-level summary statistics and project details under each category. ECDS Digital Project Specialist Adam P. Newman and Communications Specialist Amy S. Li provided and tailored descriptive content for each project, balancing between breadth and depth of projects.
The dashboard is also designed to be a complement to our newly redesigned website, allowing people from various backgrounds to get a sample of the impact and breadth of the center’s work. Links to the ECDS website from the dashboard provide a pathway to explore the team’s work in more depth. With new executive leadership at Emory University and increasing numbers of digital scholarship centers being created across the globe, the hope is that the dashboard will present information on our center’s work in an impactful and accessible way to anyone who wishes to learn more about ECDS’s projects, partnerships, and impact on digital scholarship.
The Platform
Yang explains that, after surveying a few tools to create the dashboard, he found Webflow to be the best fit. Webflow is a no-code website builder with a site architecture tailored for modern web development. “It uses templates that allows the site builder to design the visuals of each page and a CMS [content management system] model to host data,” Yang says, adding that this division “allows the site to be flexible and sustainable, so that all data can be easily migrated and maintained. The design can also evolve over time without the need to alter or touch the data.” Since the dashboard will be a long-term hub for future projects and potential changes, Webflow accommodates future adaptations and ensures the site’s sustainability.
In addition to the site architecture, the no-code builder allows non-developers to collaborate on website projects. Everything—ranging from image positioning to mobile responsive design—can be done through the Webflow designer, which does not require any coding knowledge. This lowers the barrier to access and allows one to customize a site for different use cases, allowing the site to be built and updated quickly by any project team member. As the center looks to maintain this site as a useful way of showcasing our annual report data in the future, these considerations make sure that the ECDS Dashboard will continue to best highlight the center’s accomplishments and, hopefully, foster even more fruitful partnerships in years to come.
On the ECDS Dashboard website you can also download a flyer of the ECDS biennial report. We invite you to “explore what ECDS has created, supported, and built over the past two years” at: https://ecdsdashboard.webflow.io/