
The Emory community has access to a wealth of business research databases. This series highlights many of these great resources, including content and the best applications for classes and career prep.
What Will You Find?
PolicyMap publishes U.S. statistical data that can be plotted by geographical location to help you make data driven decisions. Data included in PolicyMap ranges from Census data (including income, education, and housing), bankruptcy data, food availability information, crime stats, and health data, and you can view this via maps, tables and reports.
You can make maps focused on locations as broad as states, or as narrow as addresses or census tracts. As you select data points, you can layer data to filter by multiple variables.
Use for Class Projects
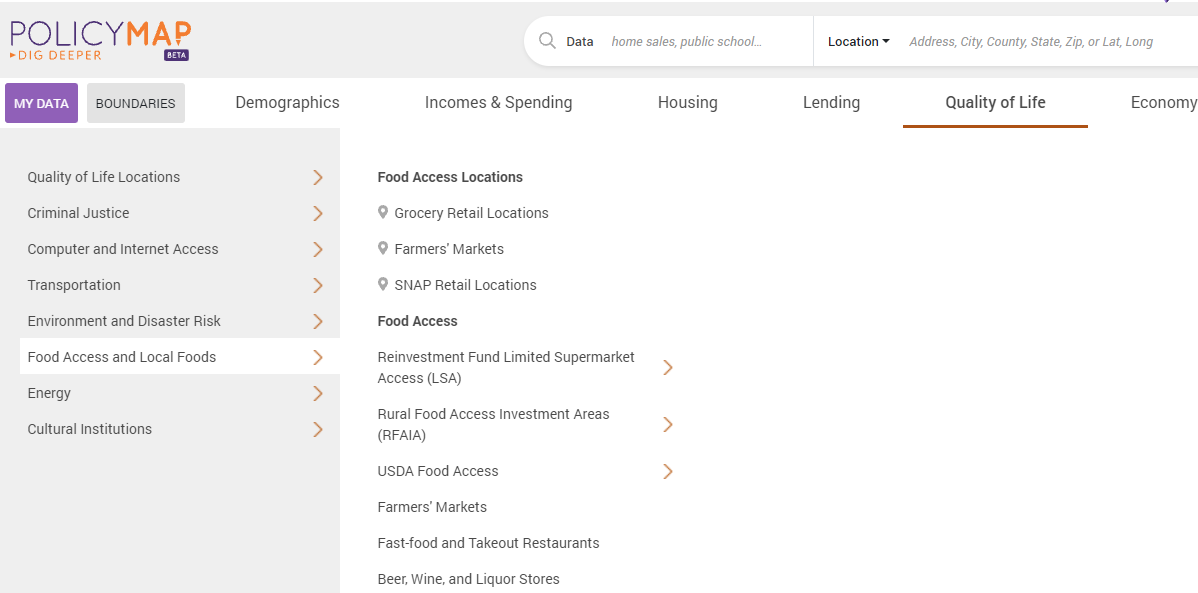
PolicyMap data sets can be helpful for a variety of reports or presentations related to public health, sociology, economics and more. For example, under Quality of Life, you’ll see data sets on grocery retail locations, farmers markets and SNAP retail locations. This can be helpful identifying food deserts. Under Housing, you can find data on rents, residential building quality, affordability, and subsidized housing. This can help with public policy recommendations and zoning decisions.
Use for Interview Prep
PolicyMap may not be the first database you start with when you’re preparing for an interview, but it can provide valuable insight on national trends for case interviews or final round presentations. For example the Demographics section includes areas on migration within the US and comparing areas that are growing and shrinking. This can be helpful for considering business development issues.
Additional Business Resources
You can also use the Business Research Guide to locate additional business resources, locate tips for how to use them, and understand which are best for your specific research needs.