Tag Archives: neuroscience

Goo Goo for (Lady) Gaga

In the chapter we read in class, we saw how Stravinsky’s music had a disrupting effect on the listeners’ ears because it was distinct from the sounds they had heard in the past. There were dopaminergic neurons that fired when met with such sounds. But most importantly, these neurons then lead to plasticity in the auditory cortex. It points to an idea that maybe manipulating the use of music can lead to changes in other areas of the brain, not just the auditory cortex. Music plays a role in our daily lives. Who doesn’t love to listen to music while riding the metro to class every day? Those 20 minutes allow me to jam out to my favorite songs and destress for the day. I don’t know how I’d function without it. There have been studies that have shown that music is a great stress reliever (Linnemann et al., 2018).

This then made me wonder, if music plays such a big role on our lives (I mean the same 10 songs are trending worldwide), then could music go beyond just pleasure and truly have effects on our brain? Is there just a pleasant component to music or can it also be beneficial to us? I decided to look into a 2019 study that studied the effects of music on premature infants.

The salience network model

Pre-term babies have a variety of medical complications that can lead to them being in the NICU for weeks or months. While in the NICU, Lordier et al. set to test whether playing music to preterm infants would enhance their brain development (2019). With the use of fMRI testing, they test the brain connectivity in the subjects while they are in a resting state. They first measured the resting-state functional connectivity, which is a measure of the statistical dependencies between different brain regions. The greater the connectivity, the more brain maturity. They measured this prior to music exposure in normal and pre-term babies and found that pre-term babies’ connectivity was significantly less than the full-term babies. Within the connectivity calculation, there is a salience network which helps a person detect a certain stimuli and respond to it accordingly. The salience network connects 3 main areas, for simplification purposes, we can call them the auditory and sensorimotor networks, the thalamus, and the visual cortex. The salience network is made up of the insula, often involved in sensory processing and cognitive abilities, and the anterior cingulate cortex, often involved in emotion and information processing.

The researchers recruited 24 full-term infants and 39 preterm newborns. Within the preterm group, 20 received the musical enhancement while the other 19 did not. They had 3 distinct songs: a song for the baby to wake up to, a song for an awake baby, and a song that helps the baby fall asleep.  The music was played to them for 5 days a week until they were released from the hospital.

Image describing the process of music listening

The results show that there is an increased connectivity in the regions of the sensorimotor network and the thalamus, but not the in the orbitofrontal cortex/visual cortex. This data supports the idea that music does in fact enhance a premature baby’s brain network.  Although this is a good place to start, I believe that further studies should be done to determine what type of music works best and to maybe follow the test subjects through the years to see the effects. Also, it was unclear why one area of the brain, the orbitofrontal cortex did not show an increased connection since when comparing to adults, there is a significant amount of greater activity in this area (Brown et al., 2004).

The results of the study showing the strengthening of the pathways

So, now it makes so much sense why the people who first heard Stravinsky were in a riot, music exposure plays a big role in our lives from such an early age. This study showed us how music is not only something you hear for entertainment purposes; it also has the potential to actually enhance the brain connections of these infants. Prior studies have shown that adults are also able to enhance their brain networks by learning how to play music or by listening to pleasant music (Tanaka and Kirino, 2017). So now that we have seen the extent of music on brain region connectivity, you might want to start putting in your headphones. I know I won’t be feeling guilty for drowning out the world in those 20 minutes of riding in the stuffy metro.

References

Brown S, Martinez MJ, Parsons LM (2004) Passive music listening spontaneously engages limbic and paralimbic systems. Neuroreport 15, 2033–2037.

Dolezel, Jodi. “Premature Birth Facts and Statistics.” Verywell Family, Verywell Family, 24 June 2019, www.verywellfamily.com/premature-birth-facts-and-statistics-2748469.

Linnemann A, Ditzen B, Strahler J, Doerr JM, Nater UM (2015). Music listening as a means of stress reduction in daily life. Psychoneuroendocrinology. 60:82–90.

Lordier L, Meskaldji D, Grouiller F, Pittet MP, Vollenweider A, Vasung L, Borradori-Tolsa C, Lazeyras F, Grandjean D, Van De Ville D, and Hüppi PS (2019). Music in premature infants enhances high-level cognitive brain networks. PNAS. 116 (24) 12103-12108.

Tanaka S, Kirino E, Reorganization of the thalamocortical network in musicians. Brain Res. 1664, 48–54 (2017)

Image 1: https://en.wikipedia.org/wiki/Salience_network

Image 2: https://leapsmag.com/this-special-music-helped-preemie-babies-brains-develop/

Image 3: https://www-pnas-org.proxy.library.emory.edu/content/116/24/12103


I don’t like the taste of this anymore!!

In class, we discussed gustation and the different mechanisms associated with taste processing. Later, we participated in an amusing activity. We taste tested different snacks! In this activity, we were given chips of different flavors and had to taste and guess the flavor. The first chip smelled like barbeque, but I thought that was too easy of a guess. After tasting it, I was left uncertain of the flavor because it wasn’t particularly gross or tasty. Upon receiving a suggestion card that revealed the flavor as “mustard,” I still was not convinced I knew the flavor. When the options of pickle, cheeseburger, and mustard were given to me, I immediately thought it could be cheeseburger because it distinctly tasted like the aftertaste of a McDonald’s cheeseburger (the one in the kid’s meal). The next two flavor of chips were easy to guess because they both tasted exactly like their said flavors, cheese and ketchup.

After the chip taste test, Dr. O’toole gave us a supplement, and the effect of that supplement was that we had a harder time tasting sweet. To test how well it worked, we tried a piece of chocolate, and I do not enjoy the taste chocolate. However, it was not as bad as I expected because the sweetness of chocolate that I hate was not perceived by me. Instead, I really just felt the texture more than usual, but maybe that was due to that specific type of chocolate.

Anyway, during this activity, it occurred to me that the flavors we tasted were savored by some and despised by others, and some people started to enjoy certain chips. This observation triggered an intriguing thought. In what situation does one change taste preference? When I thought of this idea, I dove into scientific literature to find an answer to my question, and I stumbled upon a pilot study that investigated changes in taste and food preferences in breast cancer patients.

Breast cancer is the most common cancer in women, and the prevalence is increasing (DeSantis et al., 2015). To decrease the fatality and to remove cancerous tumors from individuals, treatments such as surgery, chemotherapy, radiation, and/or targeted hormone therapy are administered (Andre et al., 2006). Moreover, patients who underwent chemotherapy have reported changes in taste preference before treatment (Mattes et al., 1987). Different interactions between learned food aversion and basic side effects of chemotherapeutic drugs can limit what a person wants to eat and can alter taste (Mattes et al., 1987).

5 basic tastes

Based on previous research, Kim et al. (2019) decided to investigate how cancer treatment plays a role in appetite reduction and change in taste preference. In order to test this question, the authors administered taste detection thresholds and recognition thresholds and compared the results between breast cancer patients and healthy subjects (control group) for sweet, salty, bitter, and sour solutions. The taste detection threshold is the lowest point at which one can distinguish the solution from water, and the recognition threshold is the lowest concentration that one can recognize and correctly identify the solution (Keast and Roper, 2007). If one has high sensitivity to a specific taste, then there will be reduced detection thresholds and recognition thresholds of that taste, and vice versa. The changes in taste thresholds and food preferences were monitored before and during treatment in the breast cancer patient group.

Both detection and recognition thresholds were measured in both the experimental and control group at baseline. The baseline data showed that the experimental group had lower sweet and salty detection and recognition thresholds and higher sour recognition threshold compared to the control group. The bitter thresholds (detection and recognition) were similar between both groups. The results of this study showed that as treatment progressed, the detection thresholds and recognition thresholds in breast cancer patients for sweet declined significantly compared to the threshold at baseline. The other tastes’ thresholds (detection and recognition) were not affected. For food preference, at baseline and during treatment, the patients had a consistent preference for mild and soft dishes (Kim et al., 2019).

Taking these results, Kim et al. (2019) concluded that at baseline, sensitivities to sweet, salty and sour were different in breast cancer patients compared to healthy individuals. Furthermore, as cancer treatment progressed, sensitivity to sweet increased and the other tastes were unaffected when compared to baseline. The results provide useful information to better understand what cancer patients can be sensitive to in regards to food. Overall, this information can be used to accommodate them so that their food intake can increase even during treatment to lower malnutrition rates commonly seen in cancer patients.(Kim et al., 2019).

I found this paper quite intriguing because it showed how certain conditions in life can impact what you do or don’t want to consume, therefore changing one’s taste preference. I never took the time to think about how changes in taste preference can impact health in several ways. There are so many other fields to explore preferential changes in taste anywhere spanning from general aging to food neophobia in autism spectrum disorders. Wow, who would have that a simple activity would unravel such a deep avenue of thought?!


References

Andre, F., Mazouni, C., Hortobagyi, G. N., & Pusztai, L. (2006). DNA arrays as predictors of efficacy of adjuvant/neoadjuvant chemotherapy in breast cancer patients: Current data and issues on study design. Biochimica et Biophysica Acta (BBA) – Reviews on Cancer, 1766(2), 197–204. https://doi.org/10.1016/j.bbcan.2006.08.002

DeSantis CE, Bray F, Ferlay J, Lortet-Tieulent J, Anderson BO, Jemal A (2015) Cumulative     logistic regression with food preference score as an ordinal variable was used to         compare the preference of BC patients and CTRLs. The analyses were adjusted for        age.1.International Variation in Female Breast Cancer Incidence and Mortality RatesCancer Epidemiology, Biomarkers & Prevention 24 (10):1495–1506

Keast, R. S. J., & Roper, J. (2007). A Complex Relationship among Chemical Concentration,       Detection Threshold, and Suprathreshold Intensity of Bitter Compounds. Chemical      Senses,32(3), 245–253. https://doi.org/10.1093/chemse/bjl052

Kim, Y., Kim, G. M., Son, S., Song, M., Park, S., Chung, H. C., & Lee, S.-M. (2019). Changes in taste and food preferences in breast cancer patients receiving chemotherapy: A pilot study. Supportive Care in Cancer. https://doi.org/10.1007/s00520-019-04924-9

Mattes, R. D., Arnold, C., & Boraas, M. (1987). Learned food aversions among cancer     chemotherapy patients. Incidence, nature, and clinical implications. Cancer, 60(10),2576–2580. https://doi.org/10.1002/10970142(19871115)60:10<2576::AID           CNCR2820601038>3.0.CO;2-5

Images

https://www.france-export-fv.com/Chips-Ketchup-Lays/en

https://www.france-export-fv.com/epages/6449c484-4b17-11e1-a012-000d609a287c.sf/en_US/?ObjectPath=/Shops/6449c484-4b17-11e1-a012-000d609a287c/Products/LP1269%5B2%5D

https://www.france-export-fv.com/epages/6449c484-4b17-11e1-a012-000d609a287c.sf/en_US/?ObjectPath=/Shops/6449c484-4b17-11e1-a012-000d609a287c/Products/LP1269%5B8%5D

https://www.yummylixlollipops.com/food-for-thought-the-5-basic-taste-categories/

https://en.wikipedia.org/wiki/Pinkwashing_(breast_cancer)

Walk-a-holic

Google Map directions of the 5-minute walk from the ACCENT center to Pause Café.

“It’s a 20-minute walk,” sighed my American friends, complaining that it was “too long.” It was our first week in Paris on our study abroad program, and we were planning on going to a café. After Google maps indicated that the metro stop was far from the original café, we ended up going to Pause Café. It was on the corner of the street near the ACCENT center, where our daily classes are held.


Image of Pause Café.

I was shocked by the lack of energy that we had. Looking around us, Parisians were walking from place to place without breaking a sweat. Walking for twenty minutes, even thirty, was typical for a Parisian. This got me thinking, how different would my life be if I lived in Paris. In Atlanta, shops and restaurants were far apart, sidewalks were narrow, and the city was difficult to explore without a car. But in Paris, everything was nearby, and sidewalks were wide. If I were to walk this much every day for the rest of my life, how would that impact my health?

Exercise is known to have many health benefits. A fact that has been ingrained in my mind since elementary school. What I knew was that exercise could prevent heart attacks and diseases, but not its effect on the brain.

Researchers show that exercise improves memory, specifically our memory of certain places and events (Cassilhas et al., 2016). The anterior hippocampus provides us with the ability to imagine our house and move around our neighborhood (Zeidman and Maguire, 2016). As we get older the hippocampus decreases in volume resulting in increased forgetfulness (Raz et al.,2005). However, there may be a way to halt those effects and possibly reverse them.

Erickson et al. (2011), reveal in their study that physical exercise improves our long-term memory, specifically our navigational memory. By exercising 3 times a week for one-year, participants had an increase in the volume of their anterior hippocampus. However, participants who did not exercise had a decreased anterior hippocampal volume. Overall, the study showed that only the decreased volume in the anterior hippocampus can be reversed with exercise, but not other parts of the hippocampus. This is a well-designed experiment because 120 participants were involved in the study, which makes the results more applicable to the general public by representing different types of people in the population. The differences in the size of the anterior hippocampus can be better observed and statistically tested with this large number of participants. Further, by testing participants prior to the exercise protocol, after 6 months, and after one year, we can look at the effects of exercise on the anterior hippocampal volume both in the short-term and long-term.

Graphs of the increase in the volume of the anterior hippocampus for the exercise group (blue line) compared to the decrease in the volume of the anterior hippocampus for the control (red line), evident in both the left hemisphere and the right hemisphere of the hippocampus.

Writing this now, I regret missing that 20-minute walk because I now know that a little exercise every day goes a long way in improving my memory. This leaves me wondering, is there a certain time frame when I should be exercising after learning new material?

Researchers performed a study to test whether there is an appropriate time to exercise after learning to improve memory recall (Van Dongen et al., 2016). Participants were assigned into three groups; those who exercised immediately, those who exercised after 4 hours and those who did not exercise. They learned to associate a certain object with a location (refer to image below).The researchers then asked the participants to recall that association. The results showed that exercising 4 hours after learning instead of immediately after enhanced participant’s ability to remember those associations compared to those who did not exercise. Hence, properly timed exercise can enhance long-term memory. The researchers strengthen their conclusion by controlling for problems that could affect the results.Such as having half the participants perform the task at 9AM, while the other half perform it at 12PM. This accounts for the differences in performance at different times of the day, which ensures that improvement in memory recall is occurring due to exercise.

Image of task protocol: associating an object with a location. The orange box represents the study phase, while the blue box represents the testing phase.

So, my elementary school teacher was right after all. Exercise is important for a healthy heart and, as it turns out, a healthy memory. Not only does this motivate me to exercise more often, but also, these studies give me hope for new intervention methods for patients with memory recall deficits. An example would be Alzheimer patients, who struggle with navigating the world (Weller et al., 2018). Another would be patients with major depressive disorder, who have memory impairments in encoding and recalling information (Gourgouvelis et al., 2017). It is cases like these that highlight the importance of understanding the impact of exercise on memory.

Now, when my friends and I have the option between using the metro or walking for 20-minutes, we choose the latter. Living in Paris for 4 weeks today, I have assimilated with the Parisian way of life. I am now able to walk in Paris for hours without the slightest soreness in my legs. It has become my new way of life.


References:

Cassilhas, R. C., Tufik, S., & de Mello, M. T. (2016). Physical exercise, neuroplasticity, spatial learning and memory. Cellular and Molecular Life Sciences, 73(5), 975-983.

Erickson, K. I., Voss, M. W., Prakash, R. S., Basak, C., Szabo, A., Chaddock, L., … & Wojcicki, T. R. (2011). Exercise training increases size of hippocampus and improves memory. Proceedings of the National Academy of Sciences, 108(7), 3017-3022.

Gourgouvelis, J., Yielder, P., & Murphy, B. (2017). Exercise promotes neuroplasticity in both healthy and depressed brains: an fMRI pilot study. Neural plasticity, 2017.

Raz, N., Lindenberger, U., Rodrigue, K. M., Kennedy, K. M., Head, D., Williamson, A., … & Acker, J. D. (2005). Regional brain changes in aging healthy adults: general trends, individual differences and modifiers. Cerebral cortex, 15(11), 1676-1689.

Van Dongen, E. V., Kersten, I. H., Wagner, I. C., Morris, R. G., & Fernández, G. (2016). Physical exercise performed four hours after learning improves memory retention and increases hippocampal pattern similarity during retrieval. Current Biology, 26(13), 1722-1727.

Weller, J., & Budson, A. (2018). Current understanding of Alzheimer’s disease diagnosis and treatment. F1000Research7.

Zeidman, P., & Maguire, E. A. (2016). Anterior hippocampus: the anatomy of perception, imagination and episodic memory. Nature Reviews Neuroscience, 17(3), 173.

The Ego in Architects

Beauty is found everywhere in Paris. From the art museums, to the local gardens, to the towering landmarks across the city, it is impossible to not have Parisian beauty in your sight at all moments throughout the day. It is hard to imagine that at one point in time, the sights that seem so breathtaking were once not there; once upon a time, there were no identifiable landmarks along the cityscape, just gardens and houses composing the city. While imagining what older versions of Paris may have looked like, I thought back to some of my favorite sights that I have seen: Sacre-Couer, Arc de Triomphe, and (of course) the Eiffel Tower. While thinking of these internationally famous landmarks, I began to wonder why. Why were they made? Why were they made the size they are? Why were they made of certain material? Why are some more ornate than others? I then realized that the answers to these questions pertain more toward the architects of such monuments and not the monuments themselves. As I pondered the history of these architects, I started to realize the amount of pride they must have had from their accomplishments. I then began to question the ego (self-defined as a sense of self-esteem/pride) of these architects and to what role did their pride impact the design of their monuments?

The Eiffel Tower, Arc de Triomphe, and Sacre-Couer

To first understand the role of ego in architects, it is important to first understand the role of ego in a general person. Rizzolatti et al. (2014) explored the relationship between neuroscience and ego. According to their report, the link between ego and the brain is a network of brain regions that are highly active at rest and are non-active during goal-directed thinking, called the default-mode network (DMN). The DMN controls and suppresses the activity of brain structures that receive information from brain regions that are in charge of motivation, as well as moderates information from the external world (Rizzolatti et al., 2014). While this study cannot conclusively state that the DMN is responsible for ego (as there was no actual research performed in their article), since ego is a human construct, it does convince me that it is the closest neural mechanism for ego and/or pride. So, since the DMN processes motivation, is involved in goal-directed thinking, and factors in information from the world we live in, it seems reasonable to conclude that the DMN functions as the neurobiological mechanism for ego which deals with one’s sense self-esteem in relation to other’s in their environment.

Location of DMN in adult brain

As for architects, one study has shown that the creative aspect of an architect’s mind leads to a strengthened ego, or in other words, an inflated sense of self-esteem (Fodor, 1995). In this study, participants were asked to design an engineering solution to the question of how to water a dog while frequently gone from home. The participants were then graded based on personalities, in which the more creative individuals scored higher on ego strength. This inflated sense of ego leads to a psychotic-like behavior that favors creative performance in finding solutions to difficult engineering problems, a quality that is favored in a renowned architect (Fodor, 1995). While the study by Fodor did give insight into the reward mechanisms of ego, it offered little biological evidence for the existence/prevalence of ego, necessitating further research.

Upon further investigation, I found one study where researchers performed an fMRI on participants as they recalled memories where they felt prideful, meaning they had a sense of ego (Roth et al., 2014). In this study, they discovered that during feelings of pride, the left amygdala (brain region responsible for emotions and memory) was significantly activated, as was the left anterior insula (brain region responsible for emotional experiences). These feelings of pride were also correlated with an increased rewarding/pleasurable experience. It was helpful how in this study they used neutral imagery in between moments where pride (or shame) could be recalled, ensuring that there would be clear results for which parts of the brain are, indeed, activated in response to pride  (Roth et al., 2014). Based on their results, it may mean that when these great architects resolved their engineering feats, they activated brain regions responsible for subjective emotional experiences and felt an increase in personal reward, perhaps leading these architects to build to new heights to achieve this same feeling each time they completed a project. Additionally, other areas of the brain are rewarded when seeing pleasurable architecture; regions of the brain such as the parahippocampus (responsible for memory retrieval) show that past architectural experiences play a role in the reward circuitry (Coburn et al., 2017). This may be interpreted that as an architect gains experience, they may need to out build their previous work, leading to a compulsion to build higher, wider, and more grandiose than ever before. It was beneficial for Coburn et al. (2017) to include neurobiology from all senses (motor, auditory, visual, etc.) however, the most convincing piece of evidence for the role of ego in the construction of architecture lies in their explanation of the parahippocampus which allows for a unique drive to “one-up” one’s self.

Image of brain highlighting the location of the insula and amygdala

So, next time I look up at the Eiffel Tower from my apartment window or look back on my pictures at Sacre-Couer, I will know that the brilliant architects responsible for these masterpieces had a reward circuit in their brain pushing them to go past their previous boundaries and build more robust pieces of architecture than before. Who knows, if these architects were still alive, they may have already built a more iconic landmark for Paris than the Eiffel Tower or Arc de Triomphe. Only time will tell how far future architects will push themselves (and their egos) in the city of Paris.

Map of famous Paris monuments


Works Cited

Rizzolatti, G., Semi, A. A., & Fabbri-Destro, M. (2014). Linking psychoanalysis with neuroscience: The concept of ego. Neuropsychologia55, 143-148.

Roth, L., Kaffenberger, T., Herwig, U., & Brühl, A. B. (2014). Brain activation associated with pride and shame. Neuropsychobiology69(2), 95-106.

Coburn, A., Vartanian, O., & Chatterjee, A. (2017). Buildings, beauty, and the brain: a neuroscience of architectural experience. Journal of Cognitive Neuroscience29(9), 1521-1531.

Fodor, E. M. (1995). Subclinical manifestations of psychosis-proneness, ego strength, and creativity. Personality and Individual Differences18(5), 635-642.

Image 1: my personal photo

Image 2: google images http://dmangus.blogspot.com/2018/06/neuroscience-default-mode-network.html

Image 3: google images https://journals.plos.org/plosone/article/figures?id=10.1371/journal.pone.0201772

Image 4: google maps screenshot

Dutch vs. French: Who is happier?

This weekend I had the opportunity to visit Amsterdam with some friends! We explored, went out, and soaked up the Dutch culture as much as we could in one day. While we were there, the environment, or “vibe,” was noticeably different in Amsterdam compared to what I have observed during my last three weeks in Paris. Dutch people seemed to be happier and more welcoming compared to the French.

Gorgeous Amsterdam

This first indication that Dutch people are nicer was that our taxi driver was loud, happy, and making jokes with us. During the ride, he was asking where we were from, giving us advice, and telling us himself how people are happy here. Even throughout the trip, we came across numerous people who would actually smile at us while walking! I kept thinking to myself, “Wow, I can smile here and not get a sketchy response back!” People would talk to us, joke with us, and welcome us into their city with open arms. One man even came up to us when we looked confused to ask if we needed help to get where we needed. It was almost comforting to be around these people because I got that taste of America during my time in Amsterdam.

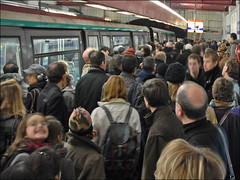
Meanwhile in Paris, people seem to be serious and in the zone. The crammed metro rides and the stereotyped city life really becomes apparent here in Paris. Although most people are nice and helpful, the impression that they give off seems cold and rigid. Quite honestly, they seem unamused with all the Americans that are in their city. Constantly, people are crammed and trying to get through by pushing and shoving to get where they need to go. With a “pardon” here and there, the Parisian way of life seems more stressful than the seemingly laid back Dutch culture.

Besides the mood that I am interpreting based on my interactions with both groups of people, the Dutch people also seem to be happier. When comparing overall mood of people in these two cities, I assume that people in Amsterdam seem to be happier than people in Paris. I may be completely on a whim here, but I really wonder what kinds of experiences and events can shape people’s moods. Although it is a precarious topic, I wonder if the legalization of marijuana attributes to the better mood and happiness in Dutch people, and if the long-term use can results in something detrimental to mental health.

Cannabis is used to enhance mood and at times quality of life (Fischer et al., 2015). A study analyzed an Australian cohort over time to study outcomes of the people. Quality of life, happiness, satisfaction and socio-demographic characteristics were taken into consideration when analyzing. The results provided by this study showed that frequent cannabis use did not enhance quality of life, and it was actually associated with low quality of life at 21-years old and up (Fisher et al., 2015).

Another study by Bruijnzeel et al. (2019), they authors were studying rats and how emotional behavior or cognitive function can change from adolescence to adulthood. The rats were exposed to tetrahydrocannabinol (THC) or cannabis smoke with increasing doses. Once the rats reached adulthood, anxiety-like behavior, depressive like behavior, and cognitive function were assessed. The results showed that neither THC nor cannabis smokes during adolescence produced significant amounts of alterations in adult rats after the cannabis was abstained.

One study even compared synthetic cannabinoid use with natural cannabis use and their respective cognitive outcomes. The results showed that synthetic cannabinoid users have a higher likelihood of drug abuse, sleep problems, and other psychological problems compared to natural cannabis users (Mensen et al., 2019). Additionally, adolescents cannabis users seem to be more vulnerable to changes in the brain compared to adult cannabis users (Gorey et al., 2019).

All of these papers can be synthesized to conclude that cannabis use does not directly affect long term happiness, especially of an entire culture. It is important to consider that cannabis use, although legal in some places, can be dangerous long term. For example, grey matter volume differences can arise, especially during the vulnerable adolescent stage of life (Orr et al., 2019). I think that some people may seem happier because of alleged cannabis use (purely based off of assumption), but the research did not conclude that the use of marijuana is the direct cause of a seemingly happier society. Based on my literature search, there seems to be a fine line when it comes to using cannabis because there are still long term cognitive changes that can interfere with life (Akram et al., 2019). Although my question and assumption was not answered how I thought it would, it was interesting to see how variable cannabis consumption can be. From this, I still consider the Dutch to be happier than Parisians. However, maybe I am not giving the Parisians the benefit of the doubt, and maybe they are equally happy! We may never know the answer to that question.

Happy Tourists!


References

Akram, H., Mokrysz, C., & Curran, H. V. (2019). What are the psychological effects of using synthetic cannabinoids? A systematic review. Journal of Psychopharmacology, 33(3), 271–283. https://doi.org/10.1177/0269881119826592

Bruijnzeel, A. W., Knight, P., Panunzio, S., Xue, S., Bruner, M. M., Wall, S. C., … Setlow, B. (2019). Effects in rats of adolescent exposure to cannabis smoke or THC on emotional behavior and cognitive function in adulthood. Psychopharmacology. https://doi.org/10.1007/s00213-019-05255-7

Fischer, J. A., Clavarino, A. M., Plotnikova, M., & Najman, J. M. (2015). Cannabis Use and Quality of Life of Adolescents and Young Adults: Findings from an Australian Birth Cohort. Journal of Psychoactive Drugs, 47(2), 107–116. https://doi.org/10.1080/02791072.2015.1014121

Gorey, C., Kuhns, L., Smaragdi, E., Kroon, E., & Cousijn, J. (2019). Age-related differences in the impact of cannabis use on the brain and cognition: a systematic review. European Archives of Psychiatry and Clinical Neuroscience,269(1), 37–58. https://doi.org/10.1007/s00406-019-00981-7

Mensen, V. T., Vreeker, A., Nordgren, J., Atkinson, A., de la Torre, R., Farré, M., … Brunt, T. M. (2019). Psychopathological symptoms associated with synthetic cannabinoid use: a comparison with natural cannabis. Psychopharmacology. https://doi.org/10.1007/s00213-019-05238-8

Orr, C., Spechler, P., Cao, Z., Albaugh, M., Chaarani, B., Mackey, S., … Garavan, H. (2019). Grey Matter Volume Differences Associated with Extremely Low Levels of Cannabis Use in Adolescence. The Journal of Neuroscience, 39(10), 1817–1827. https://doi.org/10.1523/JNEUROSCI.3375-17.2018

Images

Scholar Blogs and my own images

L and R: Brain and Politics

Do you hear the people sing? Singing a song of angry men? It’s the music of the yellow vests who shut down subway stops on weekends.

As dedicated as I have been to eating Saturday brunch, the yellow vests (gilets jaunes to the French) have been just as dedicated to convening on Saturday afternoons to protest. The yellow vests are a French populist group mostly made up of members of the working and middle classes who express frustration about slipping standards of living. For the past few months since October 2018, the yellow vests have been showing up every weekend in major Paris locations to protest for lower fuel taxes, redistribution of wealth, an increase in minimum wage, and even the resignation of French President Macron (Diallo, 2018). I remember reading throughout the semester New York Times articles about these protests back when I was in America, and it all seemed very removed from where I was at the time. But now, there is no way to forget when every weekend I receive an email from our study abroad program center about the yellow vests’ path of protest for the weekend and have to track what popular tourist areas will be out of commission for the day. Indeed, Les Mis was not all that misleading. It seems that since the beheading of Queen “Let Them Eat Cake,” the French people have not been able to shake the love of a good revolution or protest from their society. But it is definitely not only the French that enjoy political demonstrations; from 1960s UC Berkeley students to my pink knitted hat compatriots, America has a its own unique history with political movements. I wanted to know – what is it about politics that seems so intrinsic and enticing that people are motivated to come out, rain or shine, to walk around and yell collectively??

major sites of closure yellow vest protests have caused

Part of the reason that being a part of a political movement can be so enthralling is the association with a political party that people flaunt. This gives members of the group a sense of belonging, which is a basic human need involving complex emotions of love, pride, and emotional excitement (Jasper, 2011). In America and many other nations, there is a divide between the liberal left and the conservative right. The ideological labels of “left” and “right” have been around since the time Christian symbolism associated right with “liking for or acceptance of social and religious hierarchies” and the left with “equalization of conditions through the challenge of God and prince.” This fundamental difference in political ideology has remained relatively intact throughout the centuries since then (Jost, 2014). While for many year scientists have assumed political orientation to be solely the result of upbringing and environmental factors, there have recently been studies identifying biological influences on individual’s political attitudes. This field of study falls under neuropolitics, or the study of how neuroscience and political science intersect (Schreiber, 2017).

In a 2011 study that tried to elucidate whether brain structure differences could be linked to political associations, the brain region of the anterior cingulate cortex (ACC) was studied. The ACC has connections to both the “emotional” limbic system” and “cognitive” prefrontal cortex of the brain and is involved with conflict monitoring – the task of detecting conflicts in information processing and then signaling when increased cognitive control must be recruited (Yeung, 2013). The 90 young adult test subjects were first asked to self-report their political attitude on a five-point scale ranging from “very liberal” to “very conservative.” Although a simple scale, this self-reported result has been shown to accurately predict voting behavior. Magnetic resonance imaging (MRI) scans that show detailed images of the brain were then taken of each subject to assess differences in volume of ACC. Results of their scans after controlling for age and gender variables showed that increased gray matter volume in the ACC was significantly associated with liberalism. This hinted that individuals with larger ACC may tolerate uncertainty and conflicts better and allow them to hold more liberal views. The same study also looked at the amygdala, which is involved in processing emotional responses such as fear and aggression, to look for links between gray matter volume of amygdala and political ideology. By evaluating amygdala volume and political attitudes, researchers saw there was an increased amygdala volume associated with conservatism, suggesting that conservatives respond to threatening situations with more aggression and have a heightened sensitivity to fear (Kanai et al., 2011).

a. Results showing ACC volume in comparison with political ideology
b. Results showing amygdala volume in comparison with political ideology

Of course, the question of “which came first, the chicken or the egg?” also applies here: are people more inclined to lean a certain political direction based on biologically predetermined brain differences or do people’s political ideology lead to slight but significant changes in brain structure? I would have been interested to hear if the researchers had any thoughts on this or had long-term data comparing subjects to look for correlations that may have helped answer this question. The researchers also mention a stipulation to their results that abstract reasoning and thinking often requires widespread brain regions and cannot be traced back to one specific brain region. Additionally, a recent review of neuropolitics warns people of the “pathologisation of politics” which essentially chalks up political problems into biological deviations (Altermark & Nyberg, 2018). I think this is especially pertinent as weaponizing neuroscience in order to reduce those you do not agree with is not the purpose of studying the brain. Overall, no matter left or right, remember the brain functions best with both working together!


Bibliography

Altermark, N., Nyberg, L. (2018) Neuro-Problems: Knowing Politics Through the Brain. Culture Unbound, 10, 31-48.

Diallo, R. (2018, December 19). Why are the ‘yellow vests’ protesting in France? Al Jazeera, Retrieved from https://www.aljazeera.com/indepth/opinion/yellow-vests-protesting- france-181206083636240.html

Jasper, J.M. (2011) Emotions and Social Movements: Twenty Years of Theory and Research. Annual Review of Sociology, 37, 285-303.

Jost, J.T., Nam, H.H., Amodio, D.M. & Van Bavel, J.J. (2014) Political Neuroscience: The Beginning of a Beautiful Friendship. Political Psychology, 35, 3-42.

Kanai, R., Feilden, T., Firth, C. & Rees, G. (2011) Political orientations are correlated with brain structure in young adults. Curr Biol, 21, 677-680.

Schreiber, D. (2017) Neuropolitics: Twenty years later. Politics and the Life Sciences, 36, 114- 131, 118.

Yeung, N. (2013). Conflict monitoring and cognitive control. In: Oxford Handbook of Cognitive Neuroscience (Ochsner, K. and Kosslyn, S., eds), Oxford University Press (in press).

Image 1: https://www.usnews.com/news/world/articles/2019-02-09/more-violence-in-paris- as-yellow-vests-keep-marching

Image 2: https://www.bbc.co.uk/news/world-europe-46499996 Image 3: Kanai et al., 2011

USA! USA! USA!

The World Cup.  These three words are arguably the most popular in the world – well, maybe it’s “I love you”, but “The World Cup” is probably a close second.  Every four years, the most elite national soccer teams assemble to partake in a tournament viewed by billions worldwide.  It’s an event of immense magnitude, immeasurable spectacle, and the highest stakes in sports.  This year, the FIFA Women’s World Cup is being hosted by France, with multiple games in Paris!  Seeing as I live in the United States, where we haven’t yet fully embraced the beautiful game, it is a rare occurrence to attend high level soccer matches; so, a few days ago, when our class had the unbelievable experience of attending a group-stage match in the 2019 Women’s World Cup between the United States of America and Chile, I was over-the-moon excited.

Faces painted, ready for the game!!

The game did not disappoint, the United States dominated Chile, especially in the first half where they scored three goals, including a super-strike from veteran Carli Lloyd.  However, despite the beat down imposed upon the Chileans, the atmosphere remained lively.  Thunderous chants of “Chi-Chi-Chi Le-Le-Le, ¡Viva Chile!” clashed with shouts of “USA! USA! USA!” for the entire 90 minutes, and with every goal scored by the United States women, the thrill of ensuing victory became more intensely expressed on the players’ faces.

Amazing view to watch the United States take on Chile in the 2019 FIFA Women’s World Cup

While the triumphant screams, hugs between teammates, and big smiles made their emotions evident on the surface, a more complicated biological phenomenon was occurring inside the bodies of the athletes.  In a recent study published in 2015, Drs. Kathleen Casto and David Edwards examined how levels of certain hormones fluctuated during different stages of competition in female soccer players (Casto and Edward, 2015).  Competition, at its heart, is a contest for social status driven by a desire to be superior to an opponent (Casto and Edwards, 2015).  This desire seems to be heavily linked with the neuroendocrine system – a physiological system in which the central nervous system regulates hormone production (Martin, 2001) –  and with three hormones in particular: testosterone, cortisol, and estradiol (Casto and Edward, 2015).  Both testosterone (Carré and Olmstead, 2015) and estradiol (Stanton and Schultheiss, 2007) are related with dominance motivation and aggressive behavior, while cortisol is related with stress (Dickerson and Kemeny, 2004).

This study, conducted by Emory University researchers, analyzed salivary levels of testosterone, cortisol, and estradiol from the Emory University varsity women’s soccer team in five conditions: a baseline condition (three days before a match), before warming up for a match, shortly before the beginning of the match, immediately after the match, and 30 minutes after the match (Casto and Edwards, 2015).  In addition to comparing hormone levels during different parts of the match, levels during both a home game and an away game were analyzed to investigate whether playing in front of an opposing crowd influenced hormone levels (Casto and Edwards, 2015).

A figure depicting the change in hormone levels during different stages of a soccer match (Casto and Edwards, 2016)

When analyzing testosterone levels, the researchers found no significant difference between the athlete’s baseline levels and their levels before warming up (Casto and Edwards, 2015).  However, testosterone levels after completing a warm-up rose 22% from levels before the warm-up (p<0.001) during a home game and 32% (p<0.001) during an away game (Casto and Edwards, 2015).  Immediately following the conclusion of the game, testosterone levels were 19% (p=0.046) higher than during warm-ups at a home game and 18% (p=0.003) higher during an away game (Casto and Edwards, 2015).  30 minutes after the game’s conclusion, testosterone levels dropped 16% for a home game (p<0.001) and 26% for an away game(p<0.001) (Casto and Edwards, 2015).

Like testosterone levels, cortisol levels also displayed variation during different stages of competition.  However, whereas testosterone levels continuously rose from before a warm-up to immediately after competition, cortisol levels were significantly elevated prior to warming up but did not significantly change after a warm-up (Casto and Edwards, 2015).  Cortisol levels peaked immediately after the end of the match, where they were elevated 142% (p=0.001) after a warm-up during a home game and 131% after an away game (p=0.002) (Casto and Edwards, 2015).  30 minutes after a match’s end there were no significant changes in cortisol levels (Casto and Edwards, 2015).  I, for one, find this cortisol data especially surprising because, when I used to play sports, I remember feeling the most stressed immediately before a game, not during it, and, as cortisol is a stress hormone, I would have expected cortisol levels to be at their peak immediately preceding a game.  Estradiol also fluctuated throughout stages of competition, as its levels significantly increased both before and during a warmup (Casto and Edwards, 2015).  However, immediately after competition, estradiol levels significantly decreased and did not show any significant changes 30 minutes after the game (Casto and Edwards, 2015).

Interestingly, when this study statistically compared hormone levels during a home game to those during an away game, there were no statistical differences (Casto and Edwards, 2015).  Maybe home-field advantage is not that big of a deal after all.  Perhaps most surprising to me about this study though, was that the data did not show any significant differences in hormone levels when either winning or losing (Casto and Edwards, 2015).  Another measurement I think the study could have taken for a potentially more in-depth analysis is hormone levels at half-time.  At half-time, players can rest for a few minutes to catch their breath, but, while resting, are getting coached by the manager to make adjustments in preparation for the second half.  Even though the players’ bodies are resting, their brains are still working hard in anticipation of the rest of the game, so it would be pertinent to study hormone levels at half-time.

Ultimately, the research by Casto and Edwards brings to light some fascinating and surprising conclusions about the neuroendocrine system’s activity during physical competition.  Now that I’ve learned a bit more about hormone fluctuation in athletes, I wonder how hormone levels in fans, such as myself, would change while watching a match.


______________________________________________________

References

Carré, J., & Olmstead, N. (2015). Social neuroendocrinology of human aggression: Examining the role of competition-induced testosterone dynamics. Neuroscience, 286, 171-186. doi:10.1016/j.neuroscience.2014.11.029

Casto, K. V., & Edwards, D. A. (2015). Before, During, and After: How Phases of Competition Differentially Affect Testosterone, Cortisol, and Estradiol Levels in Women Athletes. Adaptive Human Behavior and Physiology, 2(1), 11-25. doi:10.1007/s40750-015-0028-2

Martin, J. V. (2001). Neuroendocrinology. In N. J. Smelser & P. B. Baltes (Eds.), International encyclopedia of the social and behavioral sciences (pp. 10585-10588). Retrieved from https://doi.org/10.1016/B0-08-043076-7/03420-3

Stanton, S. J., & Schultheiss, O. C. (2007). Basal and dynamic relationships between implicit power motivation and estradiol in women. Hormones and Behavior, 52(5), 571-580. doi:10.1016/j.yhbeh.2007.07.002


OMG, More Stairs?!?

When I came to Paris, I thought I was prepared for everything: the bakeries, the museums, the landmarks, the culture — but nothing could have prepared me for the walking I was about to do. Unlike the suburban areas around Emory or my hometown of Topeka, Kansas, where a car is considered necessary for most outings, the streets of Paris are easily traversable by foot, and public transportation is much more accessible. And in a city so beautiful, I had a hard time refusing the ease of foot travel. Still, with the recent muggy weather, walking hasn’t felt quite as pleasant. People always say “no pain, no gain,” and I began to wonder what all my walking was doing for me brain-wise.

My steps before and after I came to Paris. As one can see, my steps significantly increased after I came to Paris, May 22th.

Turns out, there’s a lot to be gained from regular aerobic exercise. Consistent research has pointed to the role of physical activity in cognitive function and has grown in volume over the past decade (Soga et al., 2015). General movement has been suggested to contribute to brain plasticity, which in turn facilitates interaction between cognitive and motor functioning (Doyon and Benali, 2005). Furthermore, research has also linked physical activity to academic performance (Castelli et al., 2007). While these results doesn’t necessarily mean that taking up routine walking or running will guarantee better grades or memory, the two do seem to be invariably related.

Amidst this burgeoning research, Colcombe and colleagues decided to research the cortical mechanisms beneath cardiovascular fitness-related changes in cognitive function (Colcombe et al., 2004). Functional magnetic resonance imaging (fMRI) was used to study how changes in fitness might affect the brain. Researchers particularly focused on the anterior circular cingulate (ACC), an area of the limbic system linked to brain structures responsible for sensory, motor, emotional, and cognitive information (Bush et al., 2000).

The study took place in 2 segments, with Study 1 involving high-fit (HF) older adults, and Study 2 involving adults randomly assigned to either a cardiovascular fitness training (CFT) group or a stretching and toning group (control) (Colcombe et al., 2004). All participants in both groups underwent a flanker task in which they filtered and identified incongruent cues (Colcombe et al., 2004). The flanker test allowed researchers to study participants’ ability to filter and respond to relevant information (Colcombe et al., 2004). Researchers then compared cortical mechanisms triggered by incongruent clues to those triggered by congruent ones, to see whether HF adults would demonstrate higher activation in attention- and control-related regions (Colcombe et al., 2004).

fMRI scans of the ACC illustrate activation of different cortical areas in the task-related activity (Colcombe et al., 2004).

Sure enough, fMRI scans supported the study’s hypothesis that older adults with high levels of measured cardiovascular fitness would demonstrate significantly more activation in cortical regions linked with attention selection and control (Colcombe et al., 2004). These cortical regions include the medial frontal gyrus (MFG), superior frontal gyrus (SFG), and superior parietal lobe (SPL) (Colcombe et al., 2004). Significantly less activation was observed in the ACC, which is linked with behavioral conflict and adaptation of attentional control (Colcombe et al., 2004).

One weakness of the study by Colcombe and colleagues is the cross-sectional approach taken in Study 1. Being observational, cross-sectional studies are vulnerable to non-response bias, which can lead to a participant pool unrepresentative of the population (Sedgwick, 2014). Furthermore, data can only be collected during one set period of time, leaving researchers unable to create long-term representations of cause and effect (Sedgwick, 2014). However, it is important to note that longitudinal studies might also be difficult to complete with older participants, due to possible interference from disease or other age-related complications (Sedgwick, 2014). Ultimately, the research by Colcombe and colleagues was important at the time of its publication because it expanded upon existing research regarding the underlying cortical mechanisms of cardiovascular fitness.

More recent research by Brockett and colleagues suggests that physical exercise may contribute to extensive plasticity and increased cognitive functioning (Brockett et al., 2015). Rats who ran for moderate durations of 12 days were able to better discriminate than control rats in a task testing medial prefrontal cortex (mPFC) function, though little difference was seen between both groups in a task testing perirhinal cortex (PRC) function (Brockett et al., 2015). In a second experiment, runner rats took less trials and errors than control sedentary rats to reach criteria for simple discrimination, reversal, extradimensional shift (Brockett et al., 2015). Researchers also tested whether running influences astrocytes, non-neural brain cells that communicate with neurons and suggest links to synaptic plasticity, learning, and memory (Brockett et al., 2015). Co-labelling of astrocytes with visual markers revealed increase in astrocytes cell body area in the hippocampus, mPFC, and OFC (Brockett et al., 2015). These results aligned with data from the behavioral tests, suggesting that physical exercise can enhance cognitive performance in tasks that activate the hippocampus, mPFC, and OFC (Brockett et al., 2015). The lack of significant change to the PRC suggests that routine running lacks observable relation to the PRC. Ultimately, results suggest greater cognitive performance in tasks reliant on the prefrontal cortex, as well as enhanced synaptic, dendritic, and astrocytic measures in several regions. This evidence supports the hypothesis that physical exercise contributes positively to plasticity and cognitive functioning. Together, both papers by Colcombe, Brockett, and their colleagues have contributed to the growing understanding that exercise generally promotes greater cognitive functioning.

Brockett and colleagues’ research has made me wonder how much I would have to run to achieve the human equivalent of a rat’s 12-day regimen. As a student, it’s incredibly easy to get sucked into the grind and become deskbound. But the grind is exactly why brain power is important for the students, and optimizing my brain power in exchange for a few minutes and some physical effort has started to sound like a much better idea than the old me would have thought.

References

Brockett AT, LaMarca EA, Gould E (2015) Physical exercise enhances cognitive flexibility as well as astrocytic and synaptic markers in the medial prefrontal cortex. Public Library of Science ONE 10(5): e0124859. https://doi.org/10.1371/journal.pone.0124859.

Bush G, Luu P, Posner MI (2000) Cognitive and emotional influences in anterior cingulate cortex. Trends in Cognitive Sciences. 4(6):215-222. https://doi.org/10.1016/S1364 6613(00)01483-2.

Castelli DM, Hillman CH, Buck SM, Erwin HE (2007) Physical fitness and academic achievement in third- and fifth-grade students. Journal of Sport and Exercise Psychology 29(2):239-252. https://doi.org/10.1123/jsep.29.2.239.

Colcombe SJ, Kramer AF, Erickson KI, Scalf  P, McAuley E, Cohen NJ, Webb A, Jerome GJ, Marquez DX, Elavsky S (2004) Cardiovascular fitness, cortical plasticity, and aging. Proceedings of the National Academy of Sciences of the United States of America            101(9):3316-3321. https://doi.org/10.1073/pnas.0400266101.

Doyon J, Benali H (2005) Reorganization and plasticity in the adult brain during learning of motor skills. Current Opinion in Neurobiology 15(2):161-167. https://doi.org/10.1016/j.conb.2005.03.004.

Sedgwick P (2014) Cross sectional studies: Advantages and disadvantages. BMJ 348. https://doi.org/10.1136/bmj.g2276.

Soga K, Shishido T, Nagatomi R (2015) Executive function during and after acute moderate aerobic exercise in adolescents. Psychology of Sport and Exercise 16:7-17. https://doi.org/10.1016/j.psychsport.2014.08.010.

Image 1 taken by myself.

Image 2 from Colcombe et al., 2004.

The Art (and Science) of People Watching

After my weekend exploring the Musee du Louvre, going to the Women’s World Cup, and riding my umpteenth trip on the metro, I noticed that my go to activity while I explore is people watching. People watching, in its purest form, is the idea of observing other people in a public setting. We all do it, whether we are aware of it or not, and it has a variety of results from my own experience as a seasoned player.

Location of where the Louvre right next to the Seine River

People watching takes on a different form where you are; you can get away with more than a glance at a sporting event  like the Women’s World Cup than you can in a cramped metro where everyone is trying, and sometimes not trying at all, to look at everything but the five different people close enough to count eyelashes. Even in those situations, you cannot help but take a millisecond scan of your surroundings just in case in you miss out on something compelling.

This is a part of everyday life and a hobby that I do almost daily. We’re doing the opposite of what we usually do when we people watch; instead of blocking out majority of the stimuli we encounter on a daily basis we take the time to take in every detail as it crosses our path. I started to wonder how people watching is so enjoyable despite the cacophony of stimuli we take in when we do this activity.

Main entrance to the Louvre: Prime location for art appreciation and people watching!

It turns out that people watching requires activation in three different brain networks to during people watching (Quadflieg & Koldewyn, 2017). For example, the person perception network (PPN) is a brain network of brain structures that examine a person’s individual appearance and the way they move which is important to decipher an overall person to person encounter (Quadflieg & Koldewyn, 2017). One specific brain area in the PPN that supports the PPN’s overall function is the posterior superior temporal sulcus (pSTS), but it was not explicitly seen that the pSTS was active while observing social interactions until one 2018 study (Walbrin, Downing, & Koldewyn, 2018).

To test the pSTS activation, the researchers asked fifty-five participants to view human like figures in two 8-second scenarios for multiple trials: one scenario had two figures socially interacting and the second scenario had the two figures doing independent activities (Walbrin, Downing, & Koldewyn, 2018). The researchers used fMRIs to compare pSTS activity when the participants viewed social interactions verse when the participants viewed individual actions. After testing, the researchers found that the right pSTS had a significantly higher activation as the participants viewed the figures interacting with each other compared to when the participants viewed figures doing individual activities (Walbrin, Downing, & Koldewyn, 2018).

Graph showing a significant change in percentage signal activation of the pSTS once shown social interactions verse independent actions

It’s great that the researchers recorded pSTS activation from people seeing direct social interaction because it helps focus further directions into how social patterns change when people have conditions that affect the pSTS. The researchers even looked at other brain areas thought to assist in people watching but in a different capacity than just surface level observations of the interaction. The researchers added a control where they examined the temporoparietal junction (TPJ). The TPJ helps in assigning people’s intentions with one another from what we observe, but it does not work on a board scale in analyzing social interactions verse individual interactions like the researchers predicted the pSTS to do (Quadflieg & Koldewyn, 2017).

While this control helped the researchers determine if pSTS functions specifically while viewing social interactions, an experiment looking into nonhuman subjects’ that have areas similar to the pSTS inhibited or lesioned with provide more concrete evidence to the pSTS functioning examining social interactions or people watching.

Nevertheless, it is still interesting how we have multiple brain networks and brain structures involved to help us understand what we are looking at as we scan our surroundings and the people within it.

In my opinion, people watching is a great skill to have especially in places you’ve never been to before. By watching the people around interacting with each other and their surroundings, I’m able to pick up on what’s acceptable and what’s not. Especially in Paris, I’m trying to do everything I can to blend in and not expose myself as the Lost American, a title I still haven’t been able to shake off.

USA vs. Chile Women’s World Cup. The BEST place to people watch: screaming Chilean grandparents, babies decked out in USA memorabilia, cursing in three different languages, and an indescribable energy you have to love

Even so, everyone still has instances where social cues fall through the cracks. It is those times when you realize that you haven’t moved quickly enough when there is a bike riding on the sidewalk as you walked to the Musee du Louvre or you  you’re taking your sweet time trying to get a glimpse of Hope Solo while someone waits patiently to get their new profile picture during half-time, or the numerous other fish out of water experiences that I have encountered in France. Thankfully, I’ve stopped being embarrassed in these situations and tried to do better for the future by sticking my faithful ally in people watching.

Because we have various brain networks like the PPN with brain structures like the pSTS present to determine most beneficial actions to blend in any situation or find most entertaining of scenarios, it’s not hard see why we continue to people watching at the most inopportune times. We have the wiring to help us bounce back from the mistakes we make.

Without the spatial and social awareness that comes from people watching, I would not have the same peculiar but truly fascinating experiences I’ve had throughout Paris. So, I’m keeping my eyes peeled for the next exciting exploration or the next cue that comes my way.

References

Children’s Healthcare of Atlanta. (n.d.). fMRI. Retrieved from https://www.youtube.com/watch?v=3fNf8KX1AlQ

Quadflieg, S., & Koldewyn, K. (2017). The neuroscience of people watching: how the human brain makes sense of other people’s encounters. Annals of the New York Academy of Sciences,1396(1), 166–182. https://doi.org/10.1111/nyas.13331

Walbrin, J., Downing, P., & Koldewyn, K. (2018). Neural responses to visually observed social interactions. Neuropsychologia,112, 31–39. https://doi.org/10.1016/j.neuropsychologia.2018.02.023

Image #1: [Screenshot of the Musee du Louvre]. Retrieved from https://www.google.com/maps/place/Louvre+Museum/@48.8606111,2.3354607,17z/data=!3m1!4b1!4m5!3m4!1s0x47e671d877937b0f:0xb975fcfa192f84d4!8m2!3d48.8606111!4d2.337644

Image #3: [Screenshot of the Figure 2]. Retrieved from https://www.ncbi.nlm.nih.gov/pmc/articles/PMC5899757/

Image #2 and #4 were taken by me

What Colorful Language!

We always see it in the movies: the younger child and the father laying together in the grass, gazing up at the midday sky. She asks what color the sky is, and he says blue without hesitation. Such a simple answer to what is, in reality, such a complex question. Over the past few weeks, to combat my occasional homesickness, I’ve found myself looking up to the sky, wondering if my parents can see the same sky back home in Georgia. When we discussed the colors of the sky in class, it encouraged me to investigate the simple answer to the question: what color is the sky?

Just one example of the types of colorful skies one could witness here in Paris.

The real answer, it turns out, depends on a variety of factors; the time of day, location of the viewer, location of the sun, the viewer’s visual abilities, language, mood, etc. From personal experience, I believe the same sky can be different colors to the same viewer in different states of mind. For example, individuals experiencing sadness have a greater tendency to “focus on the tree instead of the forest” (Gasper 2002), which translates to not seeing the full visual picture and instead fixating on visual detail, such as the shade of one item instead of the collective colors in a room. In a more scientific sense, a red-green colorblind viewer would have a different visual opinion of a sunset than a normally sighted individual. But what about language?

Interestingly enough, language and culture also exert a large influence on color perception; different languages have different words for different colors, and some only have one word for a whole category of colors. The color category perception effect (Zhang 2018) describes this phenomenon in which “people were more likely to distinguish colors from different colors than those that landed in the same area.” Those who speak languages that have more words for different colors would, under this theory, be better able to distinguish various shades than those who speak a language with fewer words for color. Based on this perception of color, two people from different cultures could view the sky in different shades. The figure below displays how the color wheels of the English and Greek lexicon differ due to variations in groupings.

Image result for the color wheelImage result for color wheel in greek

There is evidence that language centers in the brain are activated with color perception; in an experiment performed by Siok et al., when stimuli are observed from different linguistic categories, there is a greater activation of visual cortex areas 2/3 – the areas responsible for color vision. This enhanced V2/3 activity coincided with enhanced activity in the left posterior temporoparietal language region, which suggests a top-down control from the language center to modulate the visual cortex (Siok 2009). In other words, increased activity in language perception areas of the brain correlates to increased modulation of color vision before you’ve had the chance to pay conscious attention (Athanasopoulos 2010).

This is especially relevant in Paris; as an English-only speaker in a world of French speakers, I can’t help but wonder how differences in our color-related vocabulary translate to questions like that of the sky’s color. It is known that language effects sensory perception in its earliest stages (Athanasopoulos 2010), but would learning French color vocabulary change my perception of what colors I see? A previous experiment (Theirry 2009) demonstrated a difference in brain activity for both a native Greek and English speaker, the former of which makes a lexical distinction between light blue (ghalazio) and dark blue (ble). This is shown in the figure below, which demonstrates a greater Visual Mismatch Negativity response for the Greek participant when they were observing a blue stimulus due to greater lexical representation for this color.

A report of differences between speakers of different languages in early color perception. The shaded area represents presentation of a specific marker between 170 and 220 milliseconds post-stimulus. Notice the difference in negative response between Native English and Native Greek for the color blue.

In summary, the influence of language is one often underestimated when considering why we see the colors we do. I believe perception of color is a uniquely integrative experience, combining elements of culture, background, language, personality, and individuality to create specific visuals distinctive to one person. This seems all the more evident in Paris; everything is so new, so fresh and exciting that I cannot help but feel that the very colors of Paris hold something special that I have not seen elsewhere. So what color is the sky? You may be surprised, as I was, to find your answer constantly changes.

Citations:

Athanasopoulos, P., Dering, B., Wiggett, A., Kuipers, J., & Thierry, G. (2010). Perceptual shift in bilingualism: Brain potentials reveal plasticity in pre-attentive colour perception. Cognition, 116(3), 437-443. doi:10.1016/j.cognition.2010.05.016

Gasper, K., & Clore, G. L. (2002). Attending to the Big Picture: Mood and Global Versus Local Processing of Visual Information. Psychological Science, 13(1), 34-40. doi:10.1111/1467-9280.00406

Siok, W. T., Kay, P., Wang, W. S., Chan, A. H., Chen, L., Luke, K., & Tan, L. H. (2009). Language regions of brain are operative in color perception. Proceedings of the National Academy of Sciences, 106(20), 8140-8145. doi:10.1073/pnas.0903627106

Thierry, G., Athanasopoulos, P., Wiggett, A., Dering, B., & Kuipers, J. (2009). Unconscious effects of language-specific terminology on preattentive color perception. Proceedings of the National Academy of Sciences, 106(11), 4567-4570. doi:10.1073/pnas.0811155106

Zhang, J., Chen, X., You, N., & Wang, B. (2018). On how conceptual connections influence the category perception effect of colors: Another evidence of connections between language and cognition. Acta Psychologica Sinica, 50(4), 390. doi:10.3724/sp.j.1041.2018.00390