Vu et al.: Application of geostationary satellite and high-resolution meteorology data in estimating hourly PM2.5 levels during the Camp Fire episode in California

Vu, B.N., Bi, J., Wang, W., Huff, A., Kondragunta, S., Liu, Y. (2022). Application of geostationary satellite and high-resolution meteorology data in estimating hourly PM2.5 levels during the Camp Fire episode in California. Remote Sensing of Environment, 271, 112890.

Science Direct: Link

Particulate matter from wildland fire smoke can traverse hundreds of kilometers from where they originated and result in excess morbidity and mortality. However, estimating PM2.5 levels in and around wildland fires poses many challenges including lack of monitors at or near smoke plumes and temporally coverage since monitors generally obtain daily measurements yet smoke plumes continually change throughout the day due to wind. In this paper, we estimated total PM2.5 concentration during the Camp Fire episode, one of the deadliest wildland fires in California history. We used a random forest (RF) model to calibrate hourly regulatory monitor measurements (AQS maintained by the EPA) and low-cost sensors (PurpleAir) to Geostationary Operational Satellite-16 (GOES-16)’s AOD and fire spot detection variables, High-Resolution Rapid Refresh (HRRR) meteorology, and ancillary variables including land-use, distance to road, and a convolutional layer calculated for each hour. We tried three separate approaches: 1) an AQS-only model; 2) AQS + weighted PurpleAir model; and 3) AQS + weighted PurpleAir + SMOTE model. Synthetic Minority-Oversampling Technique (SMOTE) was applied to enhance and bolster the number of extremely high observations and improve model performance. The AQS-only model achieved and out of bag (OOB) R2 (RMSE) of 0.84 (12.00 μg/m3) and a spatial and temporal cross-validation (CV) R2 (RMSE) of 0.74 (16.28 μg/m3) and 0.73 (16.58 μg/m3), respectively. The AQS + weighted PurpleAir model’s OOB and spatial and temporal CV R2 (RMSE) was 0.86 (9.52 μg/m3), 0.75 (14.93 μg/m3), and 0.79 (11.89 μg/m3), respectively. The AQS + weighted PurpleAir + SMOTE model’s OOB and spatial and temporal CV R2 (RMSE) was 0.92 (10.44 μg/m3), 0.84 (12.36 μg/m3), and 0.85 (14.88 μg/m3), respectively. Results from this study indicate that increased measurements as well as the application of SMOTE not only improves model performance but also residual errors, and may aid in epidemiological studies investigating intense and acute exposure to wildland fire smoke.     


Density Scatter Plot
Density Scatter Plots of spatial and temporal CV from left to right: Top (spatial CVs for AQS-only, AQS + weighted PurpleAir, AQS + weighted PurpleAir + SMOTE); Bottom (temporal CVs for AQS-only, AQS + weighted PurpleAir, AQS + weighted PurpleAir + SMOTE)


Blowout Maps
Prediction Maps at noon on November 16th, 2018. Blowouts from left to right: AQS-only model, AQS + weighted PurpleAir, AQS + weight PurpleAir + SMOTE.


Comparison to true-color composite
Comparison of prediction maps to true-color composites from MODIS instruments.

Geng et al.: Random forest models for PM2.5 speciation using MISR data

Random forest models were developed to predict ground-level daily PM2.5 speciation concentrations in California from MISR fractional AODs and other supporting data such as ground measurements, chemical transport model simulations, land use variables and meteorological fields. Sensitivity tests were also conducted to explore the influence of variable selection on model performance. Results shows that fractional AODs and total AOD have similar predicting power in estimating PM2.5 species if there are sufficient ground measurements and predictor data to support the most sophisticated model structure. Otherwise, models using fractional AODs outperform those with total AOD. PM2.5 speciation concentrations are more sensitive to land use variables than other supporting data such as CTM simulations and meteorological information.

This article was published in Environmental Research Letters in March 2020.


She et al.: Hourly PM2.5 levels during heavy winter episodes in the Yangtze River Delta

In this publication, we quantitatively investigated the feasibility of using the aerosol optical depth (AOD) data retrieved by the Geostationary Ocean Color Imager (GOCI) to estimate hourly PM2.5 concentrations during winter haze episodes in the Yangtze River Delta (YRD). We developed a three-stage spatial statistical model, using GOCI AOD and fine mode fraction, as well as corresponding monitoring PM2.5 concentrations, meteorological and land use data on a 6-km modeling grid with complete coverage in time and space. The 10-fold cross-validation R2 was 0.72 with a regression slope of 1.01 between observed and predicted hourly PM2.5 concentrations. We further analyzed two representative large regional episodes, i.e., a “multi-process diffusion episode” during December 21–26, 2015 and a “Chinese New Year episode” during February 7–8, 2016. We concluded that AOD retrieved by geostationary satellites could serve as a new valuable data source for analyzing the heavy air pollution episodes.


Publication link

Zhou et al.: Compilation and spatio-temporal analysis of publicly available total solar and UV irradiance data in the United States

Skin cancer is the most common type of cancer in the United States, the majority of which is caused by overexposure to ultraviolet (UV) irradiance, which is one component of sunlight. Our group worked with University of Iowa and the National Environmental Public Health Tracking Program at CDC to develop and disseminate county-level daily UV irradiance (2005 – 2015) and total solar irradiance (1991 – 2012) data for the contiguous United States (See intro on CDD Tracking webiste).  These datasets are freely available at the CDC Tracking Portal. Trend analysis also showed that national annual average daily solar and UV irradiances increased significantly over the years by about 0.3% and 0.5% per year, respectively. These datasets can help us understand the spatial distributions and temporal trends of solar and UV irradiances, and allow for improved characterization of UV and sunlight exposure in future studies.

The Full publication link is here.

Bi et al. Impacts of snow and cloud covers on satellite-derived PM2⁠.5 levels

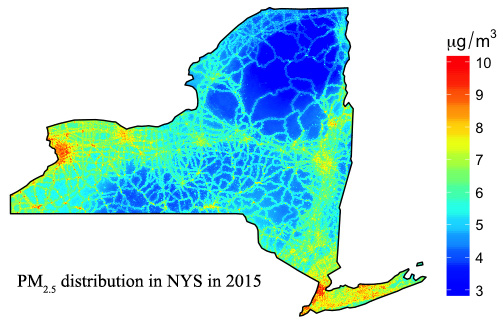
We developed an AOD gap-filling model with the consideration of snow and cloud covers and a PM2.5 prediction model based on the gap-filled AOD to estimate full-coverage and high-resolution PM2⁠.5 in New York State. It indicated the significance of snow fraction in the AOD gap-filling process and demonstrated the ability of the AOD-based prediction model to reflect detailed PM2.5 emission patterns and small-scale terrain-driven features.

Bi, J., Belle, J. H., Wang, Y., Lyapustin, A. I., Wildani, A., & Liu, Y. (2019). Impacts of snow and cloud covers on satellite-derived PM2.5 levels. Remote Sensing of Environment, 221, 665–674. https://doi.org/10.1016/j.rse.2018.12.002

Geng et al. The sensitivity of satellite-based PM2.5 estimates to its inputs: implications to model development in data-poor regions

We conducted comprehensive sensitivity model simulations to investigate the key factors that could affect the performance of satellite-based PM2.5 exposure in data-poor regions including temporal sampling frequency, number of ground monitors,  accuracy of the chemical transport model simulation, and different combinations of the additional predictors.

PubMed Link

EI Link