Authors: Janette Hannam Hayes, Director, OSP Contracts; Sharon Jones, Interim Director, SOT; Valeria Rainey, Strategic Operations Associate, SOT; Jennifer Gore, Assistant Director, RDA
Intent, History and Launch of a Dashboard:
OSP continues to prioritize improving the contracting process to foster better internal reporting, better communication, and more transparency with the research community. With that in mind, the OSP Contracts Group partnered with ORA Research Data Analytics (RDA) and the ORA Strategic Operations and Training team (SOT) to develop the OSP Contracts Dashboard. The Contracts Dashboard is a database platform built within EBI that pulls data from the electronic Contracts Tracking System (ECTS) and Compass to provide the ability to generate robust contracts data to the Research Community.
Following the transition of the Industry Contract Group (ICG) from OTT in 2021, one notable gap was the ability to produce timely and accurate metrics.
The need for a comprehensive Contracts dashboard was initiated.
With the problem identified, the OSP Contracts Group in collaboration with the RDA and the SOT established a business case to remedy the problem. The business case sets out to readily obtain and analyze accurate data in a timely manner as an integral part of process improvement. Creating the dashboard will allow OSP Contracts Group leadership improved visibility to track, analyze, improve daily operations, and collaborate with other leaders. All this subsequently leads to improved internal reporting, better communication, and more transparency with the research community.
Data Integrity Issues & Data Cleanup:
The RDA team identified data integrity issues with the data needed to produce the Dashboard (such as missing, duplicative, and incorrect data). A deep dive cleanup effort of data was undergone in ECTS, Compass and EPEX to ensure accuracy of metrics captured in the dashboard. The clean-up was a collaborative and coordinated effort between the RDA, OSP Contracts leadership and SOT. A retroactive review was conducted with historical data from 2015 to present. Reports were generated to identify data integrity issues; analysis was conducted, and updates made accordingly. Safety guidelines via exception reports were created to ensure continuous improvement monitoring.
Once the data was cleaned, the Dashboard was launched.
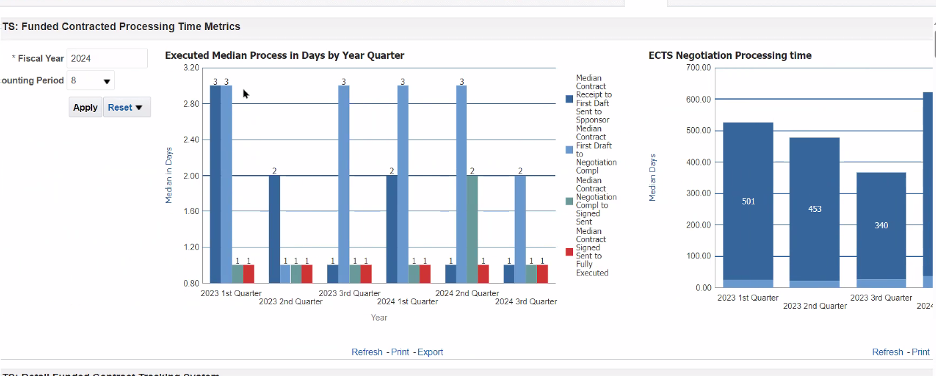
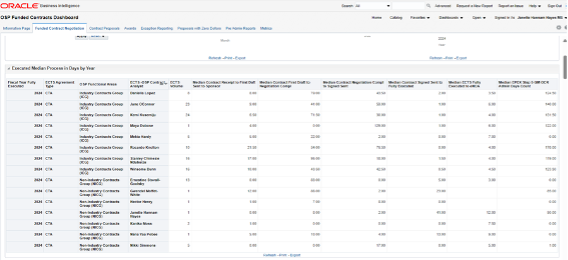
A sample of the type of metrics captured in the Dashboard are:
- # of contracts received (Volume) and processed by type and by team member
- Avg (Turnaround) processing time by team member
- Monthly volume by team member
- Proposed Contracts by proposals $ and Awarded $
Location & Access:
The Dashboard is housed in EBI. Due to the sensitivity of the data contained in the Dashboard, access is limited to: OSP Contracts Leadership, RDA, the WISC- CTO Office.
Summary Page Report available to Schools/Units: Target launch date July 1, 2024
Since access to the Dashboard is limited, there are plans to share the value of Dashboard data with the research community. As such, a cadence summary report can be made available to School/Unit CBOs and any others who are interested in receiving it. The report can be shared with faculty to provide consistent updates on key contract metrics. As an initial launch, the summary report will contain information consisting of:
- Number of agreements received – by month/quarter/fiscal year
- Types of agreements (i.e., Clinical Trials, CDAs, MTAs, etc.)
- Funded agreements TTL dollar value (by month)
- Volume of agreements by industry and non-industry (Teams)
- Turnaround times for clinical trials
If there are other data points and key metrics you would like to see in the summary report, please let us know. Please direct all questions relating to this article, or the OSP Contracts Dashboard to jhannam@emory.edu