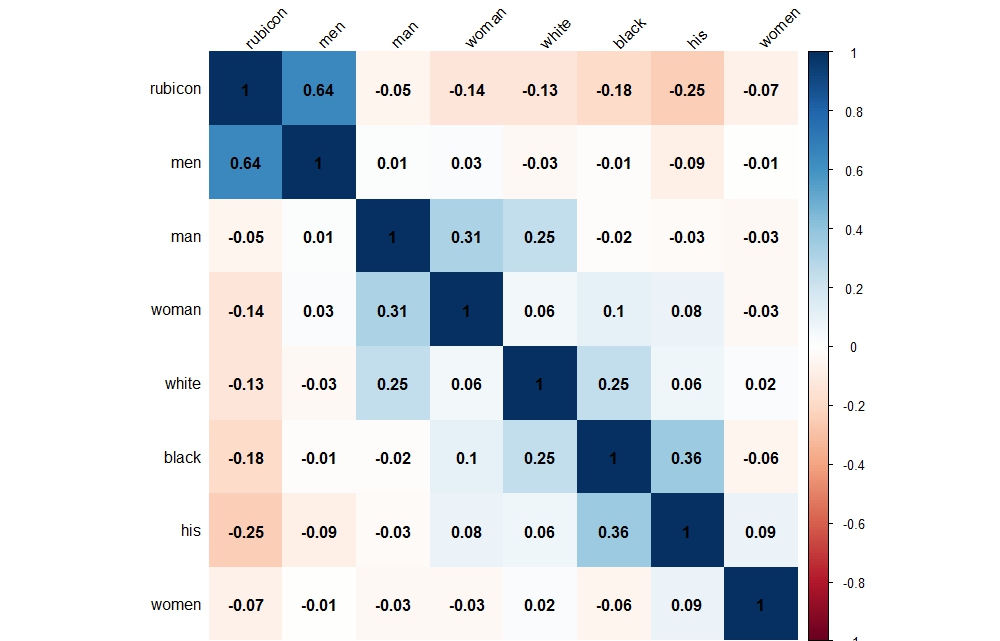
Rubicon and Demographics Correlation Matrix
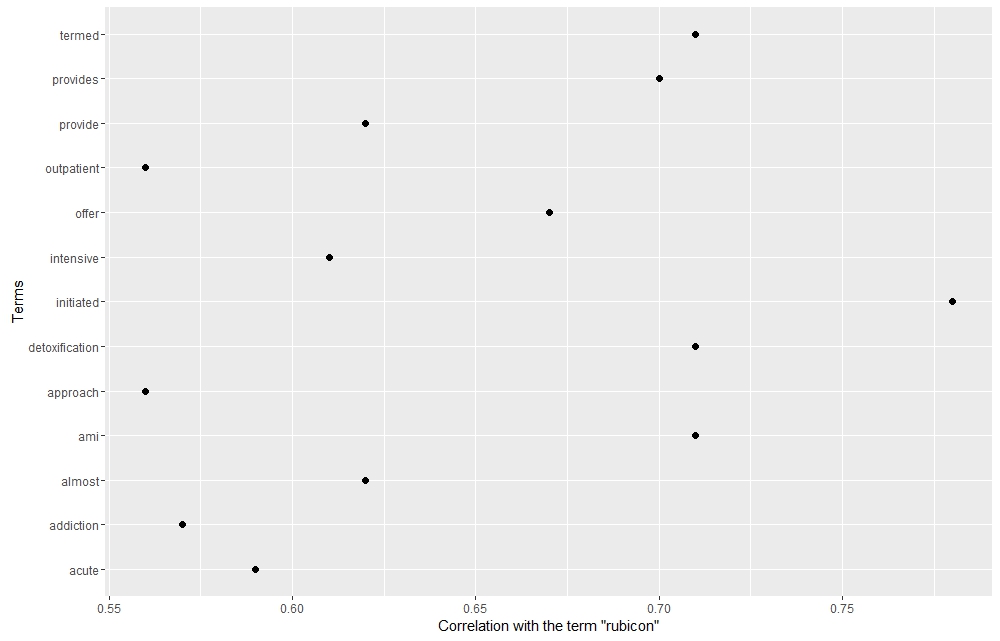
Terms that Correlate Strongly With “Rubicon”
##correlation Matrix code. Start from normalized document term matrix
Library(corrplot)
short.list DTM.norm.mini.df #To get the correlation matrix
cor.matrix.mini round(cor.matrix.mini, 2) ## rounds off at 2 places
corrplot(cor.matrix.mini, method=”shade”,shade.col=NA,tl.col=”black”,tl.srt=45,addCoef.col=”black”,order=”FPC”)#word associations start from DTM
Library(tm)
Library(ggplot2)
findAssocs(DTM, “rubicon”, 0.57)
#build dataframe for plotting
toi <- “rubicon” # term of interest
corlimit rubiconterms Terms = names(findAssocs(DTM, toi, corlimit)[[1]]))
ggplot(rubiconterms, aes( y = Terms)) +geom_point(aes(x = corr), data = rubiconterms, size=2) +xlab(paste0(“Correlation with the term “, “\””, toi, “\””))
ggplot Grob# allows you to mix elements