Rubicon Rehabilitation Center in the Virginia Press 1971-1976
By 1971 Rubicon had become the largest in-patient rehabilitation program in the state of Virginia, maintaining extensive partnerships with the Department of Vocational Rehabilitation, the Medical College of Virginia(MCV), Richmond City Health Department, and the Richmond Public School system. Through its partnership with MCV it became the only federally approved methadone program between Washington D.C. and Miami.1 In a time where the merits and demerits of drug abuse treatment were in constant debate internationally Rubicon became the medium through which newspapers throughout the state of Virginia localized rehabilitation issues. By using the text-mining tools in R and a corpus of 80 newspapers from five different cities in Virginia a glimpse of this conversation can be gained.
The Corpus Over Time
The Danville Register, The Harrisonburg Daily Record, The Norfolk Journal and Guide, The Petersburg Progress Index, The Winchester Star
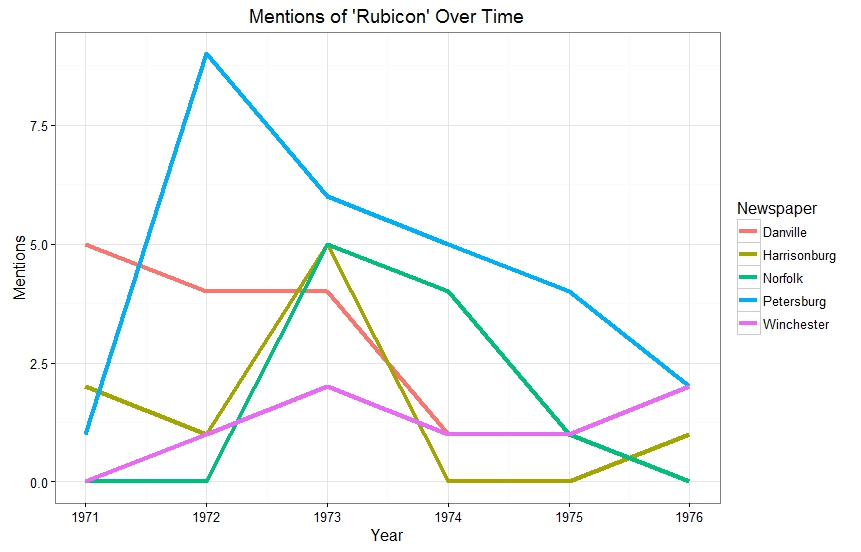
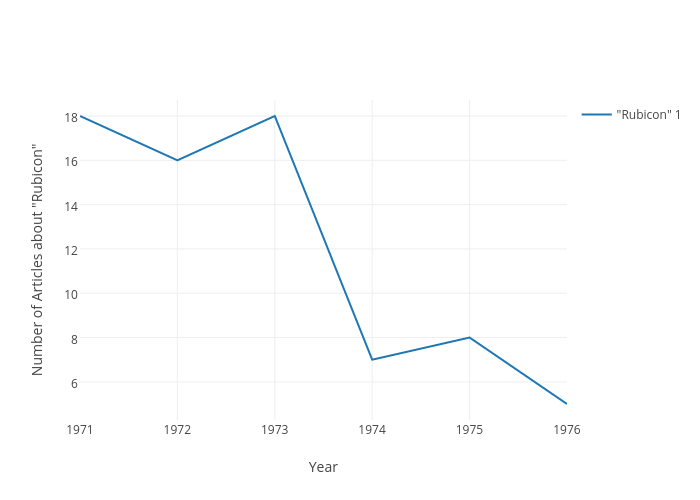
The graph above shows that mentions of Rubicon generally declined over time. This is probably dues to several factor: the decline in novelty, the slowing of intake at Rubicon, and shifting drug control priorities. It also reveals the relationship Rubicon had with Petersburg. Many of Rubicon’s admits were funneled to them through the Petersburg court system. Interestingly enough mentions in the two cities with the Rubicon facilities near there localities drop of in 1973. This is in line with larger statewide drug arrest trends that show a dip in arrests in 1973.
Most Characteristic Words in the Corpus
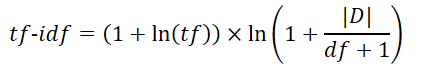
Using TF-IDF(term frequency-inverse document frequency) statistic to extract key terms from the four newspapers that wrote the most about Rubicon can provide a distant look at the semantic difference between newspapers. For more on TF-IDF see Kan Nashida’s blog.
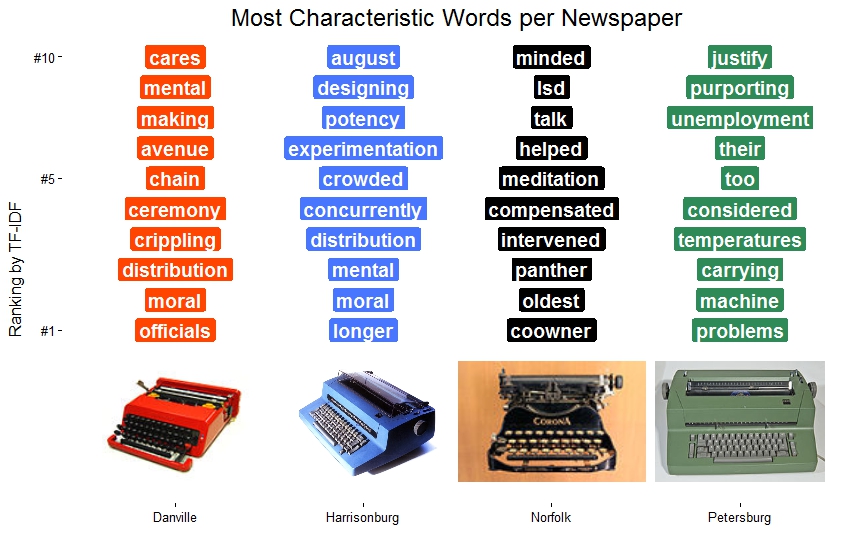
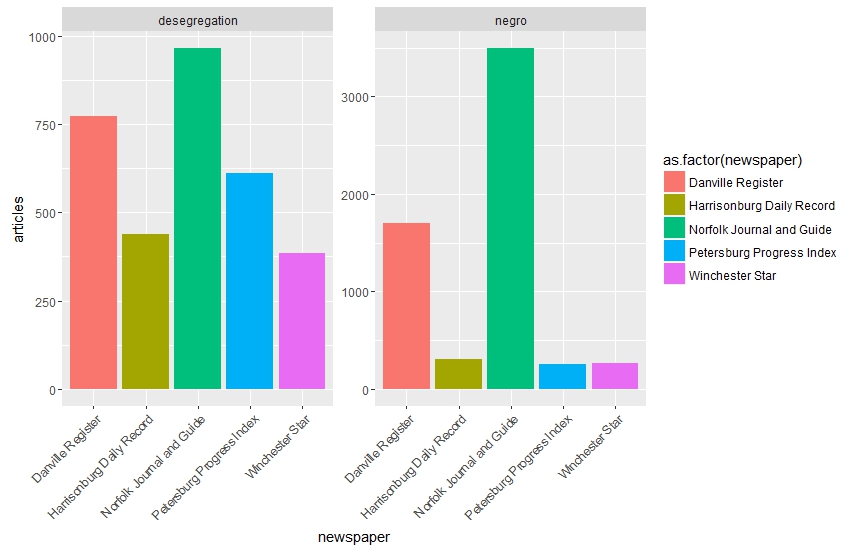
As can be seen TF-IDF produces some interesting results. The Danville newspaper uses words like “cares, “ceremony”, and “morals”, showing an interest in the positive impact of Rubicon. It also uses words like “chain”,”officials”, and “mental” which may reflect an interest in the organizational mechanics of Rubicon. Similarly, Harrisonburg uses words like “experimentation”, “crowded”, and, “designing” that imply and interest in how Rubicon was ran and maintained. The overlap of words between Harrisonburg and Danville may be due to proximity. The two cities were farther away from Rubicon then Norfolk and Petersburg and likely relied on the same AP reports. The Norfolk Journal and Guide is the only historically black newspaper in the corpus and discusses the black panthers more according to the TF-IDF metric. It is also the only newspaper that has a drug word(LSD) in its top ten of most characteristic words. Words like “mediated”, “helped”, and, “intervened” point to the expansion of Rubicon into the Norfolk area in 1973. Words in the Petersburg Progress Index reflect a similar closeness between Petersburg and Rubicon. “Unemployment”, “problems” and the disproportionately frequent use of “their” signify close economic and organizational ties.
Correlations
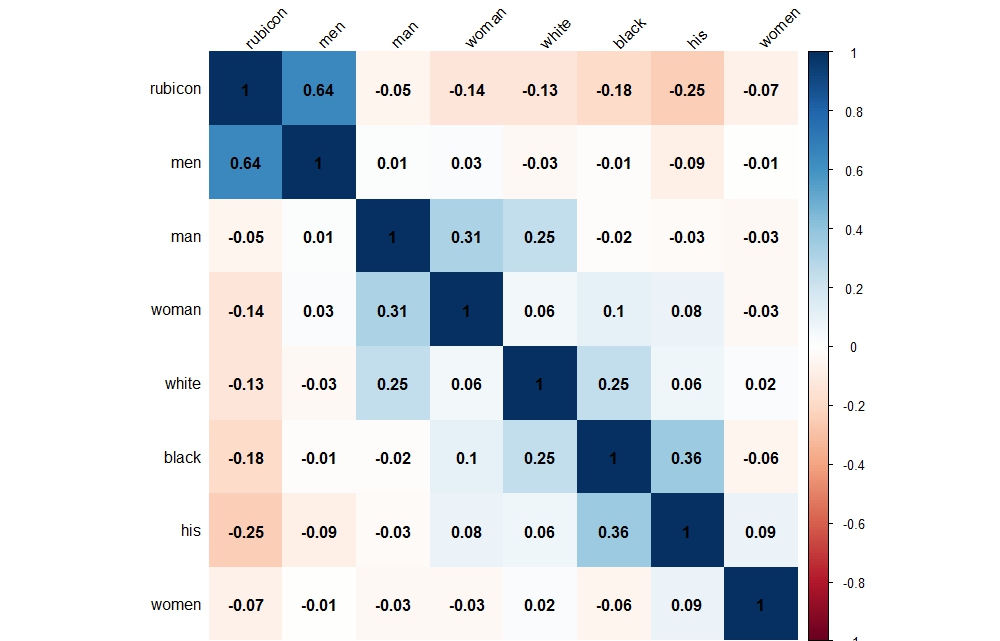
Correlation Matrices are another text-mining tool that can help shed light on Rubicon without a close reading. Correlations measure the strength of the relationship between variables. A correlation <0 indicates a negative relationship while a correlation>0 indicates a positive relationship.
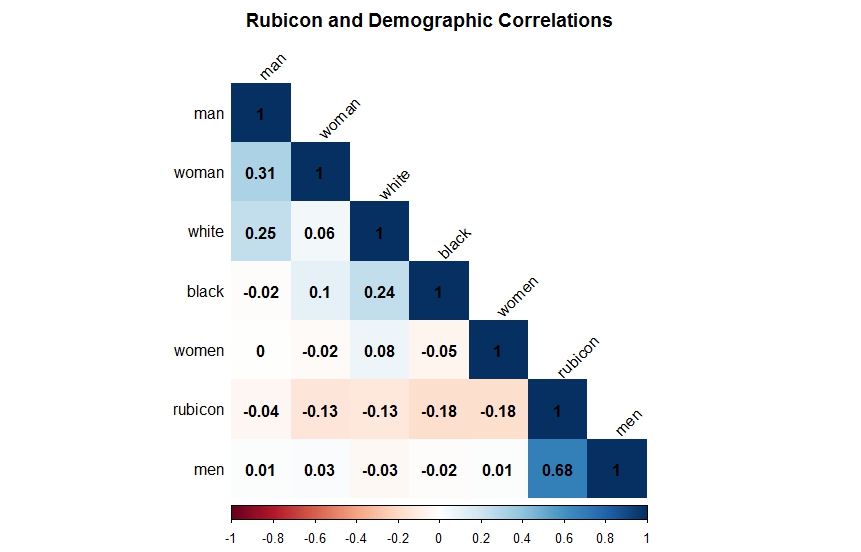
The matrix above shows a close correlation between the word “Rubicon” and the plural “men” across the whole corpus. On the other hand, it also shows a negative correlation between “Rubicon”, and the plural “women”. Surprisingly, race did not play a significant role in the coverage of Rubicon in the newspapers even though it appeared frequently throughout the press during this period.
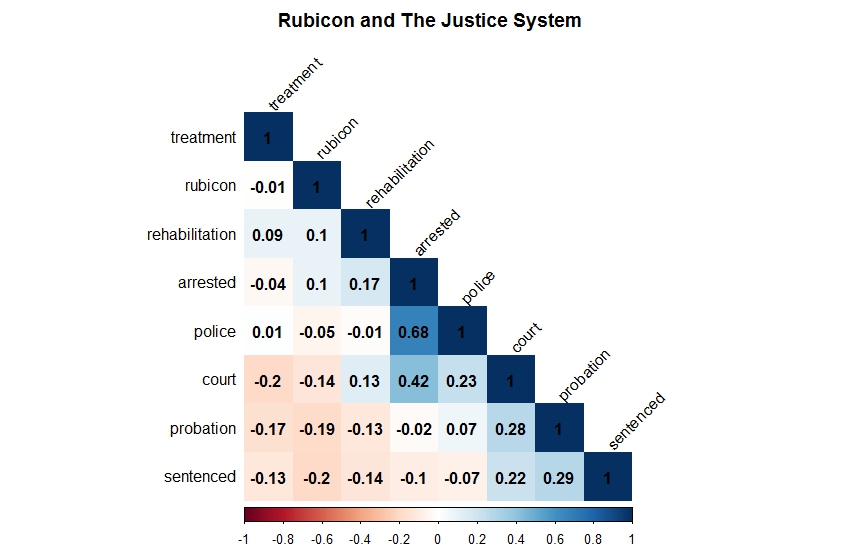
Rubicon’s relationship with the workings of the justice system is a bit more nuanced. Its important to remember that all of the newspapers mention Rubicon. The fact that Rubicon does not correlate highly with “rehabilitation” and “treatment” shows that Rubicon had reached a level of public notoriety that it no longer had to be described using these terms. Even so there is still a positive correlation between it and the words “arrested” and “court.”
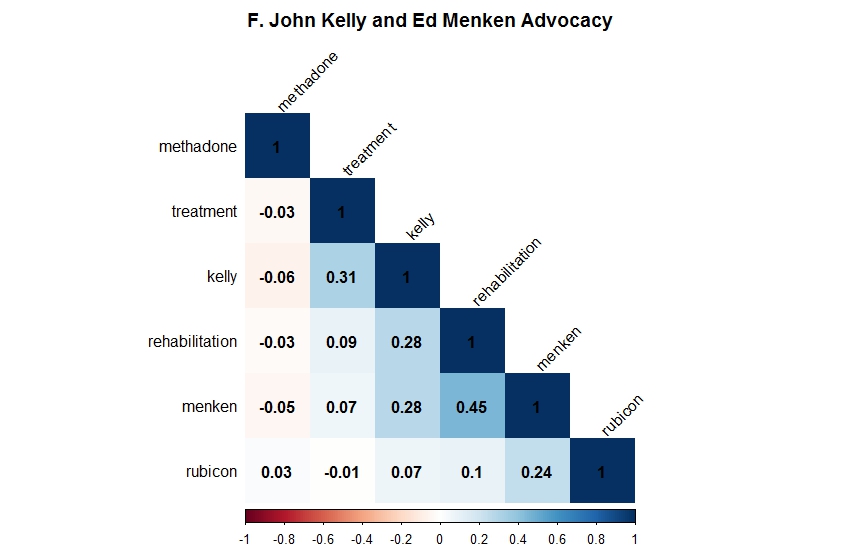
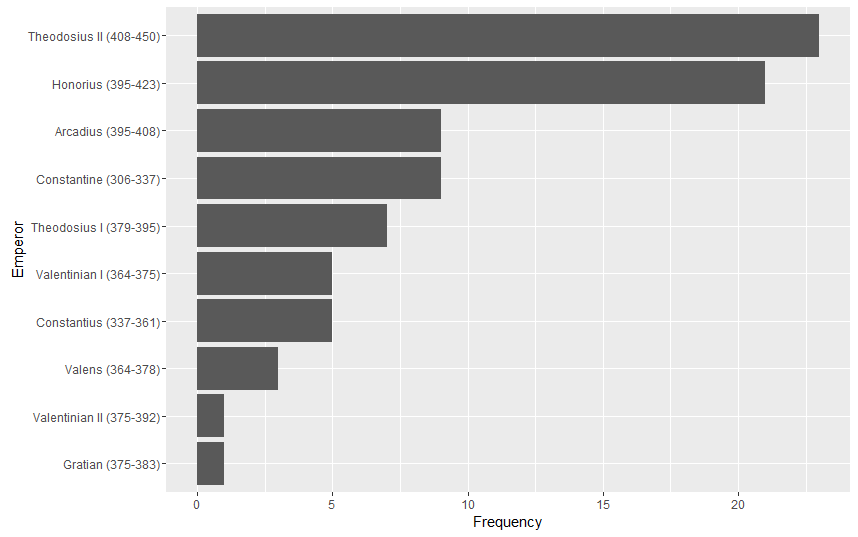
F. John Kelly, the director of the Governor’s Council on Narcotics and Drug Abuse Control, and Ed Menken the director of Rubicon had a sometimes contentious relationship in the press. Menken frequently accused Kelly of taking a soft approach toward drug rehabilitation. The graphic above shows that Kelly correlates more highly with “treatment” but not “rehabilitation” than Menken. This could just be a matter of different word choices between the two after all Kelly is mentioned in 12 different articles while Menken is only mentioned in 6.
The positive correlation between Kelly and Menken denotes the level of dialog between the two. From the view of the frequent newspaper reader Kelly and Menken were locked in constant debate over rehabilitation resources and agendas. This constant pairing would have made Menken seem less like the Director of a private rehab and more like Kelly political equivalent. Another surprise from figure 6 is the lack of correlation between Kelly, Menken, and Rubicon with the word “methadone.” Despite their advocacy for rehabilitation and treatment neither Kelly or Menken wanted to broach the controversial topic of methadone.
Conclusion
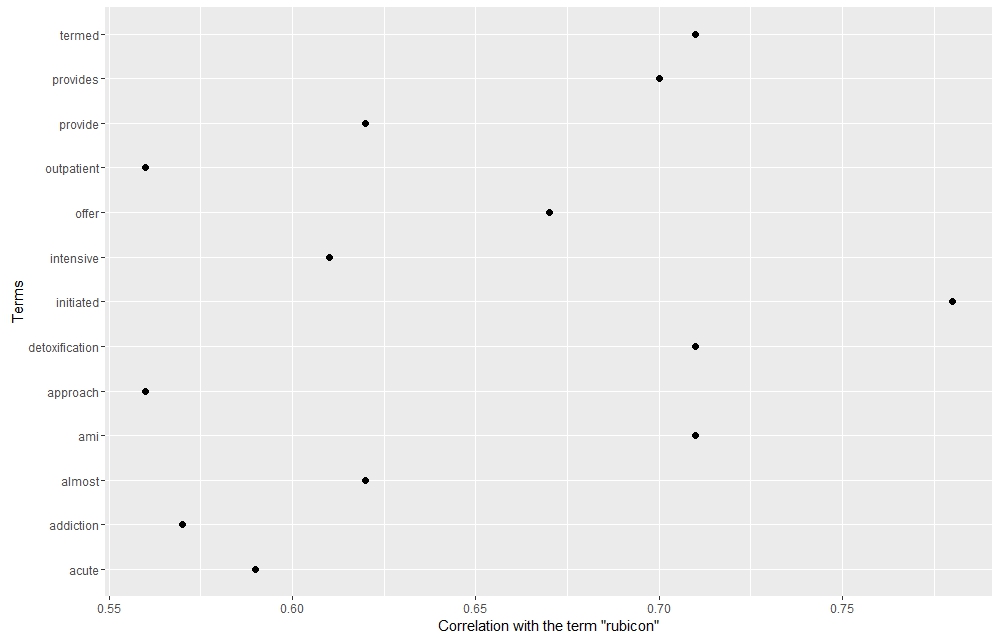
By analyzing the terms that correlate with Rubicon its institutional identity clearly exceeds that of its grassroots activist identity. Clinical terms like “detoxification”, “termed”, “outpatient”, “intensive”, “acute”, “provide”, and “offer” speak the business and medical side of the organization, and perhaps signify its movement toward a rehab ran by medical professionals rather than former addicts. Coverage of Rubicon in the Virginia press neutralized the racial and activist components of the organization, thus helping to perpetuate the image of it as a state institution that both engaged in policy discussions and became a component of the justice system.
Code
library(stringr)
 library(corrplot)
 library(ggplot2)
 Convert Download articles into .txt and place in dataframe
 # folder with article PDFs
 dest <- "C:\\Users\\virgo\\Desktop\\Rubicon"
 # make a vector of PDF file names
 myfiles # convert each PDF file that is named in the vector into a text file
 # text file is created in the same directory as the PDFs
 # use pdftotxt.exe
 lapply(myfiles, function(i) system(paste('"C:\\Users\\Virgo\\Destop\\xpdf/bin64/pdftotext.exe"', paste0('"', i, '"')), wait = FALSE) )
 #create vector of txt file names
 rubiconfiles<-list.files(path = dest, pattern= "txt", full.names = TRUE)
 #turn into a list
 obj_list rubicon<-data.frame(obj_list)
 Clean up rubicon
 ##import rubicon.csv
 ##convert article text into lowercase and turn it into a string
 rubicon$Text<-tolower(rubicon$Text)
 rubicon.string ## split the string into words
 rubicon.string Word.list.df colnames(Word.list.df) ## remove blanks,lower, numbers
 Word.list.df Word.list.df$word<-tolower(Word.list.df[,1])
 Word.list.df ###create DTM
 target.list DTM.df ncol = length(target.list)))
 for (i in seq_along(target.list))
 {
 DTM.df[,i] }
 colnames(DTM.df) #nornalize DTM
 total.words DTM.matrix DTM.matrix DTM.norm.df #For Figure 2
 ###import rubicon mentions.csv and create line graph that shows mention of rubicon overtime
 ggplot(yy, aes(Year,Mentions))+geom_line(aes(colour=Newspaper), size=1.5)+labs(title="Mentions of 'Rubicon' Over Time") + xlab("Year") + ylab("Mentions") +theme_bw()
 For Correlations
 ##correlation
 short.list DTM.norm.mini.df #To get the correlation matrix
 cor.matrix.mini round(cor.matrix.mini, 2) ## rounds off at 2 places
 corrplot(cor.matrix.mini, method="shade",shade.col=NA,tl.col="black",tl.srt=45,addCoef.col="black",order="AOE", type="lower",title="Rubicon and Demographic Correlations",mar=c(0,0,2,0) )
 For Figure 8
 #word associations
 findAssocs(DTM, "rubicon", 0.57)
 #build dataframe for plotting
 toi <- "rubicon" # term of interest
 corlimit rubiconterms Terms = names(findAssocs(DTM, toi, corlimit)[[1]]))
 ggplot(rubiconterms, aes( y = Terms)) +geom_point(aes(x = corr), data = rubiconterms, size=2) +xlab(paste0("Correlation with the term ", "\"", toi, "\""))
 For Figure 3
 library(tm)
 library(RWeka)
 library(stringr)
 #import rubicon.csv and condense into articles by paper
 by.paper<-NULL
 for(paper in unique(rubicon$X4)){
 subset text row by.paper }
 # create corpus
 myReader corpus # pre-process text
 corpus corpus corpus corpus corpus # create term document matrix
 tdm<-TermDocumentMatrix(corpus)
 # remove sparse terms
 tdm. # save as a simple data frame
 count.all count.all$word write.csv(count.all, "C:\\Users\\virgo\\Desktop\\folder\\tdm.csv", row.names=FALSE)
 #normalize
 ## paste the text into one long string
 big.string ## split the string into words
 big.string ## get a dataframe of word frequency
 Word.list.df ## give the dataframe some nice names
 colnames(Word.list.df) ## remove blanks
 Word.list.df ## add \\b so the words are ready for regex searches
 target.list Word.list.df function(x) str_count(by.paper$text, x)
 count.matrix <-
 sapply(X = target.list, FUN = function(x) str_count(by.paper$text, x))
 ## lines below are clean up
 DTM.df colnames(DTM.df) DTM.matrix DTM.matrix DTM.norm.df paper.tfidf.df function(x) x*log(nrow(DTM.norm.df)/(sum(x!=0)+1))))
 rownames(paper.tfidf.df)<-c("Danville","Harrisonburg","Petersburg","Radford","Winchester","Norfolk")
 x<-6
 Tfidf.ten.df ## transpose for easier sorting
 Tfidf.ten.df ## add words
 Tfidf.ten.df$words ## sort and get top ten
 tfidf.ten tfidf.ten$words
 ###plot tfidf
 n p d h mycolors colnames(p)[1]<-"paper"
 colnames(p)[2]<-"word"
 ggplot(p, aes(paper, rank)) +
 geom_point(color="white") +
 geom_label(aes(label=p$word,fill=p$paper), color='white', fontface='bold', size=5) +
 scale_fill_manual(values = mycolors) +
 theme_classic() +
 theme(legend.position=1,plot.title = element_text(size=18), axis.title.y=element_text(margin=margin(0,10,0,0))) +
 labs(title="Most Characteristic Words per Newspaper") +
 xlab("") + ylab("Ranking by TF-IDF") +
 scale_y_continuous(limits=c(-4,10), breaks=c(1,6,10), labels=c("#1","#5", "#10")) +
 annotation_custom(Norfolk, xmin=.5, xmax=1.5, ymin=0, ymax=-4) +
 annotation_custom(Petersburg, xmin=1.5, xmax=2.5, ymin=0, ymax=-4) +
 annotation_custom(Danville, xmin=2.5, xmax=3.5, ymin=0, ymax=-4) +
 annotation_custom(Harrisonburg, xmin=3.5, xmax=4.5, ymin=0, ymax=-4)
 For Figure 5
 #import csv or race articles numbers
 p<-ggplot(race,aes(x=newspaper, y=articles,fill=as.factor(newspaper))) + geom_bar(stat="identity")+facet_wrap(~word, scales = "free")+theme(axis.text.x = element_text(angle = 45, hjust = 1))
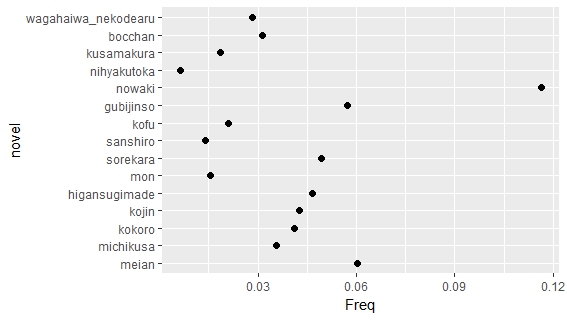
 I processed the txt files with the same code I did a month ago, taking out pronunciation guide and style annotations. Then, I used dataframes generated by MeCab to calculate the term frequency in percentage and tf-idf. For all the graphs, the novels names on the axes are in chronological order
 The following graph is a comparison between the frequencies the word modernity (現代) and antiquity (古代).Soseki used a lot more modernity than antiquity. I wanted to find the frequency of tradition (伝統) or national learning (国学), but it turned out that Soseki never used these words.
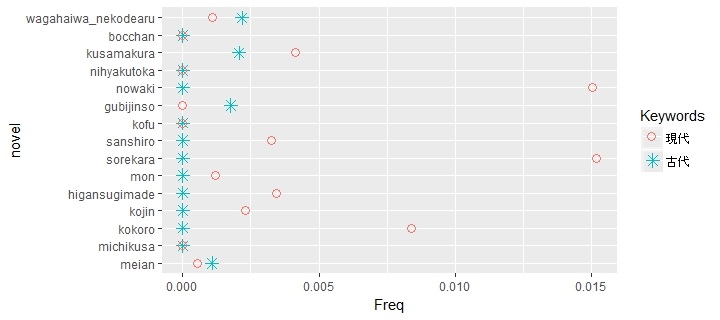 It might be the case that words like tradition or national learning emphasize superiority of Japanese culture, so Soseki avoided using them. His was disgusted by shallow nationalist movement of his classmates when he was young. By contrast the word Chinese study appeared several time in his novels.
 Tf-idf
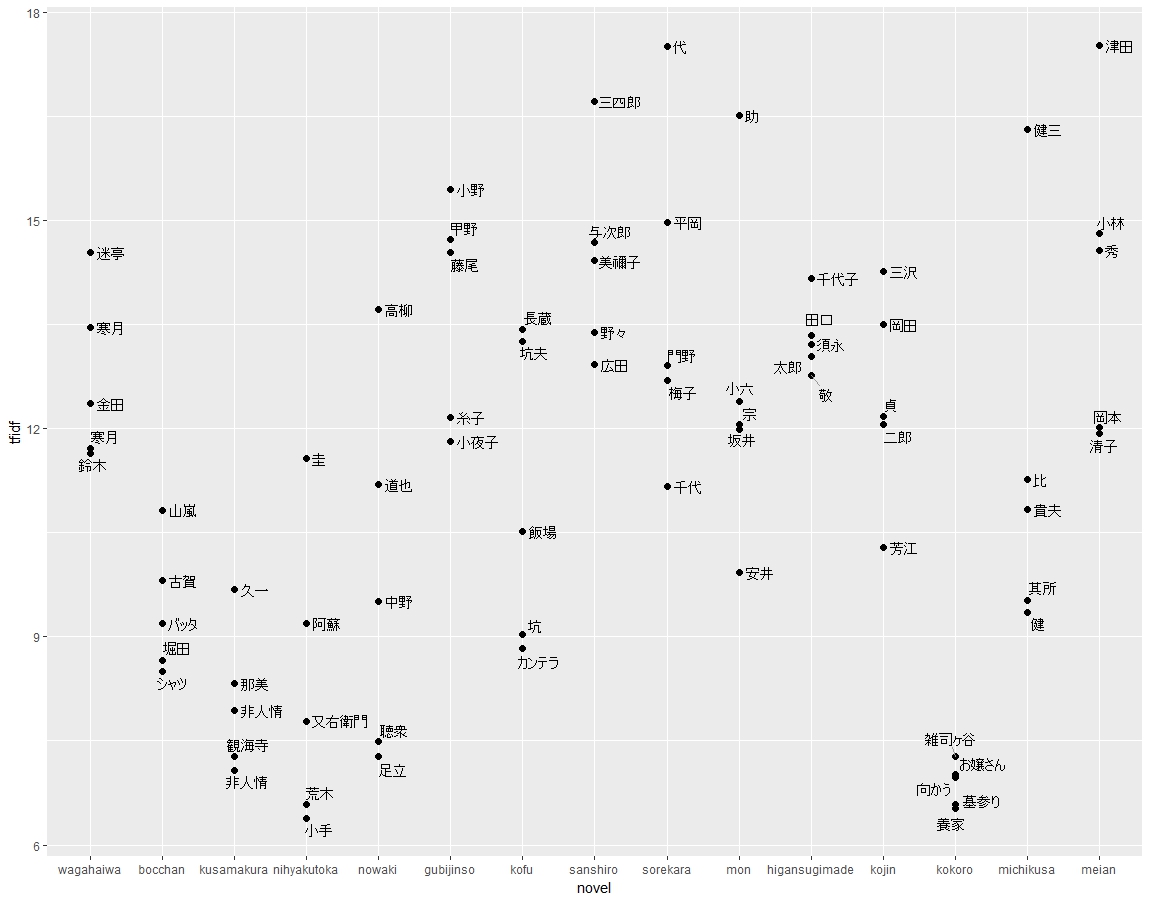 A violin graph of top 20 words by tf-idf also shows that Kokoro tends to use common word.
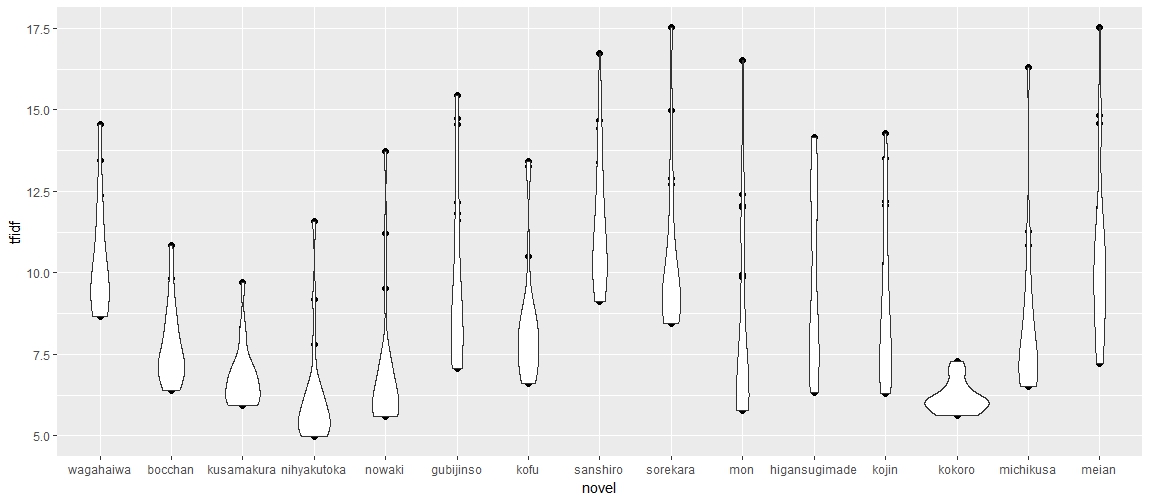 Code
Code


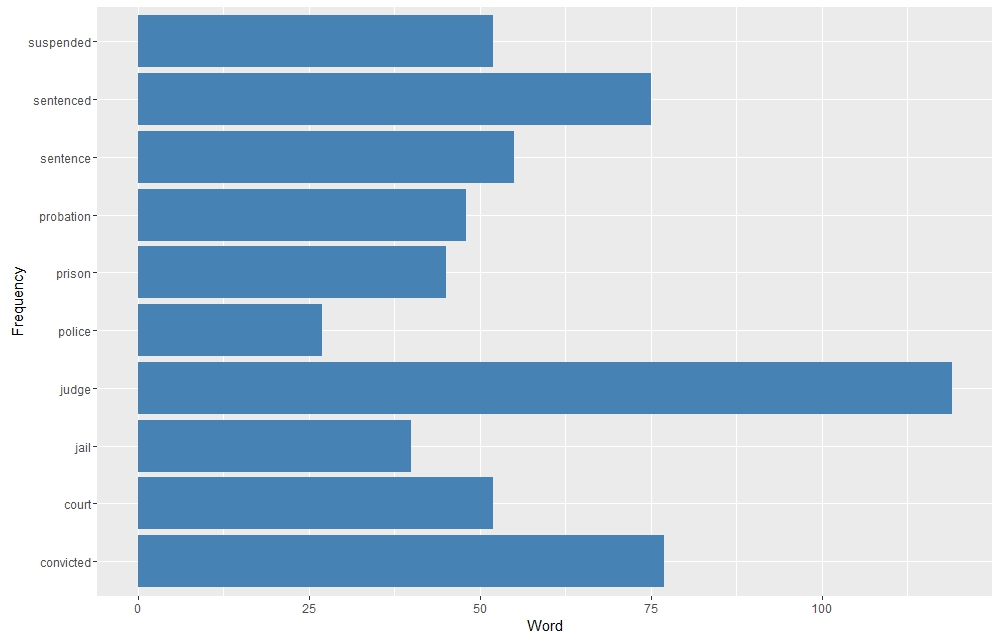 Using R I selected a few words that indicate Rubicon’s ties to the justice system. Over 66% of Rubicon’s clients were filtered through the justice system. As Indicated below words that exemplify this connection peaked in 1973, right when arrest numbers dropped across the state. Equally notable however is the sharp drop in 1974, which coincided with an increase in arrest numbers from 1973 to 1974. Rubicon either reached capacity or state drug control directives changed. As can be seen words like “probation” were not used continually over time and “convicted” and “sentence” drop out of favor too. This is probably due to a lack of space available at Rubicon after 1973.
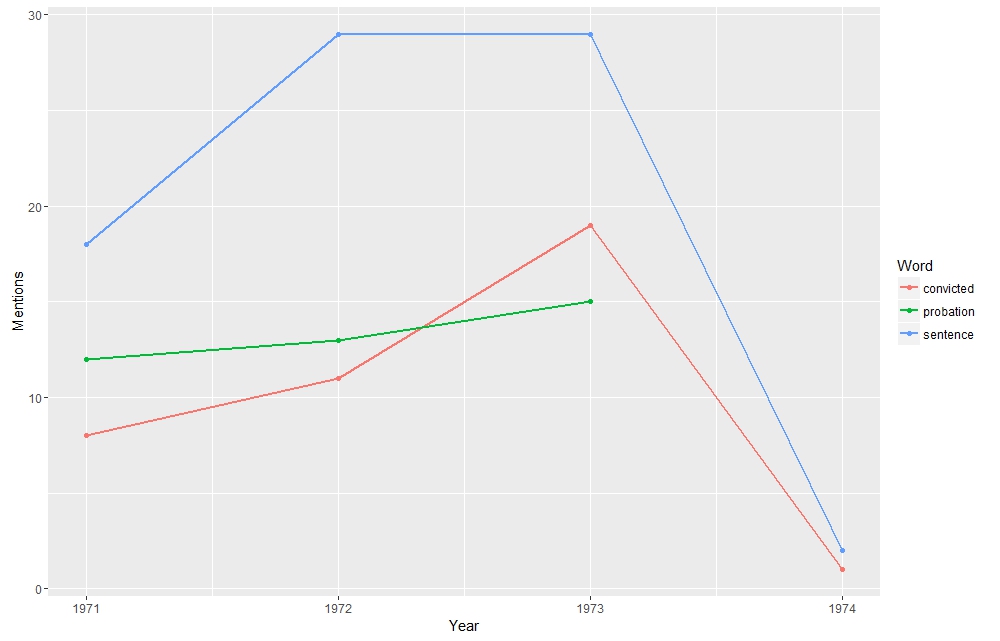 Sentiment Analysis of articles about Rubicon in three Virginia newspapers
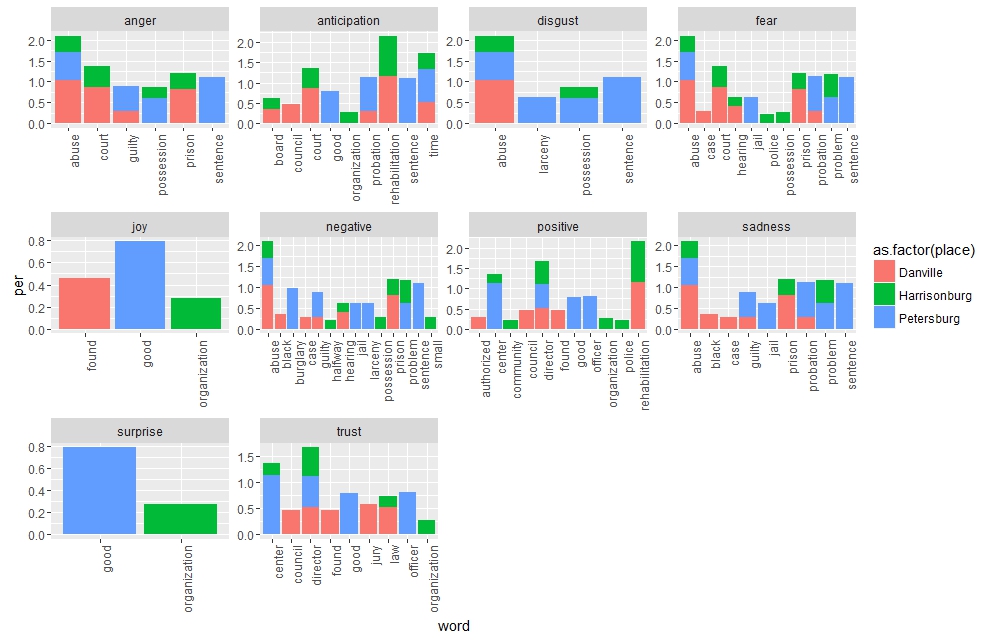 Word cluster of mentions of “police” within the Rubicon corpus. The city of Petersburg is heavily represented.
 These outliers, however, are not going to seriously affect the study, since I am only interested in counting word frequency and I have a large data set. The code I used is from class. I wrote some new code for graphing and picking frequent word from the document.
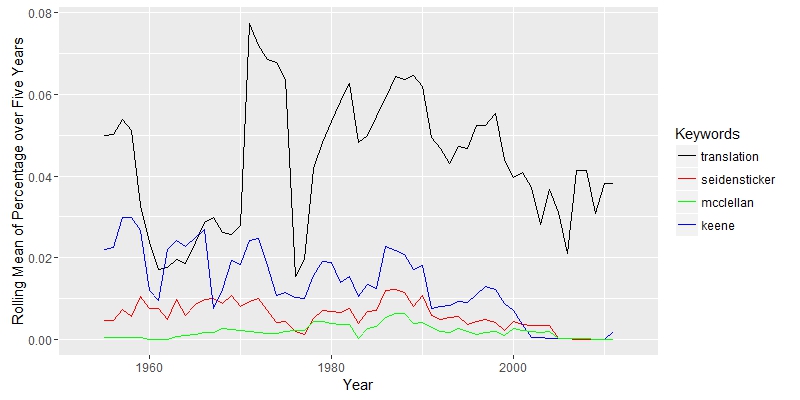
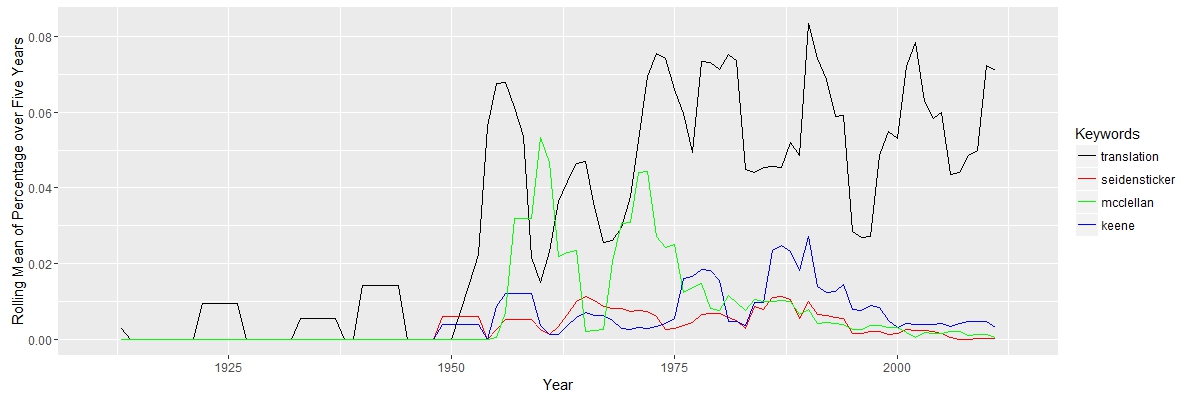 The graph shows that the study of Nastume Soseki’s work in translation rise around 1950. It makes sense, since most of his work was translated after World War II. There are only a few document before 1950 in the result. The key term “translation”, although with some fluctuation, is always important after 1950. Three other keywords “McClellan”, “Keene” and “Seidensticker”, translators’ names, appeared more from 1950 to 2000. The three authors were all born in 1920s, so their works concentrated in the late 20th century.
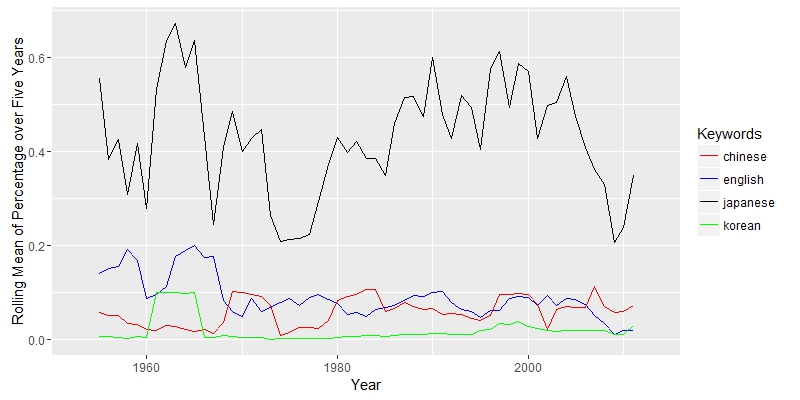
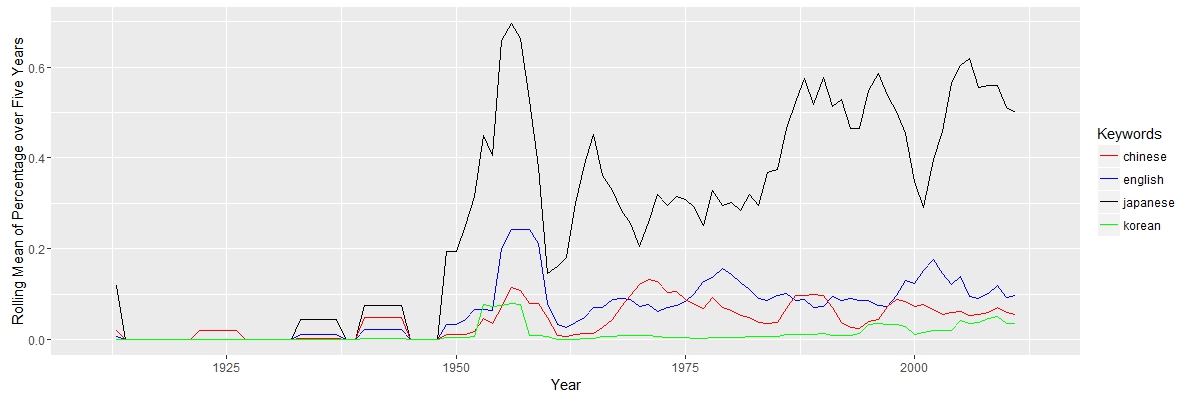 The keyword “Japanese” appeared dominant as expected. Because most of the documents are from Asian studies journals, “Chinese” and “Korean” appears frequently. The line of “English” is close to the line of “Chinese”. If most of works are about translation, the word “English” would appear more. Therefore, there maybe a large portion of the work that does not directly discuss translation; these documents are probably about general literature or cultural study.
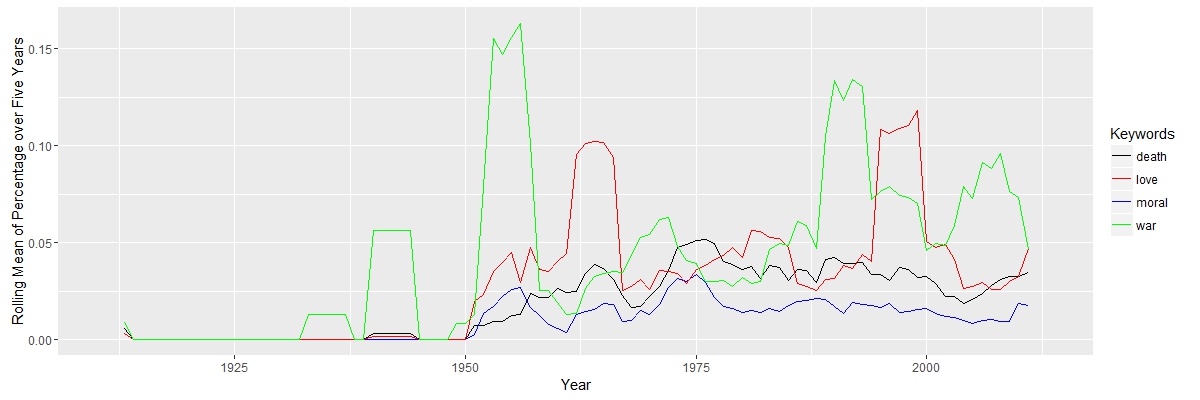
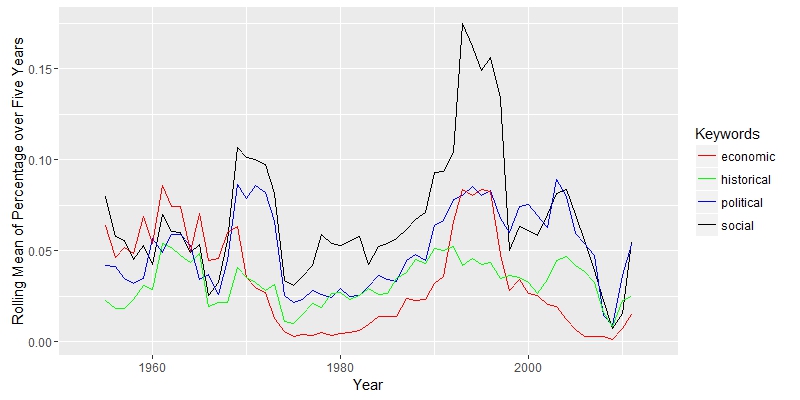
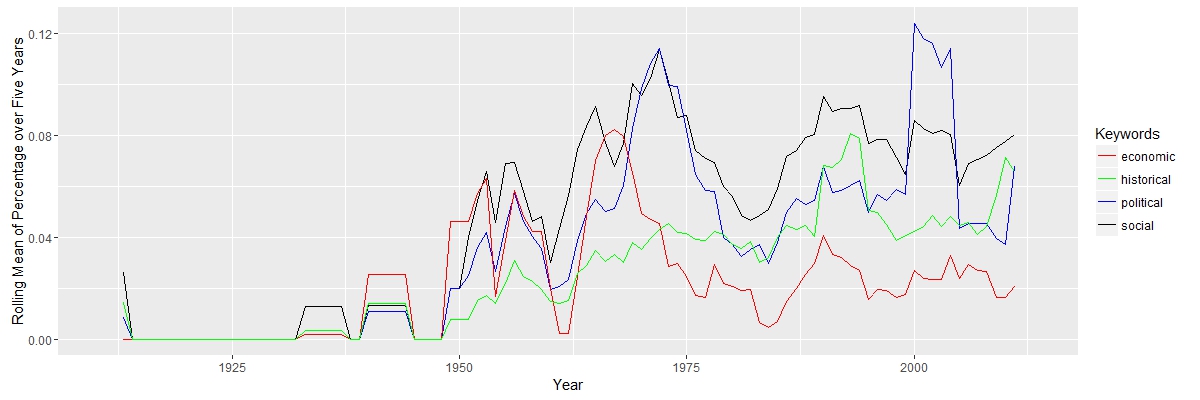 Here, I am interested in how scholars interpreted Natsume’s works and their political, social, economic and historical connections. “Political” and “social” are closely related, since they move together. “Economic” has a falling importance, while “historical” appeared to be more import along the timeline.
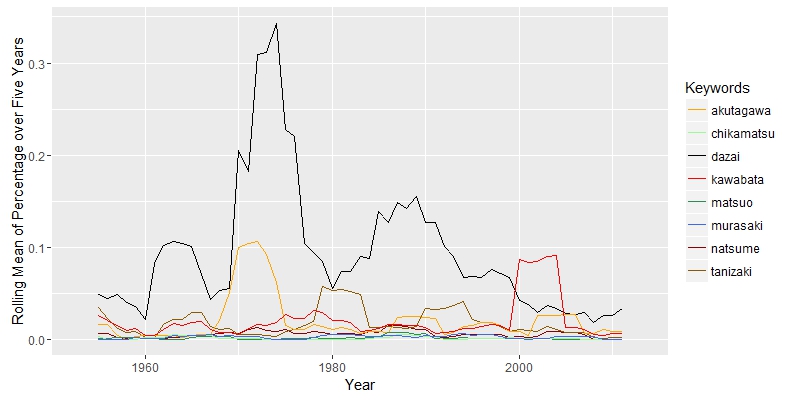
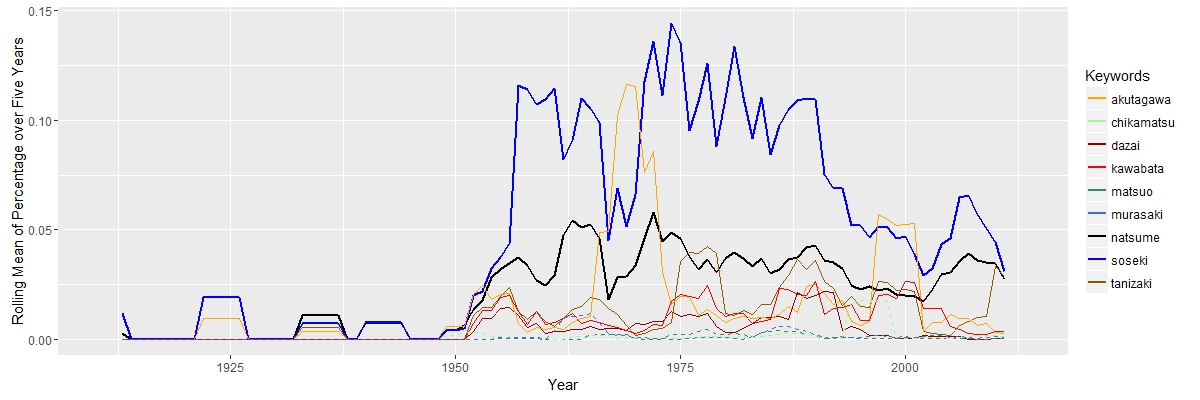
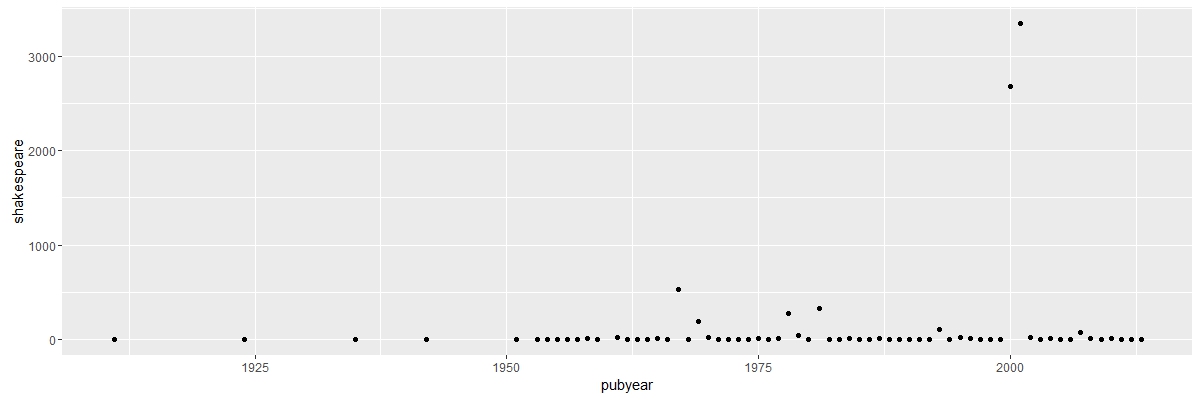
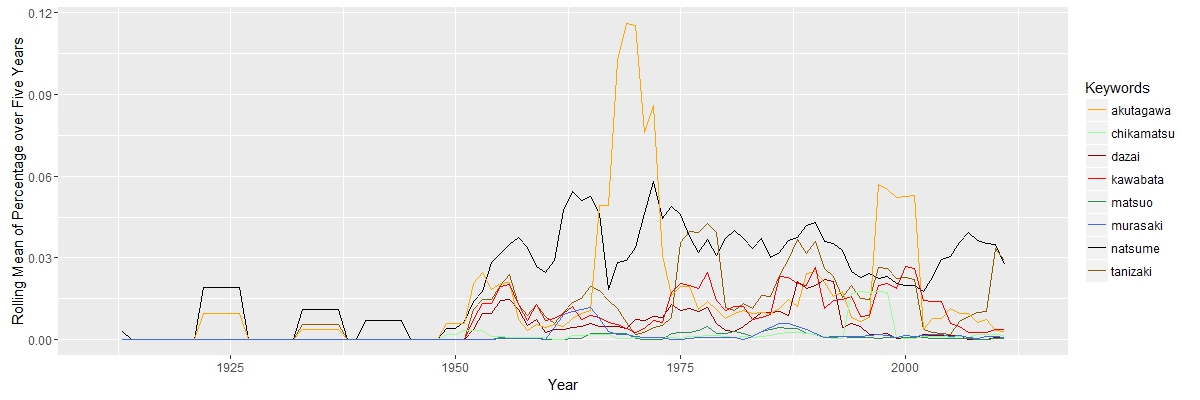 The search for “Natsume Soseki” in JSTOR does not return documents exclusively about Natsume Soseki. Some documents about other Japanese authors may also appear. The graph above shows that “natsume” was constantly above other authors, except years aroud 1965 and 2000, when “akutagawa” has two peaks. The truth is that “akutagawa” appears in total 109 times from 1968 to 1972 and 153 times in 2004. The data set is not perfect, but it will not cause serious bias.