There are two versions of the draft of Ping Ding Hai Kou Fang Lue: the Manchu and Chinese versions. If the Manchu and Chinese versions were translated from each other, the two versions should be exactly the same. However, as known, they are different. How different are they? The Manchu language and Chinese are linguistically different, so it is impossible to analyze grammar, sentence structure, and writing style. However, it is possible to analyze proper nouns. In this text, there are three primary proper nouns: toponyms, people’s names, and position titles. I thus analyze the difference of percentage between two versions in proper nouns, including places, people’s name, and position titles, and Dunning log-likehood as well as tf-idf of six overlapping places in all three volumes. By understanding the result, I can check the text to deeply recognize the difference between two versions.
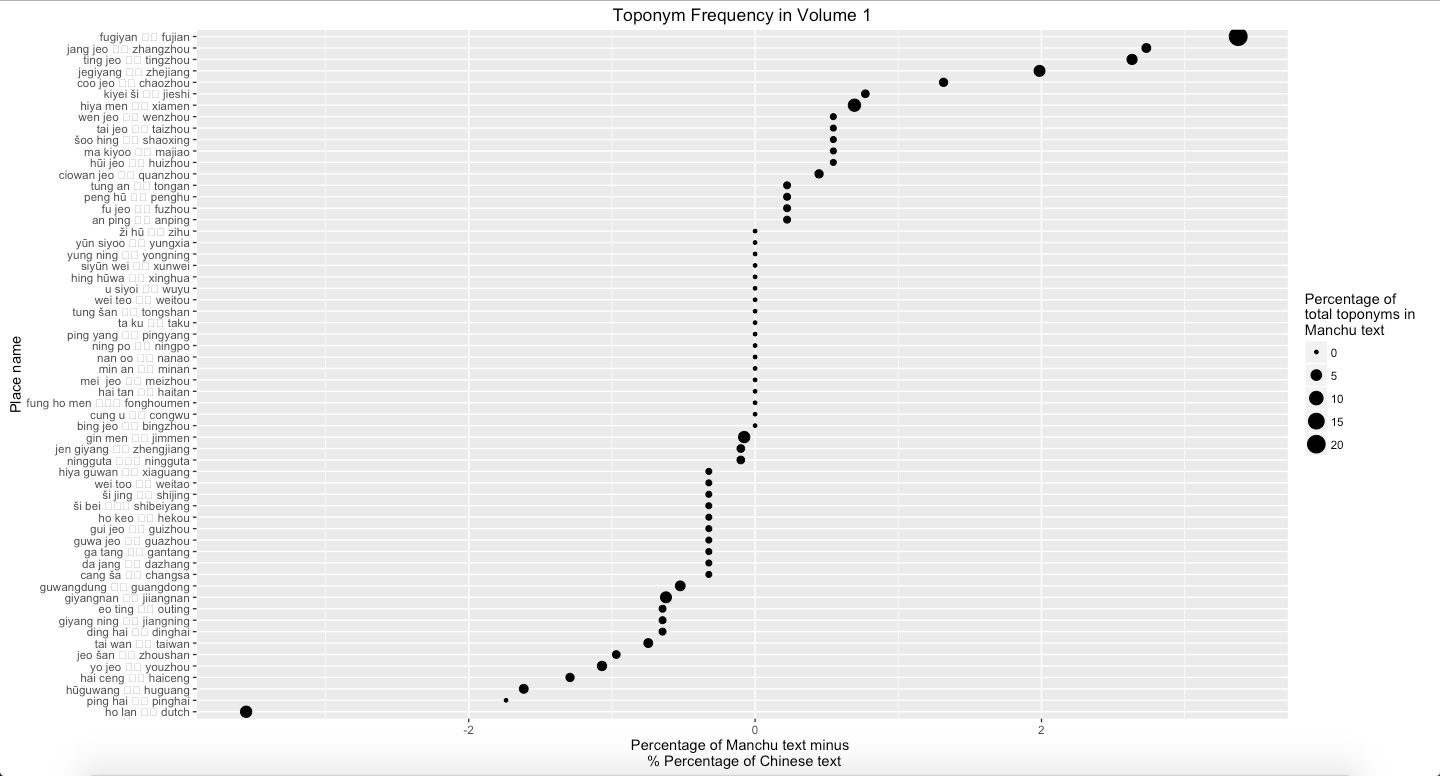
Graph 1: Percentage of Manchu minus percentage of Chinese text mines in Vol. 1
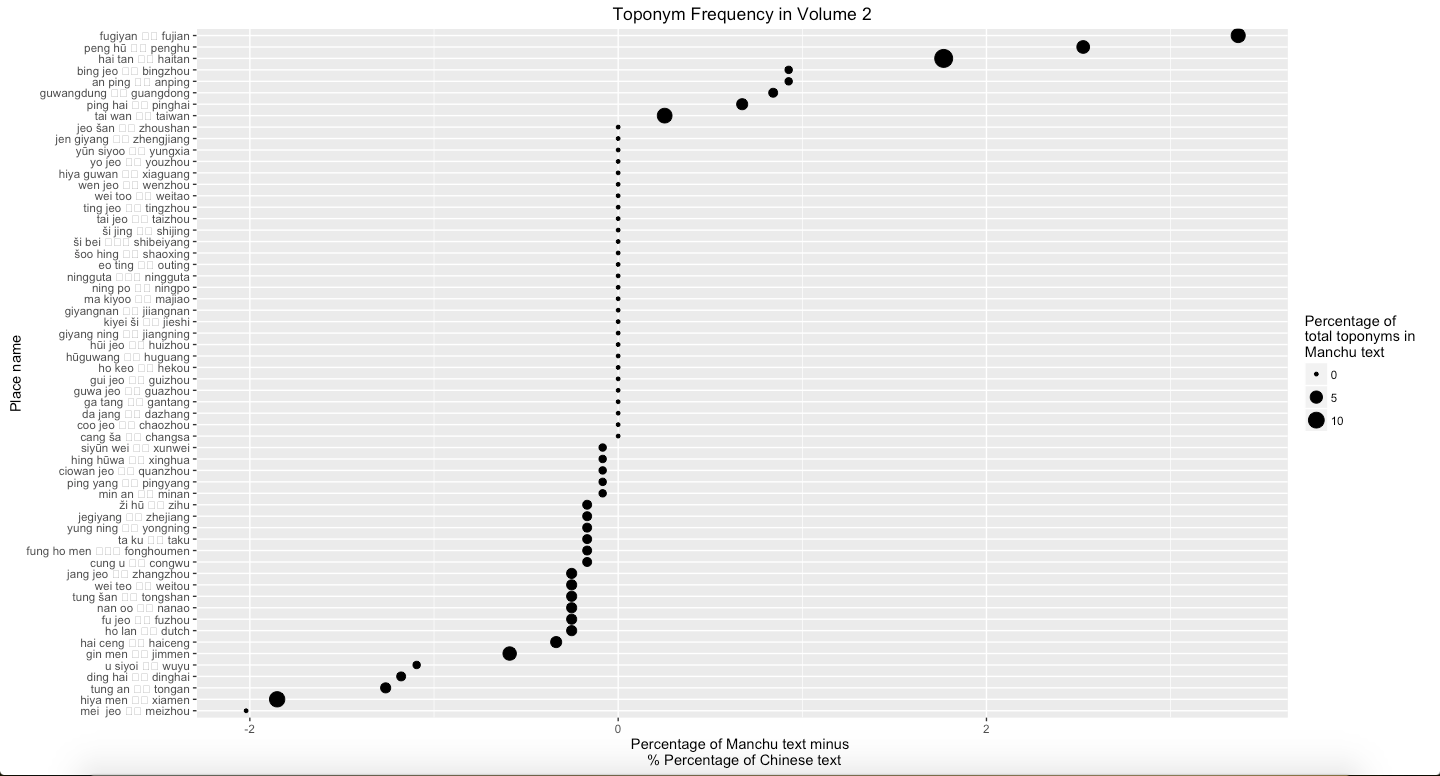
Graph 2: Percentage of Manchu minus percentage of Chinese text mines in Vol. 2
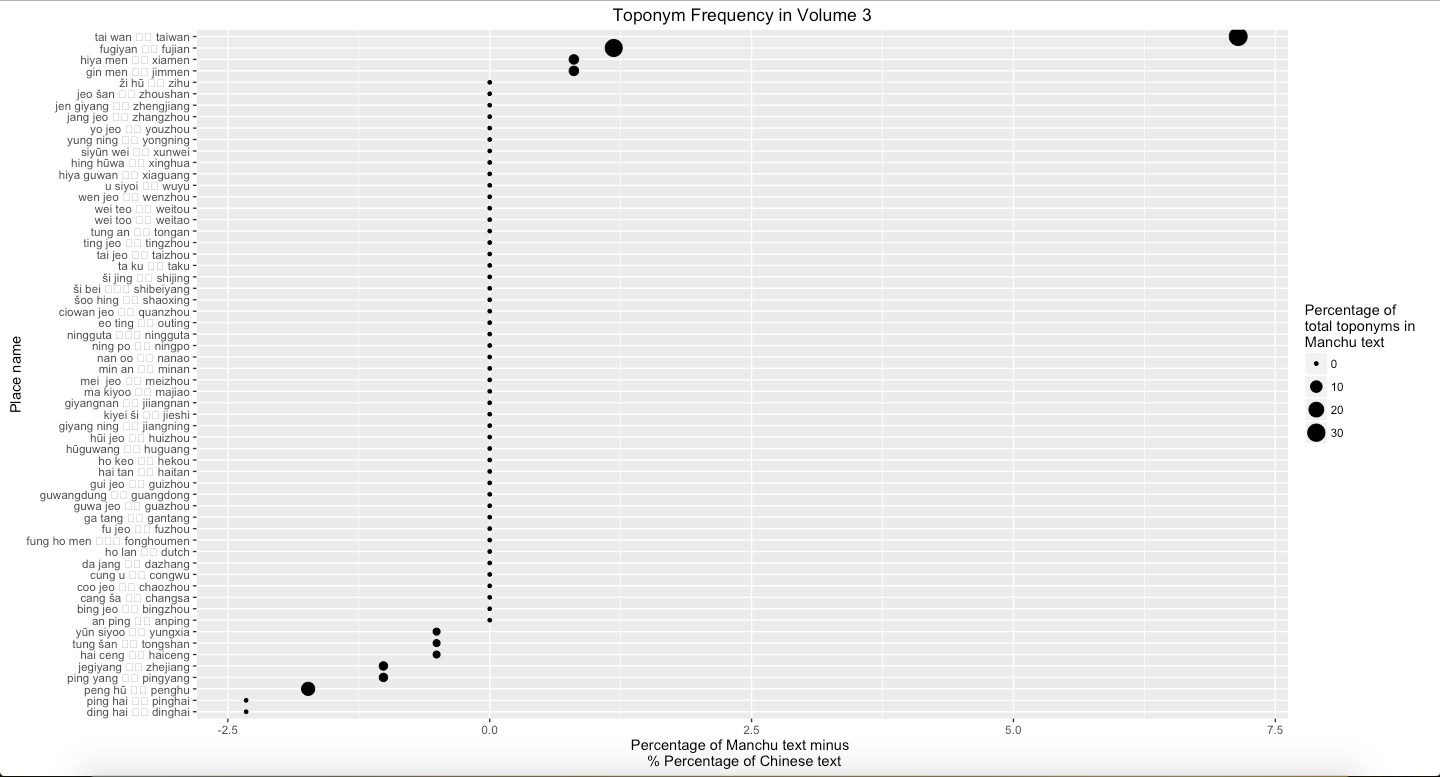
Graph 3: Percentage of Manchu minus percentage of Chinese text mines in Vol. 3
Graph 4: Percentage of Manchu minus percentage of Chinese text mines in three volumes
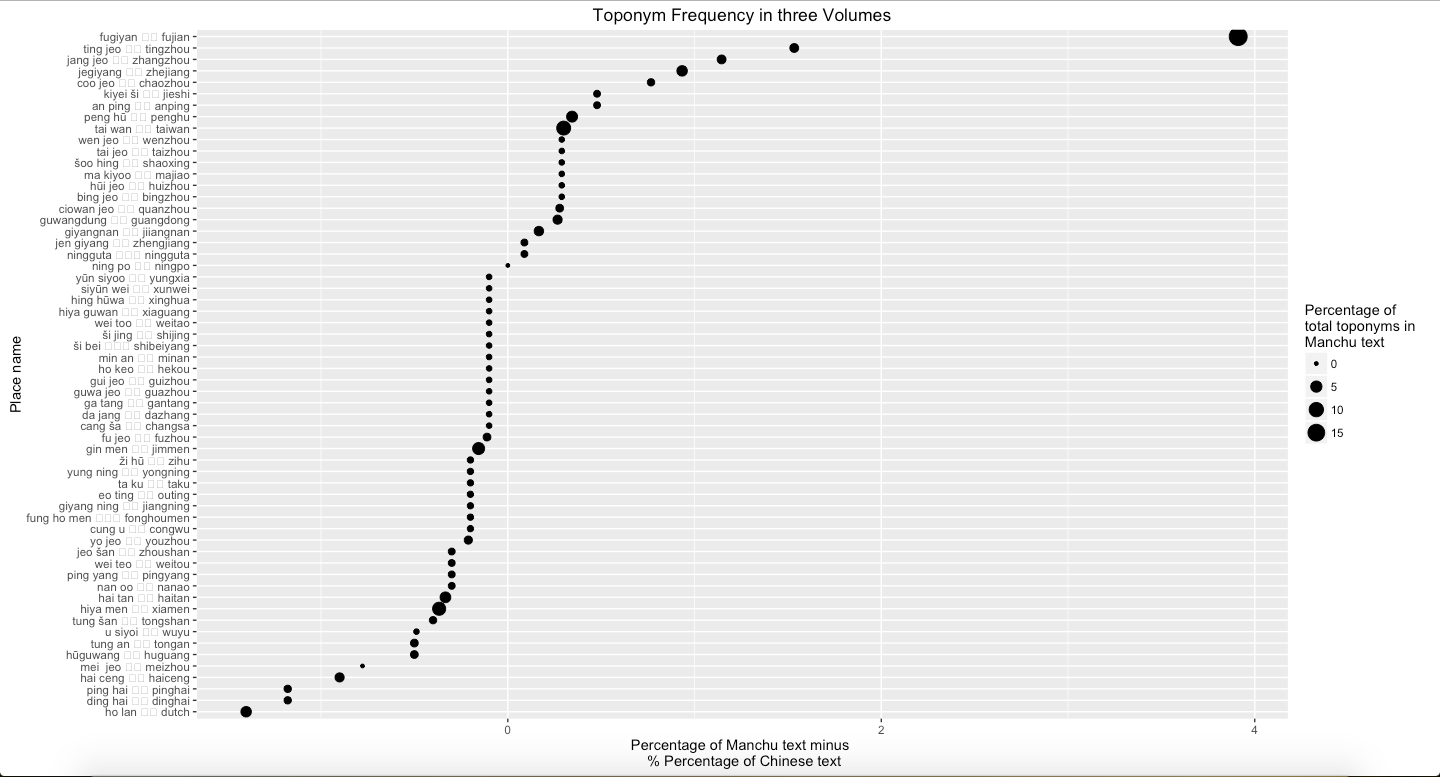
Graph 1 to Graph 4 represent the difference that the percentage of text mines in places in Manchu language minus the text mines in places in Chinese language from Volume 1 to Volume 3 and all three volumes. Graph 1 suggests that Fujian is much more frequent in Manchu than in Chinese. Dutch is more frequent in Chinese than in Manchu. Graph 2 shows that Fujian, Penghu, and Haitan are more frequent in Manchu than in Chinese. Additionally, Xiamen and Meizhou are more frequent in Chinese than in Manchu. Graph 3 suggests that Taiwan is much more frequent in Manchu than in Chinese. By contrast, Penghu is more frequent in Chinese than in Manchu. Overall, Fujian and Taiwan are more frequent in Manchu than in Chinese, and Dinghai, Dutch, and Pinghai are slightly more frequent in Chinese than in Manchu. Among these places, Fujian is easily to explain. In Chinese, each province has its own abbreviation; for example, Min is the abbreviation of Fujian. The percentage of frequency of Dutch in Chinese volume 1 is more different than in Manchu volume 1 because there is one paragraph, which accounts Dutch navy supported the Qing, describes differently in two versions.
Graph 5: Percentage of Manchu minus percentage of Chinese text mines in Vol. 1
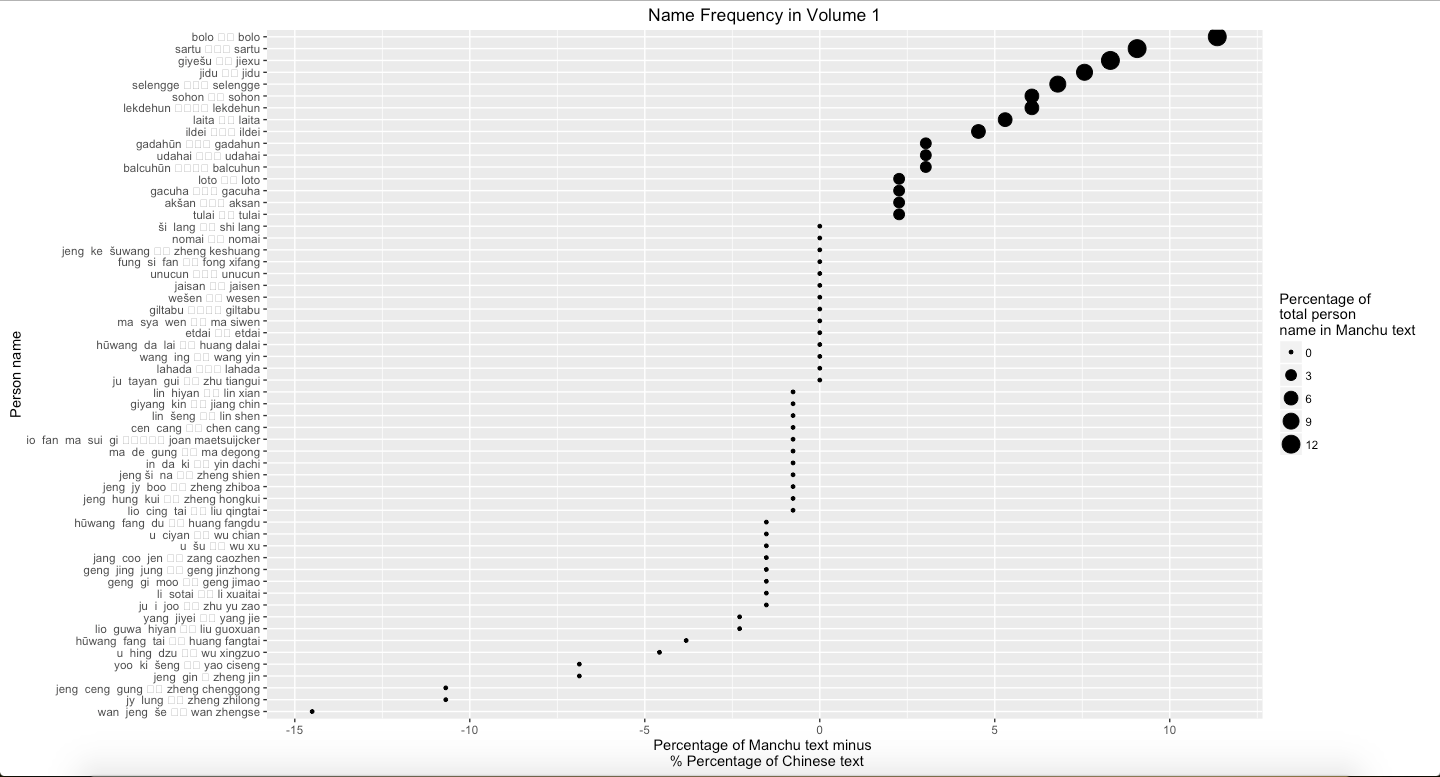
Graph 6: Percentage of Manchu minus percentage of Chinese text mines in Vol. 2
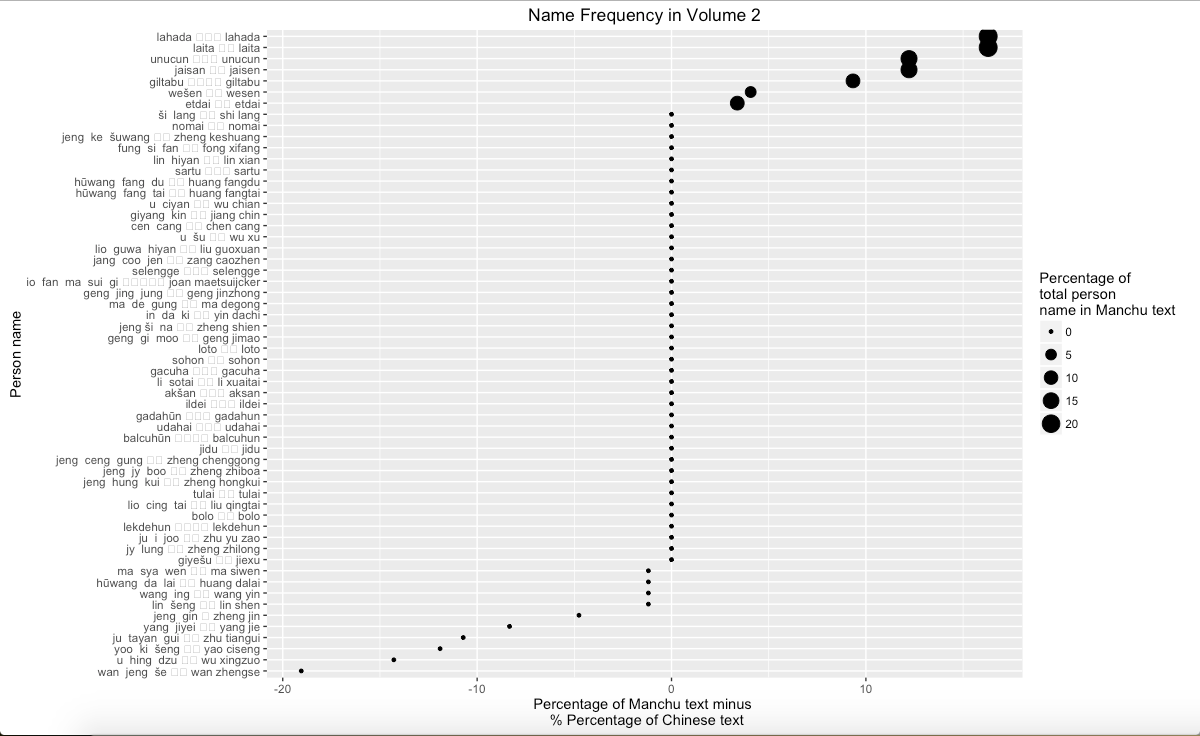
Graph 7: Percentage of Manchu minus percentage of Chinese text mines in Vol. 3
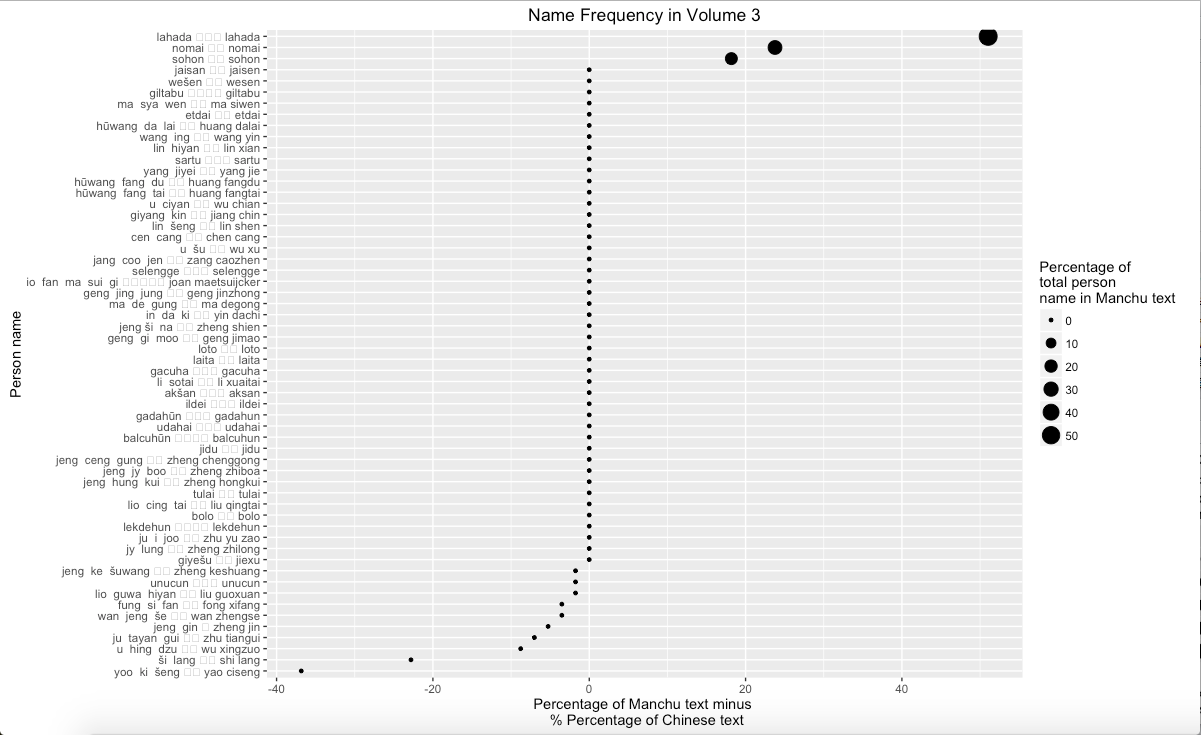
Graph 8: Percentage of Manchu minus percentage of Chinese text mines in three volumes
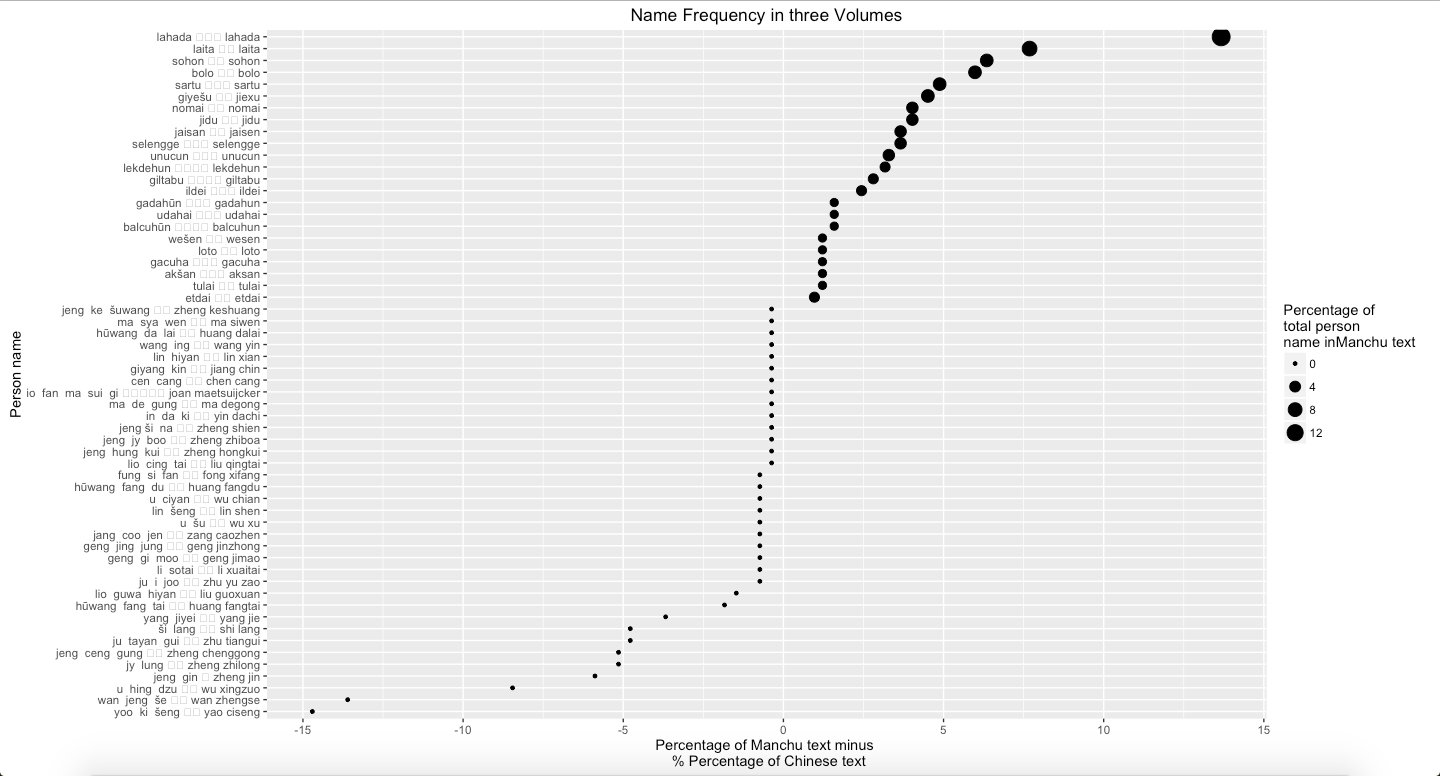
By using the similar approach to analyze people’s name, it can obtain the result of difference between two versions. However, in this part, I make a slight change. Instead of using entire Chinese name, combined by first and last name, I only search people’s first name because it is more common to use first name only in text. More importantly, because certain surname, such as Wang, also refers a noble rank in Chinese and Manchu, it caused to confused once I analyzed entire Chinese name. Therefore, in order to avoid the misunderstanding, it is appropriate to only search first name. Graph 5 suggests that some people’s names in Manchu never appear in Chines, and people who are more frequently mentioned in Manchu are Manchu people. Oppositely, Wan Zhengse, a military commander, appear more frequent in Chinese than in Manchu. Graph 6 also suggests the difference between two texts. Again, Wan Zhengse is still more frequent mentioned in Chinese than in Manchu, and people who are more frequently mentioned in Manchu are Manchu people. Interestingly, Graph 7 shows the similar result that people who are more frequently mentioned in Manchu are Manchu people. Noticeably, Manchu people are more frequently mentioned in Manchu, and Chinese people, including Hanjun Bannersmen and Han Chinese, are more frequently mentioned in Chinese.
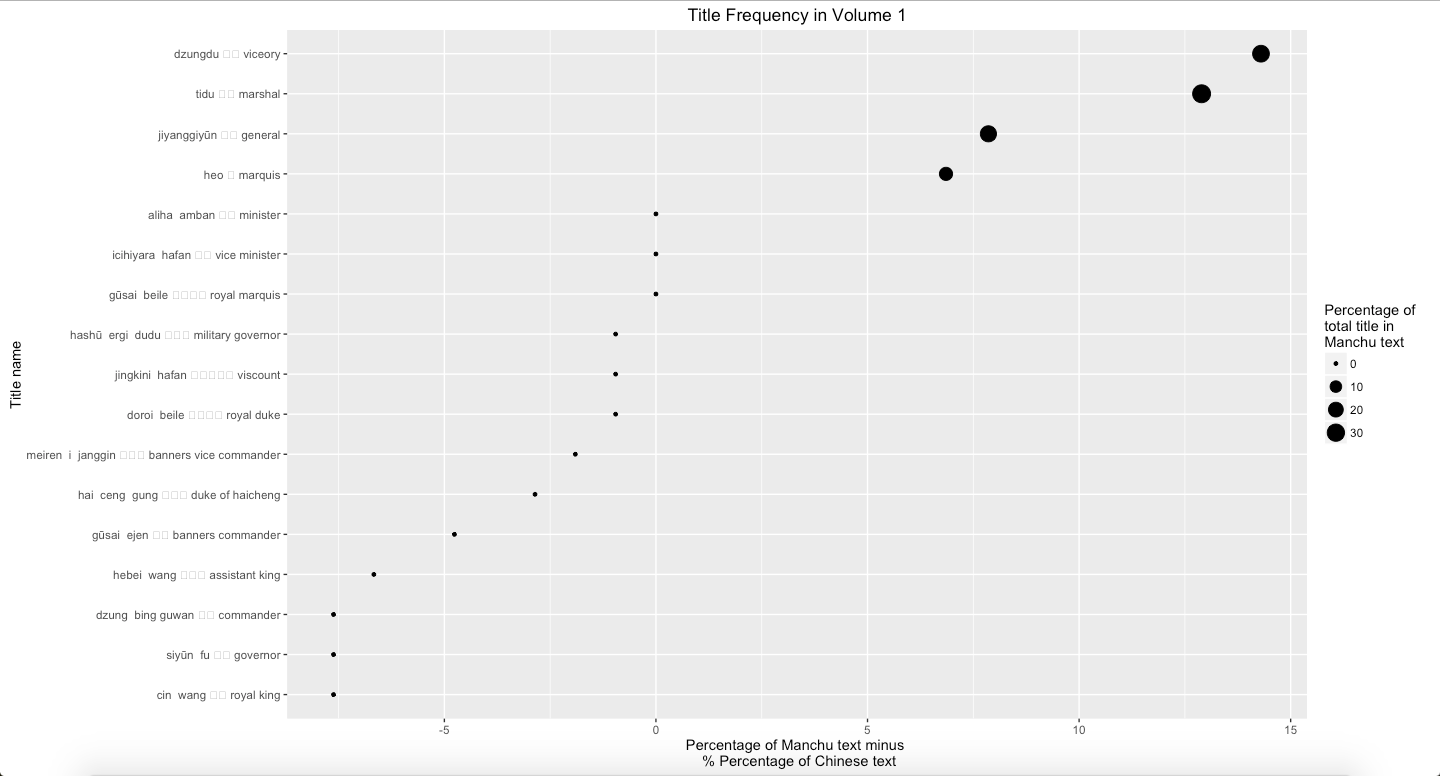
Graph 9: Percentage of Manchu minus percentage of Chinese text mines in Vol. 1
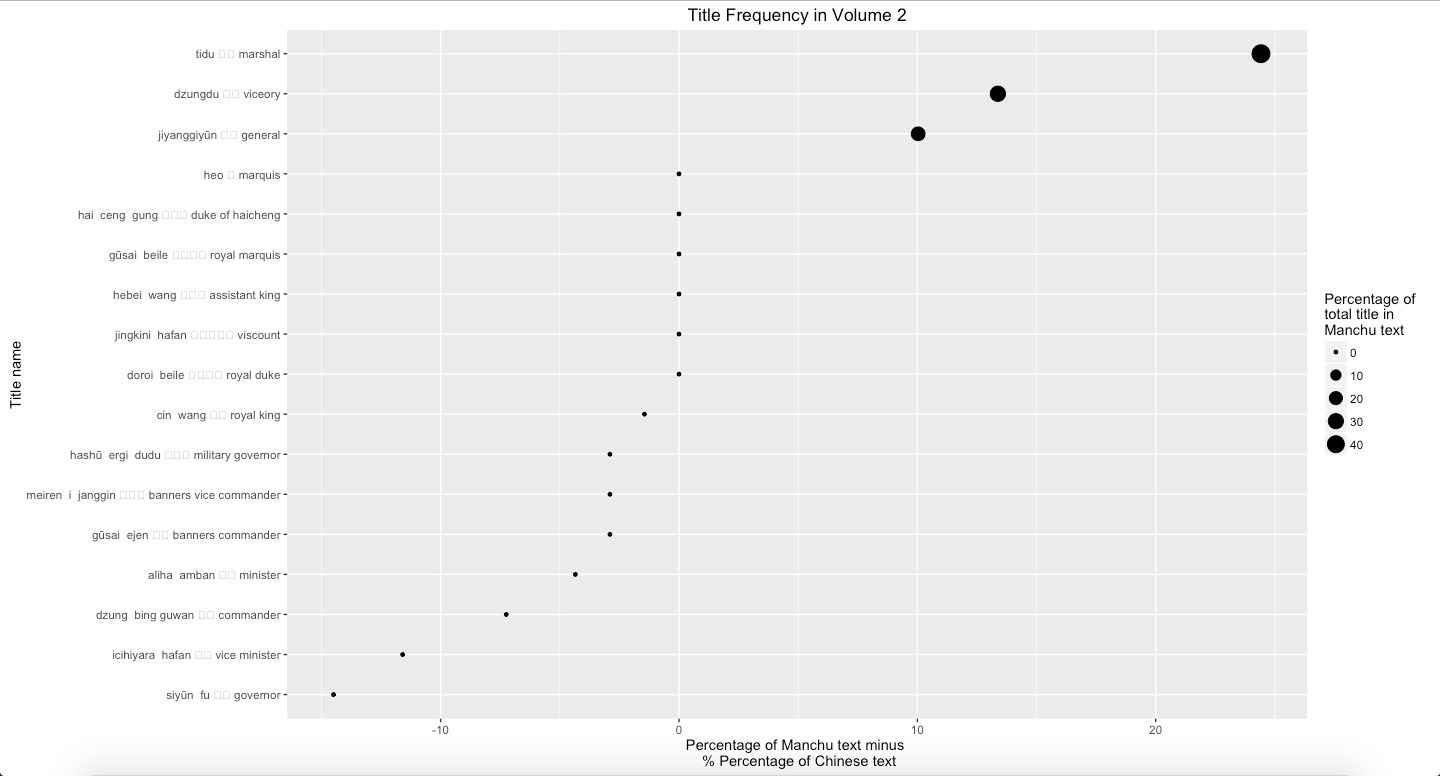
Graph 10: Percentage of Manchu minus percentage of Chinese text mines in Vol. 2
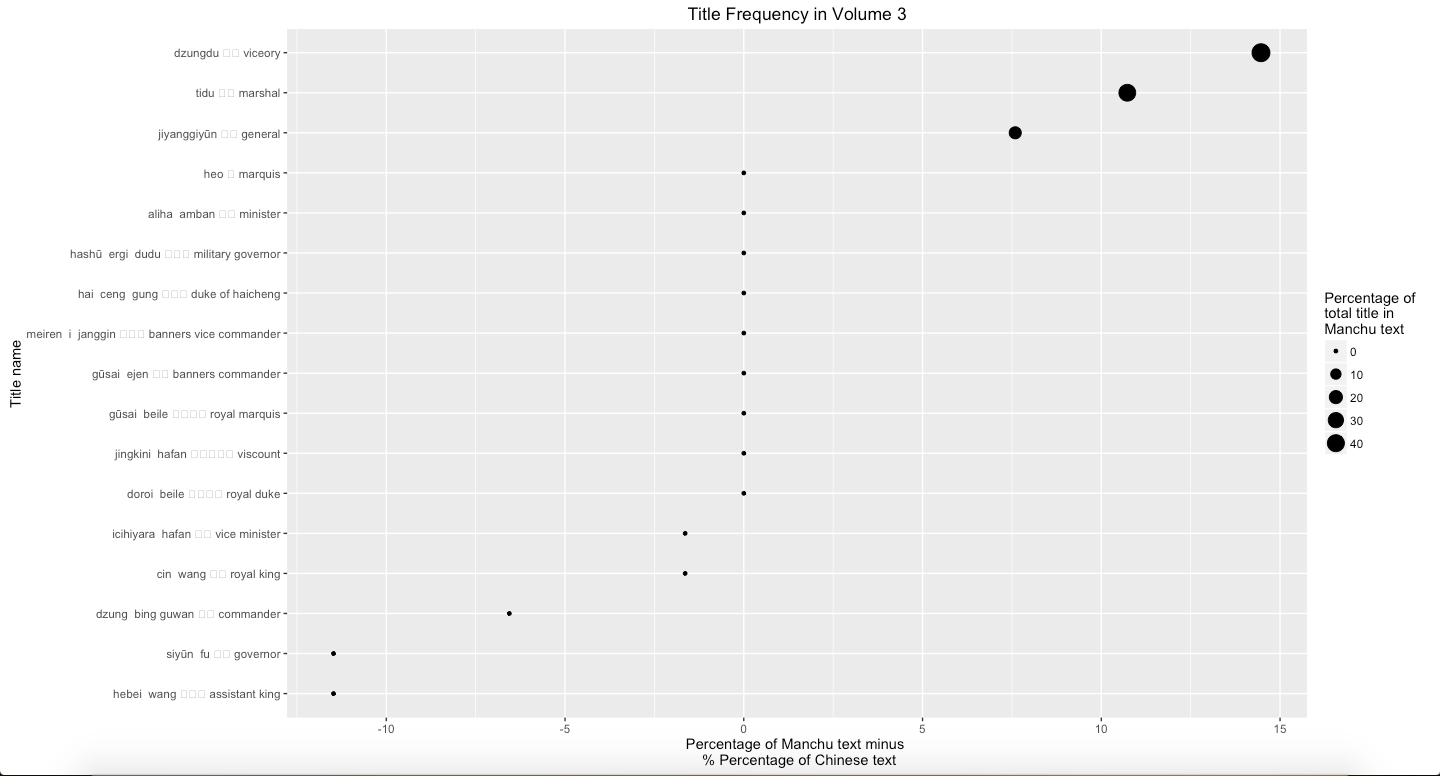
Graph 11: Percentage of Manchu minus percentage of Chinese text mines in Vol. 3
Graph 12: Percentage of Manchu minus percentage of Chinese text mines in three volumes
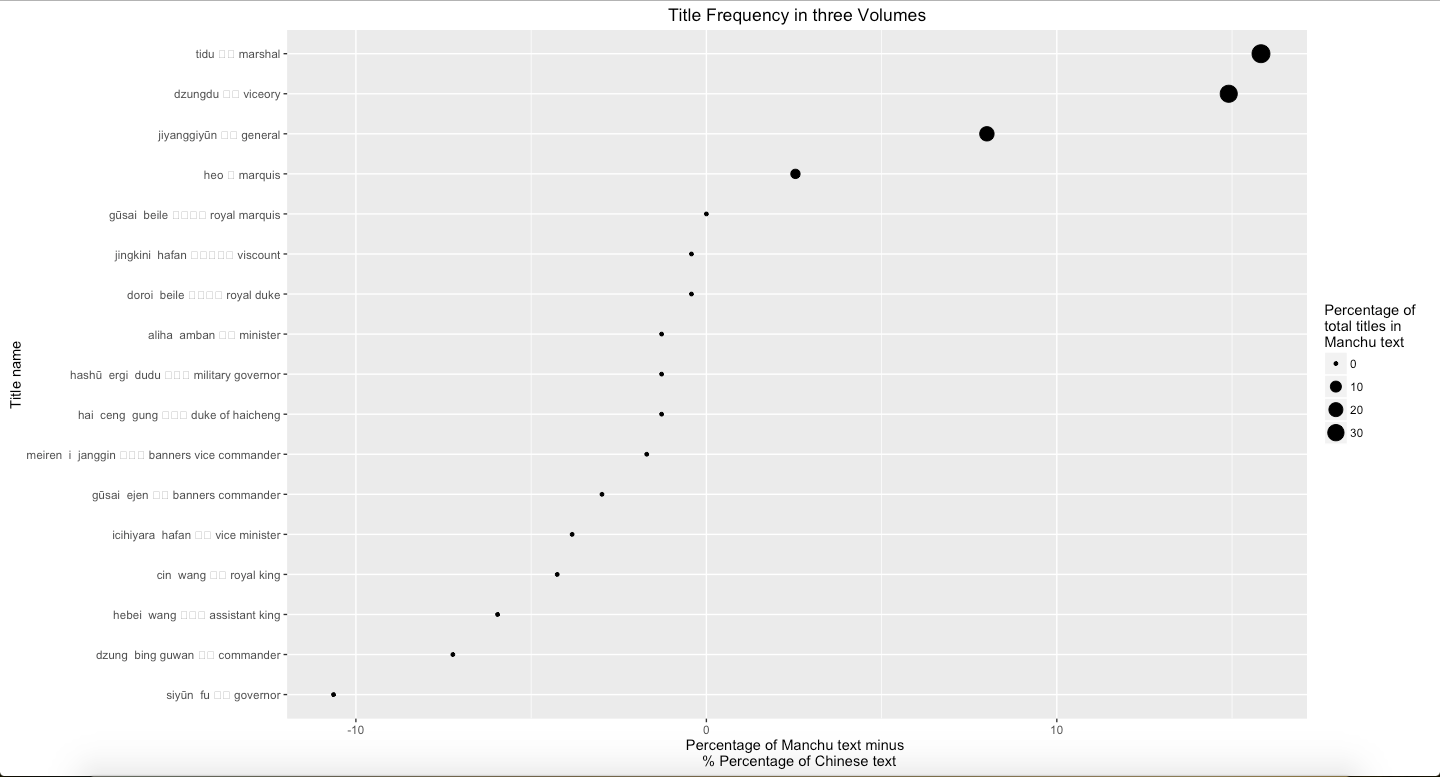
Finally, using the same process to analyze the position title, such as governors (dzungdu), commanders (tidu), and generals (jiangjun), Graph 9, Graph 10, Graph 11, and Graph 12 show that viceory, marshal, and general are more frequently mentioned in Manchu than Chinese. The main reason is because these three terms are able to be replaced by other abbreviations in Chinese. Usually, in Chinese, authors prefer to use the abbreviations to refer these position titles. However, this also points out that Manchu language text indicated precisely and directly.
The first analysis about prop nouns is regarding places. Drawing the results of Graph 1 to Graph 4 on map can provide precise visual sense. Graph 13 to 16 shows the result. In some degree, Graph 13 to Graph 15 display shift over time, and Graph 16 shows the completed shift over time showing in three volumes.
Graph 13: the percentage difference in volume 1
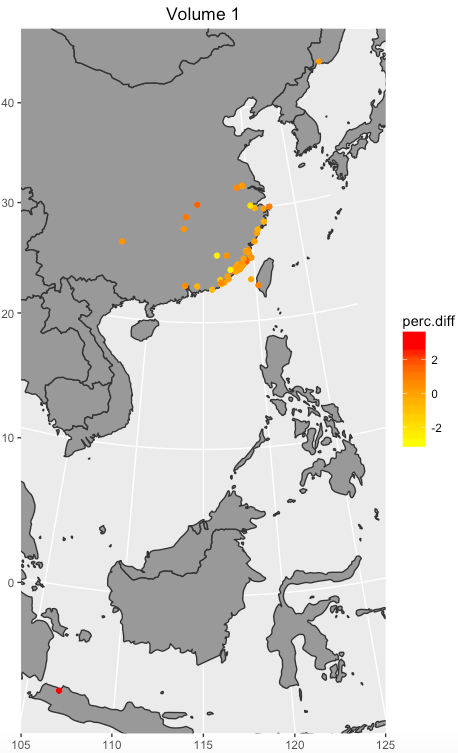
Graph 14: the percentage difference in volume 2
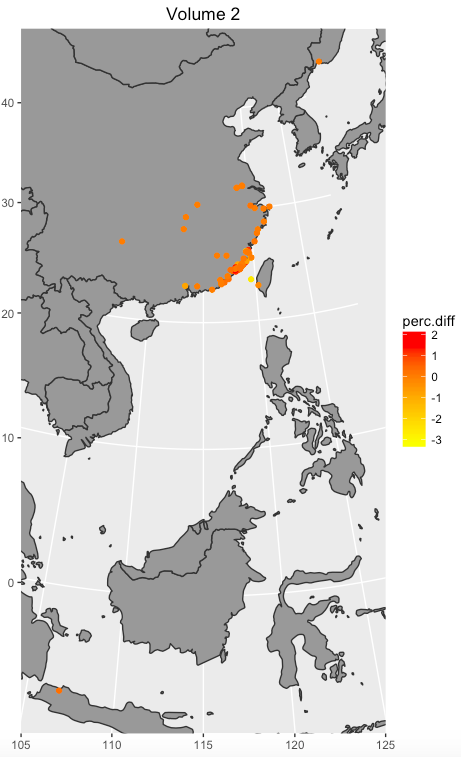
Graph 15: the percentage difference in volume 3
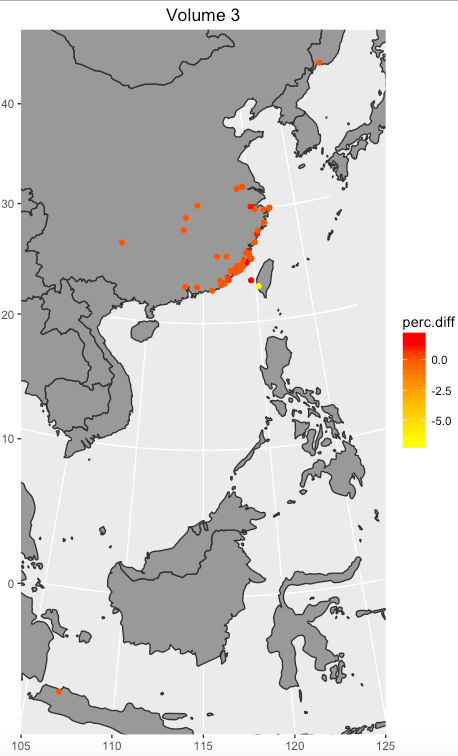
Graph 16: the percentage difference in three volumes
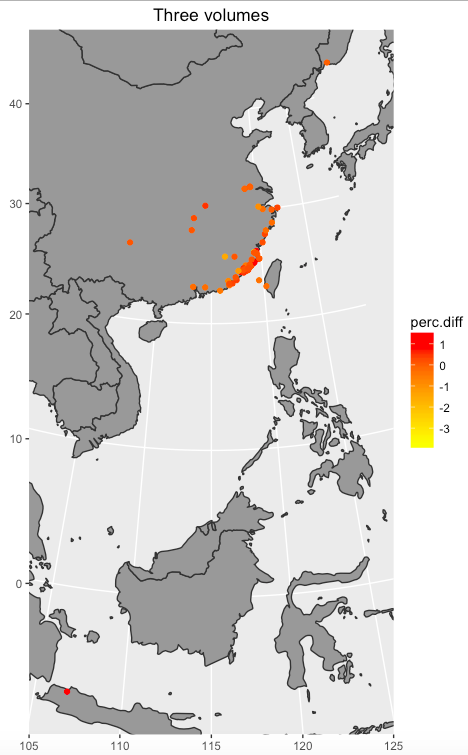
However, mapping statistic results is questionable. In order to provide more precise result, two methods can be used: Dunning’s log-likehood and tf-idf. Dunning’s log-likhood offers an efficient approach to compare two texts. When the value of Dunning’s log-likhood (G2) is 15.13, the significance vale of p is less than 0.0001 (p<0.0001). Then, when G2 is 10.83, p is less than 0.001. When G2 is 6.63, p is less than 0.01. When G2 is 3.84, p is less than 0.05. As a result, Table 1 suggests that Fujian shows the significant difference in the first three volumes, but Zhejiang, Taiwan, Xiamen, Jinmen, and Haicheng were similar based on the statistic method.
Table 1: The difference of the six overlapping places in the first three volumes by using Dunning’s log-likehood. The analysis text is the Manchu volumes, and the reference text is the Chinese volumes.
| Place | Volume 1 | Volume 2 | Volume 3 |
| Fujian | 15.491 | 4.5189 | 5.764 |
| Zhejiang | 0.009 | 1.130 | 1.590 |
| Taiwan | 0.009 | 0.052 | 0.498 |
| Xiamen | 0.476 | 0.891 | 0.384 |
| Jinmen | 0.294 | 0.269 | 0.384 |
| Haicheng | 0.072 | 0.154 | 0.128 |
As analysis above, these six places show difference changes. For Fujian, the difference was less and less significant, but it was still the most different in the first three volumes. Conversely, Zhejiang and Taiwan became more and more different although it was not significant difference based on the Dunning’s log-likhood. Xiamen, Jinmen, and Haicheng did not suggest the significant difference in the first three volumes.
Besides the Dunning’s log-likehood, another effective approach of text mining is tf-idf (term frequency–inverse document frequency). By using the tf-idf approach, the value of six places in these two language versions are showed in Table 3.
Table 3: tf-idf in three volumes in Manchu and Chinese.
| Place | Volume 1 | Volume 2 | Volume 3 | |||||||
| tf | idf | Tf-idf | tf | idf | Tf-idf | tf | idf | Tf-idf | ||
| Fujian | M | 0.487 | 0.720 | 0.350 | 0.2 | 1.610 | 0.322 | 0.363 | 1.012 | 0.368 |
| C | 0.571 | 0.560 | 0.320 | 0.2 | 1.610 | 0.322 | 0.375 | 0.981 | 0.368 | |
| Zhejiang | M | 0.128 | 2.054 | 0.263 | 0.05 | 2.996 | 0.150 | 0.045 | 3.091 | 0.141 |
| C | 0.071 | 2.640 | 0.189 | 0.05 | 2.996 | 0.150 | 0.063 | 2.772 | 0.173 | |
| Taiwan | M | 0.064 | 2.747 | 0.176 | 0.225 | 1.492 | 0.336 | 0.432 | 0.840 | 0.054 |
| C | 0.071 | 2.640 | 0.189 | 0.2 | 1.609 | 0.322 | 0.344 | 1.068 | 0.076 | |
| Xiamen | M | 0.167 | 1.792 | 0.299 | 0.25 | 1.386 | 0.347 | 0.068 | 2.686 | 0.183 |
| C | 0.143 | 1.946 | 0.278 | 0.275 | 1.291 | 0.355 | 0.094 | 2.367 | 0.222 | |
| Jinmen | M | 0.141 | 1.959 | 0.276 | 0.175 | 1.743 | 0.305 | 0.068 | 2.656 | 0.183 |
| C | 0.125 | 2.079 | 0.260 | 0.175 | 1.743 | 0.305 | 0.094 | 2.367 | 0.222 | |
| Haicheng | M | 0.013 | 4.357 | 0.056 | 0.1 | 2.303 | 0.230 | 0.023 | 3.784 | 0.086 |
| C | 0.018 | 4.025 | 0.072 | 0.1 | 2.303 | 0.230 | 0.031 | 3.466 | 0.108 | |
What can the statistics show? The statistics can at least tell readers two facts. First, as mentioned above, categorizing them in two clusters, the large scale cluster including Fujian, Zhejiang, and Taiwan, shows that they became increasing different. Additionally, the Manchu version might describe large places more precise than Chinese version did, but both equally described the city or small scale places.
Why did Fujian decrease its difference over time? Comparing to the comparison of city scale, the government focuses on cities because the war between the Qing and Zheng had become locally. This fully explains why a lot of cities, towns, and villages appeared in the second volume. As a result, either Chinese or Manchu recorded the similar tendency because they were probably written based on the same sources.
According to the analyses, a lot of differences are obvious. For example, Manchu people are more frequently mentioned in Manchu version; by contrast, Han Chinese are more frequently mentioned in Chinese version. Additionally, by analyzing Dunning’s log-likehood and tf-idf, the six overlapping places in all three volume suggests that the importance of places change over time. Although the two versions are basically similar in their structures and archives, they are significantly different. Consequently, the Manchu and Chinese versions are not translated from each other. After comparing three major proper nouns– place, person, and position, it suggests that the Manchu version is more precise than Chinese.