A ‘Mecca of Patriotism’: The Commemorative Monuments of the Guilford Battle Ground Park and Shifting Views toward Historic Preservation
Nathanael Greene Monument. Photo courtesy of the National Park Service.
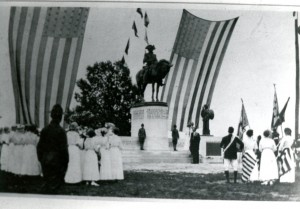
Guilford Courthouse National Military Park is located in north-central North Carolina about six miles northwest of downtown Greensboro. The park encompasses about 220 acres, which protect the core of the largest, most hotly contested battle of the American Revolution’s climactic Southern Campaign. In 1887, under the direction of Judge David Schenck, the Guilford Battle Ground Company (GBGC) was chartered for the purpose of preserving and adorning the American Revolution battlefield at Guilford Courthouse in North Carolina. Motivated foremost by patriotism, the GBGC erected approximately 30 monuments and memorials between 1888 and 1917 at the Guilford Battle Ground Park, of which seven marked grave sites. The history of commemoration at Guilford reflects the developing national commemorative movement that emerged in America in the late 1800s and continued through the early 1900s.
While the GBGC erected the majority of monuments at the battlefield, the War Department continued the tradition from 1917 through 1933 by adding five monuments at the newly established Guilford Courthouse National Military Park (GUCO NMP). Since the National Park Service (NPS) began managing GUCO NMP in 1933, it has removed six monuments from the battlefield and relocated others. In 2016, GUCO NMP gained a new monument sponsored by the reinstated Guilford Battle Ground Company with assistance from several British Regimental Associations to recognize the British Regiments associated with the battle. This monument was the first erected at Guilford in nearly 84 years, as well as the only one associated with the NPS’s management period.
Although the GBGC, the War Department, and the NPS have shared the same underlying goal of preserving the historic Guilford battlefield, each entity has taken its own approach to achieve this end. In my paper, I will examine how the creation and removal of monuments throughout the various periods at Guilford correlate with shifting cultural attitudes and ideas toward commemoration and historic preservation. I will use a combination of qualitative and quantitative methods to identify patterns in the monuments at Guilford—ranging from the individuals and groups who sponsored the monuments to the subjects they honored, their materials, artistic styles, and distinct placement in the landscape.
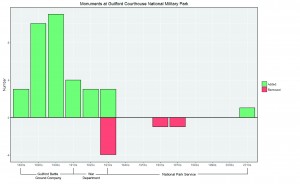
Above, a positive and negative bar graph showing trends in the erection and removal of monuments at Guilford Courthouse National Military Park across the decades in relation to its different periods of management under the Guilford Battle Ground Company, the War Department, and the National Park Service.
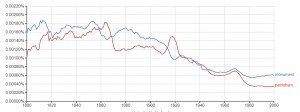
Above, image from the Google Books Ngram Viewer showing how the words “monument” and “patriotism” have occurred throughout a corpus of American English books from 1880-2000. The peak and decline in use of this word in writing generally follows the overall trend of the erection and removal of monuments at Guilford and other sites across the country.
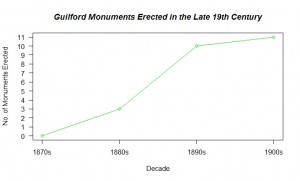
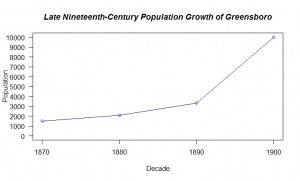
Above, line graphs shows how the development of the Guilford Battle Ground Park paralleled the growth of the city of Greensboro.
In 1890, Schenck wrote:
“Now that Greensboro has the certain prospect of becoming a large city and extending northward towards the Battle Ground, it is easy to foresee that so interesting and beautiful a place as this, abounding in shade, and supplied with abundance of the purest water, must in the near future, become the park of the city, where its citizens can go for rest and recreation; and that summer cottages will be built up around it where the families of the city can escape the heat and dust and enjoy the fresh air of a delightful country resort.”[1]
[1] David Schenck, “To the Stockholders of the Guilford Battle Ground Company, Greensboro, NC, March 15, 1890,” in David Schenck Papers, 1849-1917, Folder 16: Volume 15: 1887-1900: Scan 36 (Southern Historical Collection, The Wilson Library, University of North Carolina at Chapel Hill).

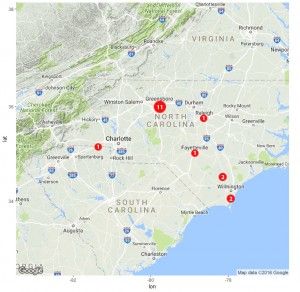
Above, a map showing the concentrations of monuments commemorating the American Revolution erected in North Carolina in the 1890s. In this decade, the state gained 10 new monuments commemorating the American Revolution of which nine were erected at the Guilford Battle Ground Park.
*During the first decade of the 20th century, the state did not gain any monuments commemorating the American Revolution. While Guilford (and other sites) did gain monuments during this period, the subjects they commemorated bore other associations. For example, during this decade the Guilford Battle Ground Company erected monuments to commemorate Judge David Schenck, the company’s first president, and to Clio, the Muse of History, among others.
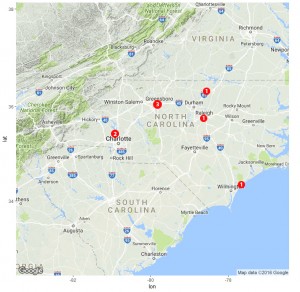
Above, a map showing the concentrations of monuments commemorating the American Revolution erected in North Carolina in the 1910s. In the decade, commemoration expanded to other areas across the state, such as near the cities of Raleigh and Fayetteville, and Wilmington. Of the 17 monuments erected across the state during this period to commemorate the American Revolution, over half were at the Guilford Battle Ground Park. Note that the map also shows one American Revolution monument erected near the border in Blacksburg, South Carolina where the battle of Kings Mountain occurred.
Above, map showing the concentrations of monuments commemorating the American Revolution erected in North Carolina in the 1920s.

Above, map showing the concentrations of monuments commemorating the American Revolution erected in North Carolina in the 1930s. At this point, the numbers across the state are dwindling.
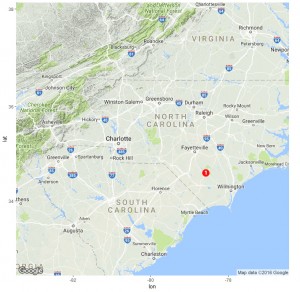
Above, map showing the concentrations of monuments commemorating the American Revolution erected in North Carolina in the 1940s. There were no other Revolutionary War monuments erected in the state until July 2016 when Guilford gained its new Crown Forces monument.
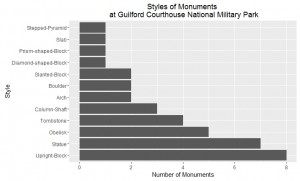
The following bar graphs show patterns in the materials, styles, and subjects of the monuments.
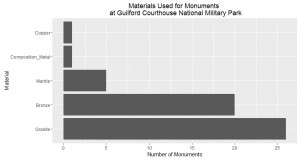
The vast majority of the monuments at Guilford were carved from granite due to its abundance in the area and accessibility from the Mount Airy Granite Quarry. While several of the monuments incorporated cast bronze sculptures, many others contained bronze tablets with quotations. In the latter half of the nineteenth century, the popularity of bronze eclipsed marble as a medium for sculpture due to the development of specialized foundries and the proliferation of trained labor and equipment. Much of the bronze work at Guilford can be traced to two foundries: the Bureau Brothers of Philadelphia, Pennsylvania, and W. H. Mullins, Manufacturer of Architectural Sheet Metal Work and Statuary, of Salem, Ohio.
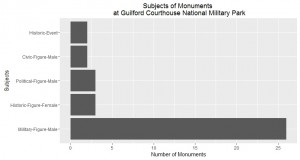
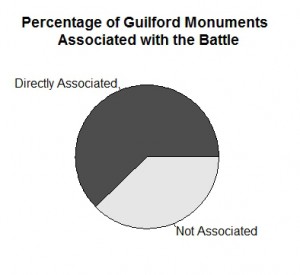
In addition to seeing Guilford as a “park of the city,” Schenck also saw the site as the state’s common burial ground for the American Revolution. Accordingly, the vast majority of monuments at Guilford honored “successful heroes and statesmen.” There were a few, however, commemorating historical female figures, as well as others that commemorated other events, such as the Battle of Kings Mountain. Thus, it is not surprising that a large percentage of monuments at Guilford do not have a direct association with the Battle of Guilford Courthouse.
The GBGC-era reveals how historic preservation was characterized by attempts to keep certain memories alive through the creation of monuments and memorials. During the NPS-era, cultural attitudes shifted away from the production of monuments as historic preservation focused more on “authenticity” and “integrity” of the site’s Revolutionary War period. More recently, the NPS has begun to recognize the significance of the site’s commemorative period. Today, Guilford presents a key preservation challenge for its managers, who must determine how to balance the site’s past with its present as its significance continues to fluctuate over time.
R Codes
#To create a bar graph showing the addition and removal of Monuments at Guilford across the decades
library(ggplot2)
dat <- read.table(text = “ Variable Decade Monuments
1 Added 1880s 3
2 Removed 1880s 0
3 Added 1890s 10
4 Removed 1890s 0
5 Added 1900s 11
6 Removed 1900s 0
7 Added 1910s 4
8 Removed 1910s 0
9 Added 1920s 3
10 Removed 1920s 0
11 Added 1930s 3
12 Removed 1930s -4
13 Added 1940s 0
14 Removed 1940s 0
15 Added 1950s 0
16 Removed 1950s 0
17 Added 1960s 0
18 Removed 1960s -1
19 Added 1970s 0
20 Removed 1970s -1
21 Added 1980s 0
22 Removed 1980s 0
23 Added 1990s 0
24 Removed 1990s 0
25 Added 2000s 0
26 Removed 2000s 0
27 Added 2010s 1
28 Removed 2010s 0”,header = TRUE,sep = “”,row.names = 1)
dat1 <- subset(dat,Monuments >= 0)
dat2 <- subset(dat,Monuments < 0)
ggplot() +
geom_bar(data = dat1, aes(x=Decade, y=Monuments, fill=Variable),stat = “identity”) +
geom_bar(data = dat2, aes(x=Decade, y=Monuments, fill=Variable),stat = “identity”) +
geom_bar(stat = “identity”, color = “black”) +
scale_fill_manual(values =c(“#66cc99”, “#ff6666”)) +
guides(fill = guide_legend(override.aes = list(colour = NULL))) +
guides(colour = FALSE) +
ggtitle(“Monuments at Guilford Courthouse National Military Park”) +labs(x=”Decade”, y=”Number”) +
geom_hline(yintercept=0)
#To create a map of North Carolina showing the distribution of American Revolution monuments in the 1890s **I applied the same code to create other maps, but with different coordinates and sizes for the points. I had difficulty creating annotations in R so I used Adobe Illustrator.
library(ggmap)
myLocation <- c(-84.917575, 33.954619, -75.002153, 36.679869) #creates a map of North Carolina based on bottom left and top right coordinates
myMap <- get_map(location=myLocation,
source=”google”, maptype = “terrain”, crop=FALSE, zoom = 7) #defines the source and type of the map, as well as its zoom
ggmap(myMap)+
geom_point(aes(x = -80.842286, y = 35.222339), colour = “red”, alpha = .5, size = 4)+
geom_point(aes(x = -79.798653, y = 36.046642), colour = “red”, alpha = .5, size = 6) #defines the points on the map and their sizes
#To create a line graph showing the number of monuments erected at Guilford per decade in the late 1800s
monuments <- c(0, 3, 10, 11) #creates the point values for the line
g_range <- range(0, monuments) #creates the range for the y-axis
plot(monuments, type=”o”, col=”green”, ylim=g_range,
axes=FALSE, ann=FALSE) #plots the green line
axis(1, at=1:4, lab=c(“1870s”,”1880s”, “1890s”, “1900s”)) #adjusts the labels on the x-axis
axis(2, las=1, at=1*0:g_range[2]) #adjusts the tick marks on the y-axis
title(main=”Guilford Monuments Erected in the Late 19th Century”, col.main=”black”, font.main=4) #adds a main title in black and italics
box() #adds a box around the graph
title(xlab=”Decade”, col.lab=”black”) #adds a black title to the x-axis
title(ylab=”No. of Monuments Erected”, col.lab=”black”) #adds a black title to the y-axis
#To create a line graph showing Greensboro’s increase in population
population <- c(1497, 2105, 3317, 10035) #creates the point values for the population correlating with each decade plotted
g_range <- range(0, population) #creates the range for the y-axis
plot(population, type=”o”, col=”blue”, ylim=g_range,
axes=FALSE, ann=FALSE) #plots the blue line
axis(1, at=1:4, lab=c(“1870”,”1880”, “1890”, “1900”)) #labels the decades on the x axis
axis(2, las=1, at=1000*0:g_range[2]) #adjusts the tick marks on the y-axis
title(main=”Late Nineteenth-Century Population Growth of Greensboro”, col.main=”black”, font.main=4) #adds a main title in black and italics
box() #adds a box around the graph
title(xlab=”Decade”, col.lab=”black”) #adds a black title to the x-axis
title(ylab=”Population”, col.lab=”black”) #adds a black title to the y-axis
#To create a pie chart showing percentages of monuments either directly or not associated with the battle
x <- c(23, 14) #creates the values
labels <- c(“Directly Associated”, “Not Associated”) #creates the labels for the values
pie(x, labels, main = “Percentage of Guilford Monuments \n Associated with the Battle”, col = grey.colors(length(x))) #creates the title split on two lines and fills the chart with a grey scheme
#To create a bar graph ranking the subjects of monuments
library(ggplot2)
dat <- read.table(text = “Subject Number
1 Military-Figure-Male 26
2 Historic-Figure-Female 3
3 Civic-Figure-Male 2
4 Political-Figure-Male 3
5 Historic-Event 2”,header = TRUE,sep = “”,row.names = 1)
ggplot(dat, aes(x=reorder(Subject, -Number), y=Number)) +
geom_bar(stat=”identity”) +
ggtitle(“Subjects of Monuments \n at Guilford Courthouse National Military Park”)+
xlab(label = “Subjects”)+
ylab(label = “Number of Monuments”)+
scale_y_continuous(breaks = c(0,5,10,15,20,25, 30))+
coord_flip()
#To Create a bar graph ranking the styles of monuments
library(ggplot2)
dat <- read.table(text = “Style Number
1 Statue 7
2 Slab 1
3 Boulder 2
4 Tombstone 4
5 Stepped-Pyramid 1
6 Obelisk 5
7 Upright-Block 8
8 Slanted-Block 2
9 Diamond-shaped-Block 1
10 Prism-shaped-Block 1
11 Column-Shaft 3
12 Arch 2”,header = TRUE,sep = “”,row.names = 1)
ggplot(dat, aes(x=reorder(Style, -Number), y=Number)) +
geom_bar(stat=”identity”) +
ggtitle(“Styles of Monuments \n at Guilford Courthouse National Military Park”)+
xlab(label = “Style”)+
ylab(label = “Number of Monuments”)+
coord_flip()
#To Create a bar graph ranking the materials used for monuments
library(ggplot2)
dat <- read.table(text = “Material Number
1 Granite 26
2 Bronze 20
3 Marble 5
4 Copper 1
5 Composition_Metal 1”,header = TRUE,sep = “”,row.names = 1)
ggplot(dat, aes(x=reorder(Material, -Number), y=Number)) +
geom_bar(stat=”identity”) +
ggtitle(“Materials Used for Monuments \n at Guilford Courthouse National Military Park”)+
xlab(label = “Material”)+
ylab(label = “Number of Monuments”)+
scale_y_continuous(breaks = c(0,5,10,15,20,25, 30))+
coord_flip()
Great post Stephanie
Here’s how to put the numbers in the bubbles for your monuments map.
library(ggmap)
myLocation <- c(-84.917575, 33.954619, -75.002153, 36.679869) #creates a map of North Carolina based on bottom left and top right coordinates
myMap <- get_map(location=myLocation, maptype="terrain", crop=FALSE, zoom=7)
#Create dataframe
lon<- c(-79.798653,-80.842286)
lat<- c(36.046642,35.222339)
count <- c(9,1)
df<-data.frame(lon,lat,count)
ggmap(myMap)+ geom_point(data=df,aes(x =lon, y = lat), colour = "red", alpha=.5, size=2)+geom_point(data=df,aes(x =lon, y =lat), colour = "red", alpha = .5, size = 9)+geom_text(data=df,aes(label=count),size=4,vjust=.5, colour="white")
#add geom_text to put monument count in point