Current Capabilities
- Time-resolved IR (SS-FTIR; QCL based TRIR; ultrafast IR)
- TR Raman spectroscopy & imaging
- FTIR imaging with MCT FPA
- TR fluorescence, FCS & imaging
New Methods Development
- Microfluidics Ultrafast Mixing
- Isotope Edited IR
- Photo-triggering using caged reagents
- Laser-induced pH jump
- Laser-induced potential jump
Measuring fast reaction kinetics: microfluidic flow-mixing, hyperspectral FTIR measurements of the light induced turnover of photosystem II (PSII) are shown to the right.
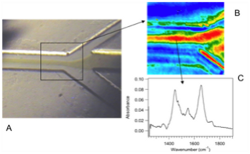 The visible image (panel A) shows the IR microfluidics cell (channels ~ 50 µm), with the sample stream flowing from right to left. The sheath buffer streams also enter from the right in a “Y” configuration. The PSII sample is visible as a green-colored stream that is focused to a jet by the sheath buffer flow. The central square represents the region imaged by the FTIR microscope. Panel B shows the IR image plotted at the maximum of the amide I absorbance at 1655 cm-1, where red corresponds to maximum absorbance (~100 mOD) and blue corresponds to minimum absorbance. The FTIR image shows the distribution of the protein in the microfluidics flow, illustrating the hydrodynamic focusing of the sample stream. The FTIR spectrum at a single pixel along the jet is shown in panel C. This spectrum shows the protein amide I and II modes and the very low noise level of the measurement (~1mOD). As the PSII sample flows into the lighted observation region, it begins to turn over and the FTIR spectrum evolves as the flow moves down the microfluidics channel. Thus, the FTIR spectra along the flowing stream represent the time-evolution of light-induced O2 production by PSII, with 5 µs time resolution.