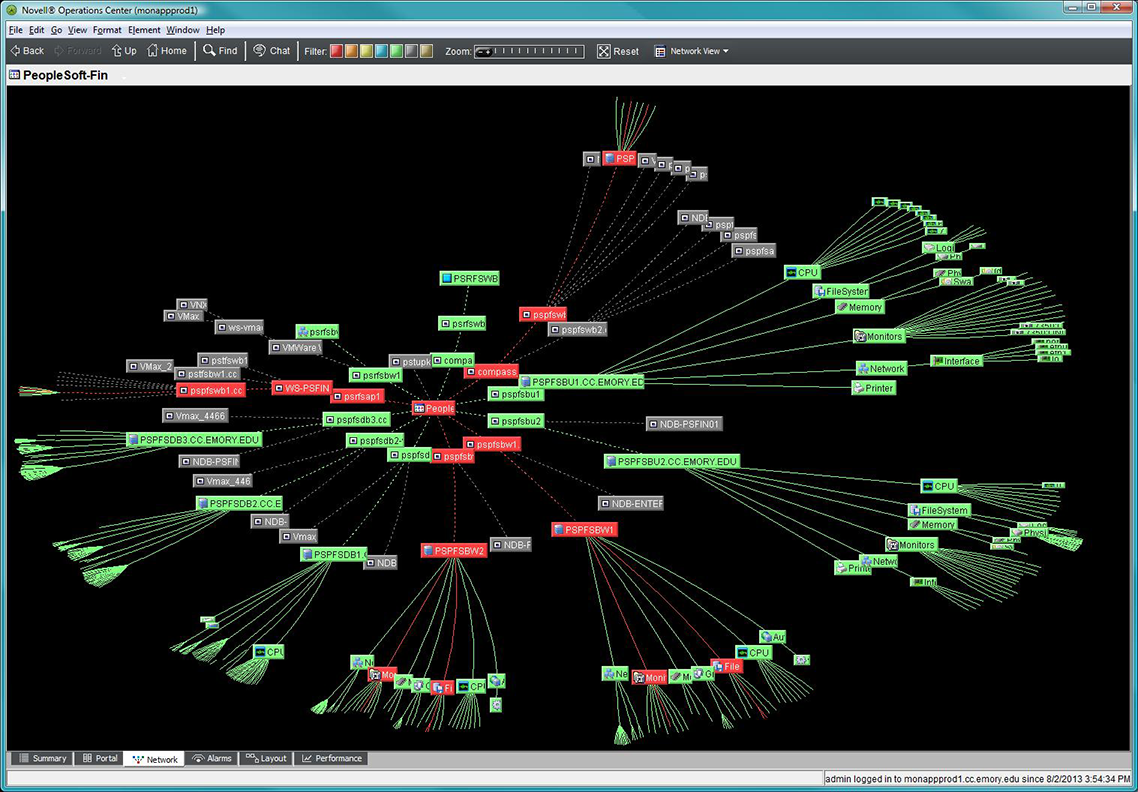
Monitoring a Service View (click for larger view)
How can we, as IT Professionals, be better at what we do?
How can we keep an increasingly complicated environment available and useful to a wide range of customers with different levels of interest in the technical details?
My answer? Use Quantitative Analysis (QA) to help us understand what’s happening in our environment on a real time and historic basis by correlating seemingly independent symptoms and allowing us to act before there are negative impacts to our services, applications, and reputations.
At the beginning of this year, Brett challenged the UTS managers and directors to answer the question: Is management more art or more science? In a recent presentation to the UTS Director Team, Kevin Chen (Manager, UTS Integration Team) posed the question again. Kevin argued for management as science and explained the use of QA as a tool to measure, predict, and react. Specifically, he cited this Hubbard Decision Research framework:
- Define the Decision – Understand what behaviors and outcomes are fundamentally important to you and your customers. Decide what activity can be measured to determine if these desired outcomes are being met.
- Model the Current Uncertainty – Not all things can be measured with 100% certainty so it is critical to understand which measurements are more trustworthy than others.
- Prioritize Measurements – With limited resources and with an understanding of the relative uncertainty of some measurements, you must commit to which measurements are important and which are not.
- Measure What Matters – With the understanding of what measurements are important, the challenge is to collect these in a reliable and consistent manner that doesn’t introduce additional problems to the technical ecosphere.
- Optimize the Decision – Do something with these measurements! Correct the problems that are being seen. Decide a slightly different measurement would be more useful. Combine measurements that seem to be related. In short, don’t stop. This becomes a constant process of measuring, analyzing, revising, and then measuring again; it is a continuous process improvement program.
So what does this mean to us? In general, this approach can be used in all of our systems and applications where we care about a quality service being delivered and often have a Service Level Agreement (SLA) in place with our customers. QA can help everyone understand if our services are meeting expectations and give us the tools to improve.
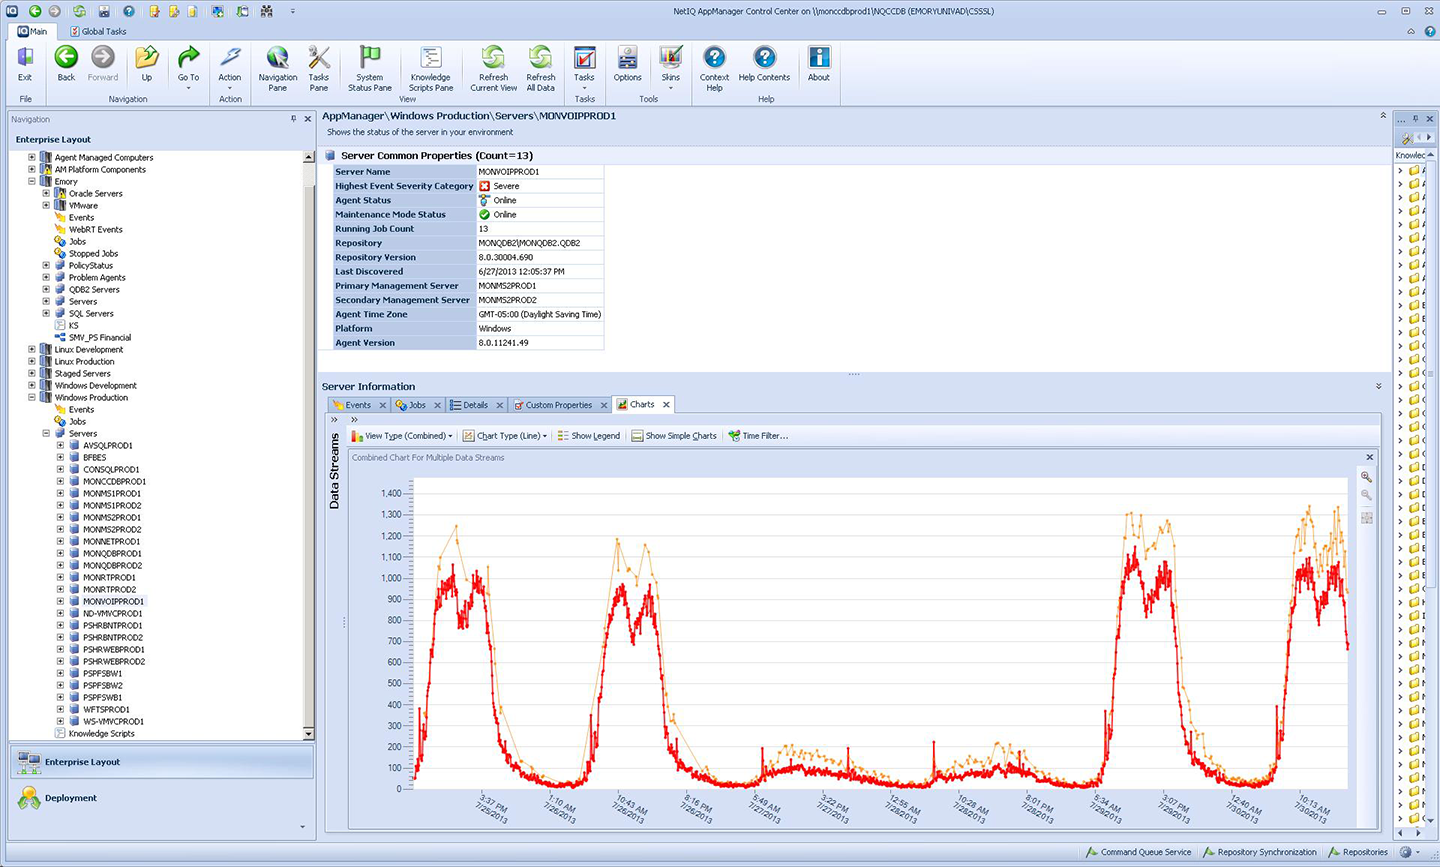
Monitoring Specific Activity (click for larger view)
A great example of QA in action in UTS is the Monitoring Project begun last year. After much work by the project team, we have purchased a NetIQ monitoring tool and are now installing and configuring it. At first glance, this may just look like item #4 above, to measure what matters. In reality, the rollout to each application includes all of these steps when the Monitoring Project team works with each application support group to:
- Decide what needs to be measured, what is important to the customers and end users. (#1 above)
- Understand the best ways to measure, whether it is system level metric monitoring or simulated user connection/performance checks. (#2).
- Configure the NetIQ tool to reliably gather the necessary information without overwhelming support teams with unnecessary “noise.” (#3 & #4)
- Create automated alerts or reports to improve availability or document trending utilization for planning. (#5)
When these steps have been implemented, we’ll have a powerful set of new tools to understand what goes on in our environment (servers, storage, network switches, databases, web servers, etc.) to proactively address minor issues before they become major. This will also give us relief from spending time fixing major problems, returning that time to work on the new projects that really excite our customers.
It’s probably no exaggeration to say that everyone in UTS, and many of our customers, will become involved with the Monitoring Project this year as it becomes a normal part of our operations. Monitoring is a big project. The takeaway here is that QA is incredibly valuable for any IT related task, no matter how small. After all, creating log and performance data seems at times impossible to stop! Getting in the habit of collecting this data, consciously analyzing its reliability and value, and making decisions based on this analysis will helps all of us spend less time fixing broken systems and more time creating new and improved systems.